I. Introduction
In today's fast-paced and interconnected world, investing in the stock market has become more accessible. Therefore, this comprehensive guide will equip you with the knowledge and tools to trade Microsoft stock confidently. Whether you're a seasoned investor or a novice looking to dip your toes into the market, understanding the intricacies of dealing with Microsoft shares is crucial for maximizing your potential gains.
A. Technical analysis and its importance for traders
Technical analysis, often regarded as deciphering patterns and trends in stock price movements, involves analyzing historical market data, primarily through charts and indicators. While some skeptics may question the efficacy of technical analysis, its widespread usage among traders and investors cannot be dismissed. Here’s why: this approach is rooted in the belief that historical price patterns tend to repeat, allowing astute analysts to identify potential buying or selling opportunities.
Typically, traders can gauge market sentiment and make informed decisions by examining chart patterns, support, and resistance levels, moving averages, and technical indicators. And that’s not all. The analysis is a valuable tool in stock trading, empowering investors to identify trends, confirm price movements, and manage risk effectively. It provides a structured framework to interpret market data, uncover hidden patterns, and anticipate potential market reversals.
While technical analysis emphasizes the art of pattern recognition, fundamental research focuses on the science of evaluating a company's intrinsic value. Both approaches have their unique strengths and weaknesses. Technical analysis is favored by short-term traders seeking quick profits, while fundamental analysis tends to attract long-term investors seeking undervalued stocks. Integrating these methods can provide a holistic view of the market, blending the art and science of investing.
Beyond technical and fundamental analysis, other types of market analysis offer exciting perspectives. Sentiment analysis gauges market sentiment and investor emotions, using indicators like the put-call ratio or social media sentiment to understand the prevailing market mood. Quantitative analysis employs mathematical models and statistical techniques to assess market behavior, often relying on complex algorithms and historical data. Economic research examines macroeconomic factors such as GDP growth, interest rates, and inflation, identifying trends that may impact the overall market.
Here's the thing, guys: another compelling aspect of technical analysis is identifying support and resistance levels. These critical zones on a price chart act as invisible barriers, shaping the behavior of stocks. Support levels represent price levels at which buying pressure outweighs selling pressure, causing prices to bounce back up. Conversely, resistance levels indicate price ceilings where selling pressure exceeds buying pressure, causing prices to pull back. By pinpointing these levels, traders can anticipate potential price reversals, plan entry, and exit points, and manage risk effectively.
But that’s not all. Technical analysis also unveils a treasure trove of potential trading opportunities. Through technical indicators, traders can uncover hidden patterns, gauge market momentum, and generate trading signals. Indicators such as moving averages, oscillators, and Fibonacci retracements provide valuable insights into price dynamics, overbought or oversold conditions, and potential turning points. By combining these indicators with chart patterns and other technical tools, traders can uncover golden opportunities that may have otherwise gone unnoticed.
B. Overview of Microsoft Stock (NASDAQ: MSFT) and its recent performance
Now, its iconic Windows operating system is at the core of Microsoft's empire. Windows has been the backbone of personal computing for decades, dominating the market with its user-friendly interface and powerful functionality. Beyond the world of operating systems, Microsoft has firmly established itself as a leader in cloud computing. Its cloud platform Azure has become a go-to choice for businesses seeking scalable and secure solutions.
Microsoft's productivity and business processes segment further solidifies its position as an industry titan. With flagship products like Microsoft Office, including popular applications such as Word, Excel, and PowerPoint, the company empowers individuals and enterprises alike to unleash their full potential. But wait, there’s more: Microsoft's collaboration tool, Teams, has also revolutionized remote work, fostering seamless communication and collaboration across organizations.
Microsoft's devices and gaming segment captivate consumers with its hardware and entertainment offerings in personal computing. Microsoft entices tech enthusiasts and gamers with cutting-edge technology and immersive experiences, from the sleek and powerful Surface devices to the Xbox gaming console.
Microsoft's intelligent cloud segment also intertwines the power of artificial intelligence and data analytics. Through Azure AI, Microsoft enables developers and businesses to build smart applications and harness the transformative capabilities of machine learning.
As of June 13, 2023, Microsoft (MSFT) closed at $331.85 in the latest trading session, marking a +1.55% move from the previous day. As of June 2023, Microsoft has a market cap of $2.467 Trillion. According to our data, this makes Microsoft the world's second most valuable company by market cap. Market capitalization, called a market cap, is the total market value of a publicly traded company's outstanding shares and is commonly used to measure how much a company is worth.
The company has made Wall Street bullish with its developing venture into artificial intelligence (AI), a technology with the potential to enhance countless industries in the coming years. The company's stock is already a compelling investment thanks to potent brands like Office, Windows, Azure, and Xbox.
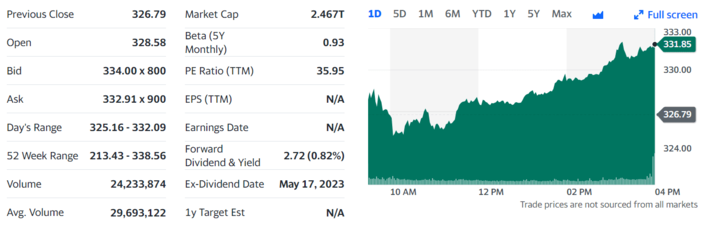
(As of June 13, 2023) Source: Yahoo Finance
The Federal Trade Commission asked for a preliminary injunction in federal court to stop Microsoft from completing its planned $69 billion acquisition of Activision (NASDAQ: ATVI). Activision ticked down 0.8% in regular trading on Monday, June 12, 2023.
Microsoft is adding AI to Bing, and speculations arise whether Google is in trouble.
II. Technical Analysis of the Microsoft (NASDAQ: MSFT) Stock.
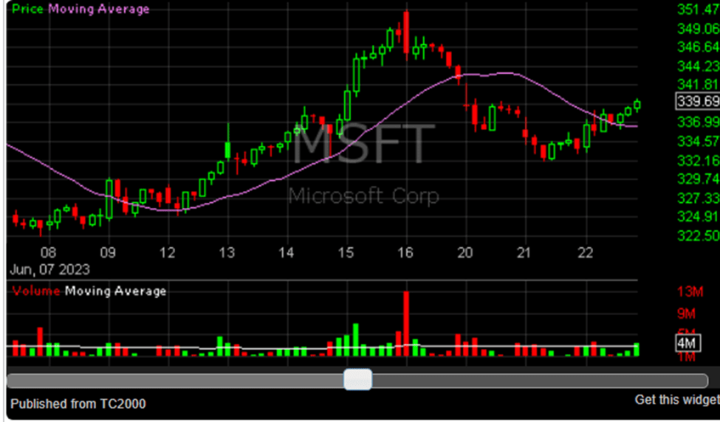
A. Price action and trend of MSFT's stock
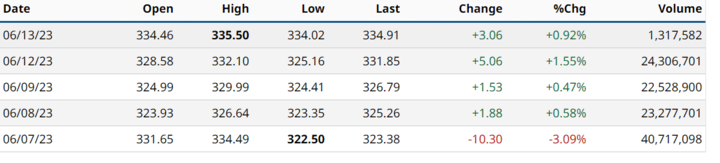
Microsoft’s recent trends in stock performance. (Source: Barchart)
Current Situation of MSFT Stock
Microsoft's historical stock price performance typically reflects its status as a tech powerhouse with a profitability and innovation track record. The company's ability to deliver strong financial results, strategic acquisitions, partnerships, and responsiveness to market trends have propelled its stock price to new heights. For investors seeking a reliable and profitable investment, Microsoft's historical performance is a testament to its long-term growth potential. As the tech industry continues to evolve, Microsoft remains a compelling choice for those looking to capitalize on the company's past successes and future endeavors.
So, while the historical high and low prices may vary over time, it is essential to note that Microsoft's stock has experienced notable highs and lows throughout its journey. The historical high is proof of the company's ability to achieve significant growth and investor confidence, reflecting milestones and positive market sentiments. Conversely, the recorded low can indicate periods of market downturns or temporary setbacks, presenting potential buying opportunities for astute investors.
MSFT Stock Forecast amd Potential
While past performance does not guarantee future results, Microsoft's upward trajectory and ability to rebound from market downturns suggest a strong foundation and growth potential. As you consider the stock's historical performance, you should also evaluate its financial health, market trends, and competitive landscape to make well-rounded investment choices.
Typically, to gauge the relative strength of MSFT, we need to examine its performance in the industry. Microsoft operates in the technology sector, a highly dynamic and competitive landscape encompassing many companies. By evaluating MSFT's performance against its industry peers, investors can gain valuable insights into its competitive positioning.
In fact, Microsoft's industry-leading status becomes apparent when considering its relative strength. The company's consistent innovation, diversified product portfolio, and strong financials have contributed to its robust performance, allowing it to outshine many competitors in the technology sector. This relative strength demonstrates Microsoft's ability to adapt to market trends, capitalize on emerging opportunities, and maintain a competitive edge.
Microsoft's performance can provide insights into its resilience and market influence compared to the broader market. Suppose MSFT exhibits relative strength against the overall market. In that case, it suggests that the company has been able to outperform or weather market downturns more effectively than the average company within the index. This can be attributed to strong financial performance, investor confidence, and market leadership.
B. Analysis of vital technical indicators for MSFT Stock
Moving averages
Moving averages are a simple but effective way to identify trends in a stock's price. A moving average is calculated by taking the average price of a stock over a certain period, such as 50 days or 200 days. When the price of a stock is above its moving average, it is considered to be in an uptrend. When the price is below its moving average, it is considered to be in a downtrend.
Now, the 50-day moving average for MSFT stock is currently at $337.73. If the price of MSFT stock is above $330.00, then the stock is considered to be in an uptrend. If the price of MSFT stock falls below $330.00, then the stock is considered to be in a downtrend.
Analysis of support and resistance levels
Support and resistance levels are important concepts in technical analysis that indicate the price points where the buyers and sellers are likely to enter or exit the market. They can help traders identify potential entry and exit points, as well as determine the trend direction and strength. For Microsoft MSFT stock, we can use various tools and methods to identify the support and resistance levels, such as historical price action, trend lines, moving averages, Fibonacci retracements, and pivot points.
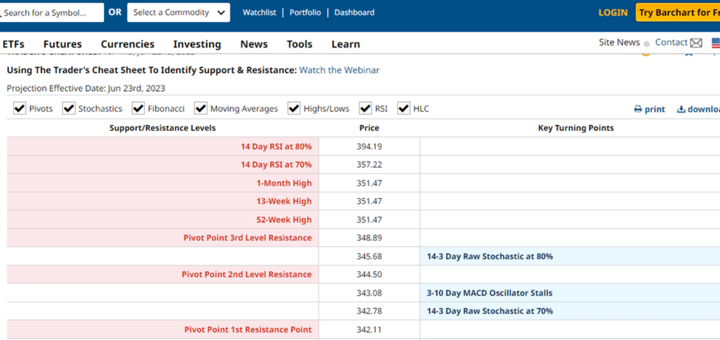
Source: barchart.com
According to the chart, MSFT stock has been in an uptrend since October 2020, reaching a new all-time high of 348.1 on June 15, 2023. However, the stock has also experienced some pullbacks and corrections along the way, forming several support and resistance levels. The most recent support level is around 328.382, which coincides with the 50-day moving average and the 38.2% Fibonacci retracement level of the latest rally from 214.2 to 348.1. The most recent resistance level is around 350.551, which is slightly above the previous high of 348.1 and also near the upper trend line of the ascending channel. If the stock breaks above this level, it could signal a continuation of the uptrend and a possible target of 373.61, which is calculated by adding the height of the channel to the breakout point. On the other hand, if the stock breaks below the support level of 328.38, it could signal a reversal of the uptrend and a possible target of 303.211, which is calculated by subtracting the height of the channel from the breakdown point.
Source: stockconsultant.com
Therefore, traders who are bullish on MSFT stock may look for buying opportunities near the support level of 328.38 or on a breakout above the resistance level of 350.55, with a stop-loss below the support level or below the breakout point respectively. Traders who are bearish on MSFT stock may look for selling opportunities near the resistance level of 350.55 or on a breakdown below the support level of 328.38, with a stop-loss above the resistance level or above the breakdown point respectively.
Relative strength index (RSI)
The RSI is a momentum indicator that measures the speed and magnitude of price changes. An RSI of 70 or above indicates that a stock is overbought, while an RSI of 30 or below indicates that a stock is oversold. The RSI can be used to identify potential buying and selling opportunities.
Currently as shown in the chart below, the RSI for MSFT stock is at 70. This indicates that the stock is in neutral territory. If the RSI rises above 70, then the stock is considered to be overbought and a potential selling opportunity may be present. If the RSI falls below 30, then the stock is considered to be oversold and a potential buying opportunity may be present.
Bollinger Bands
Bollinger Bands are a volatility indicator that helps to identify potential support and resistance levels. Bollinger Bands are created by plotting a moving average around two standard deviations of the price of a stock. When the price of a stock approaches the upper band, it is considered to be overbought. When the price approaches the lower band, it is considered to be oversold.
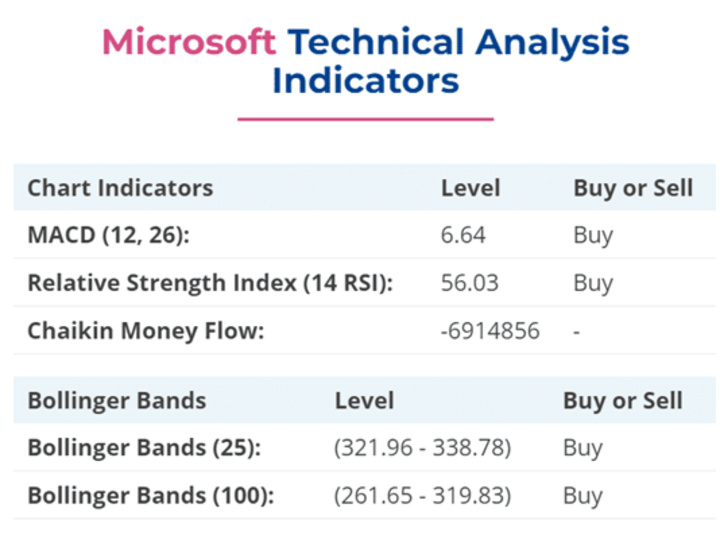
Source: financhill.com
For instance, the Bollinger Bands for MSFT stock are currently at $320.00 and $340.00. This indicates that the stock is trading within a relatively tight range. If the price of MSFT stock breaks above $340.00, then it is considered to be a bullish signal. If the price of MSFT stock breaks below $320.00, then it is considered to be a bearish signal.
MACD (Moving Average Convergence Divergence)
The MACD is a trend-following indicator that helps to identify trend changes and momentum. The MACD is calculated by subtracting the 26-day exponential moving average (EMA) from the 12-day EMA. When the MACD line crosses above the signal line, it is considered a bullish signal. When the MACD line crosses below the signal line, it is considered a bearish signal. The good thing is, the MACD for MSFT stock is currently crossing above the signal line. This indicates that the stock is in a bullish trend and a potential buying opportunity may be present.
These are just a few of the many technical indicators that can be used to analyze MSFT stock. By using a combination of these indicators, you can gain a better understanding of the stock's current trend and potential future movements.
Predicting future price movements in MSFT stock
1. Market and Industry Trends: Monitoring broader market trends and the technology industry landscape can offer clues about MSFT’s future performance. Understanding how MSFT aligns with emerging technologies and market demands can shed light on its growth potential.
2. Financial Performance: Examining MSFT’s financial statements, revenue growth, and profitability can indicate its future trajectory. Solid financials and consistent growth suggest a positive outlook for the stock. For example, in Q2 2023, Microsoft’s revenue was $52.7 billion and increased 2% compared to the corresponding period of last fiscal year.
3. Product Innovations: MSFT’s ability to introduce innovative products and services can significantly impact its future price movements. The success of initiatives such as new software releases, cloud computing services, or advancements in artificial intelligence can drive investor sentiment and influence the stock’s performance.
4. Competitive Landscape: Keeping an eye on MSFT’s competitors and their strategies is essential. Analyzing how MSFT differentiates itself, maintains market share, and responds to competitive pressures can provide insights into its future price movements.
5. Macroeconomic Factors: The broader economic environment can influence MSFT’s stock performance. Factors such as interest rates, inflation, and geopolitical events can impact investor sentiment and the overall market, consequently affecting MSFT stock.
C. How to use chart patterns to identify potential trading opportunities
Head and Shoulders
Imagine a mountain range forming on a stock chart. The head and shoulders pattern consists of three peaks, with the middle peak (the head) being the highest and the surrounding peaks (the shoulders) slightly lower. This pattern suggests a potential trend reversal from bullish to bearish. When the price breaks below the "neckline" connecting the troughs of the shoulders, it may signal a downward movement, offering a potential selling opportunity for traders.
Double Bottoms
Picture the letter "W" forming on a stock chart. The double bottom pattern occurs when the stock price reaches a low point, bounces back, then returns to a similar low before rising again. This pattern indicates a potential trend reversal from bearish to bullish. When the price breaks above the "neckline" connecting the highs between the two bottoms, it may signal an upward movement, providing a potential buying opportunity for traders.
D. Comparison of MSFT's performance to its industry and the broader market
1. Financial Performance: Microsoft’s financial performance is a benchmark for its industry peers. By analyzing key financial indicators such as revenue growth, profitability, and cash flow, we can gauge how Microsoft fares against its competitors. For example, in Q2 2023, Microsoft’s revenue was $52.7 billion and increased 2% compared to the corresponding period of last fiscal year1. In comparison, Apple’s revenue growth was 33% in 2021.
2. Market Share and Competitive Advantages: Microsoft’s dominance in the technology landscape is proof of its market share and competitive advantages. By comparing Microsoft’s market share to its industry peers, we can assess its position within the market. For example, in the cloud infrastructure services market, Amazon Web Services (AWS) has a 32% market share, compared to Microsoft Azure’s 20%. However, Microsoft has a competitive edge in other areas such as gaming with its Xbox console.
3. Financial Ratios: Comparing Microsoft’s financial ratios to those of other companies in the industry and the broader market provides insights into its financial health and efficiency. Key ratios such as price-to-earnings (P/E), return on equity (ROE), and debt-to-equity (D/E) ratios can highlight Microsoft’s valuation, profitability, and financial stability compared to its peers. As of June 2021, Microsoft’s P/E ratio was 36.5x compared to Apple’s 28.5x.
III. Trading Strategies for Microsoft (NASDAQ: MSFT) Stock
1. Trend Following Strategies: Ride the Wave of Success
Now, trend-following strategies involve identifying and capitalizing on established MSFT stock price trends. Traders use this approach to join the trend and profit from upward or downward movements. By employing moving averages and trendlines, trend followers seek to capture substantial gains during strong and sustained price movements.
2. Mean Reversion Strategies: Buying Low, Selling High
So, mean reversion strategies operate on the principle that prices revert to their average or mean value over time. Traders employing this strategy look for situations where MSFT's stock deviates significantly from its average price and bet on the price returning to its historical norm. Mean reversion traders take advantage of overbought or oversold conditions to enter or exit positions, aiming to profit from the price reverting to its mean.
3. Breakout Trading Strategies: Seizing the Moment
Breakout trading strategies involve identifying key support or resistance levels in MSFT's stock price. Traders using this approach patiently wait for the stock price to break above or below these levels, signaling a potentially significant price movement. Breakout traders strive to capture the momentum of the breakout and ride the ensuing trend for maximum profit potential.
Each trading style has its own set of pros and cons:
- Trend-following strategies can provide significant profits during strong trends but may result in losses during choppy or sideways markets.
- Mean reversion strategies can yield profits from price reversals, but accurately timing the entry and exit points can be challenging.
- Breakout trading strategies offer the potential for substantial gains during significant price movements, but false breakouts can lead to losses if not properly managed.
Potential entry and exit points based on technical analysis
- Support and Resistance Levels: Like Building Foundations
Support and resistance levels act as critical markers on MSFT's stock chart. Support levels represent price points where buying pressure is expected to emerge, preventing the stock from falling further. On the other hand, resistance levels signify areas where selling pressure typically arises, impeding the stock's upward movement. By identifying these levels, traders can find potential entry and exit points based on the stock's reaction at these key price levels.
- Trendlines: Following the Path of Success
Trendlines provide valuable insights into the direction and strength of MSFT's stock trend. By connecting consecutive higher lows in an uptrend or lower highs in a downtrend, traders can identify potential entry points in the direction of the prevailing trend. Additionally, trendlines can indicate possible exit points when the stock price breaks below an upward trendline or above a downward trendline.
- Technical Indicators: Unveiling Hidden Patterns
A wide range of technical indicators, such as moving averages, MACD, or RSI, can assist in identifying potential entry and exit points for MSFT stock. These indicators analyze historical price data to uncover patterns, trends, and momentum. For instance, a bullish crossover of moving averages or an oversold reading on the RSI may signal a potential entry point. In contrast, a bearish crossover or an overbought reading may indicate an exit opportunity.
Risk management strategies for trading MSFT's stock
- Stop-Loss Orders: Your Safety Net
Stop-loss orders act as a safety net that automatically triggers the sale of MSFT stock when it reaches a predetermined price level. Setting a stop-loss order defines the maximum acceptable loss you will incur on a trade. If the price of MSFT stock falls to or below this level, the stop-loss order will be executed, protecting you from further potential losses. This technique allows you to limit your downside risk and protect your capital.
- Position Sizing: Finding the Right Balance
Position sizing refers to determining the appropriate amount of capital for each trade based on your risk tolerance and account size. By carefully selecting the size of your positions, you can control the level of risk you are exposed to when trading MSFT stock. It's crucial to consider factors such as the potential loss from a trade, your portfolio diversification, and the amount of capital you can afford to risk. Proper position sizing helps you balance maximizing potential profits and minimizing potential losses.
Use of fundamental analysis to complement technical analysis
The fundamental analysis goes beyond charts and dives into the company's financials, management, industry position, and overall market conditions. By evaluating MSFT's earnings, revenue growth, competitive advantage, and industry trends, fundamental analysis helps determine the stock’s intrinsic value. It examines the "big picture" and uncovers the underlying factors that can impact the long-term value of MSFT stock.
By combining fundamental analysis with technical analysis, traders can comprehensively understand MSFT stock's potential. Fundamental analysis provides the context and helps identify the underlying value, while technical analysis assists in determining optimal entry and exit points based on market timing. The synergy between these approaches helps traders make well-rounded decisions by considering micro and macro perspectives.
Potential catalysts that could impact MSFT's stock price
- Macroeconomic Trends: The Ripple Effect
Global trade tensions and changes in interest rates can send shockwaves through the financial markets, including the price of MSFT stock. Trade disputes between countries, such as tariffs and protectionist policies, can disrupt international business operations and affect MSFT's revenue and profitability. Similarly, shifts in interest rates can impact borrowing costs and consumer spending, which may have consequences for MSFT and its competitors.
- Industry-Specific News: Winds of Change
MSFT operates in a dynamic industry, and industry-specific news can significantly impact its stock price. Changes in government regulations, such as data privacy laws or antitrust measures, can shape the competitive landscape and affect MSFT's operations and market share. Additionally, new product launches or innovations from competitors can alter market dynamics and create opportunities or challenges for MSFT.
- Company-Specific Events: The Inner Workings
MSFT's actions and events can act as catalysts for its stock price. Earnings reports, for instance, provide insights into the company's financial performance, growth prospects, and market expectations. And that’s not all. Positive earnings surprises or robust revenue growth can increase stock prices, while disappointing results may lead to price declines. Similarly, changes in management, strategic partnerships, or major acquisitions can impact investor sentiment and influence the stock's trajectory.
IV. Trade MSFT Stock CFD at VSTAR


Now, let’s explore why you should consider trading MSFT stock CFD at VSTAR. Here are some key points to help you understand the benefits:
● Exceptional Trading Experience: VSTAR's goal is to offer you an outstanding trading experience that sets them apart from other platforms.
● Tight Spreads: VSTAR provides industry-leading tight spreads starting from 0.0 pips. This means you can enjoy ultra-low trading costs and maximize your profit potential.
● Lightning-Fast Order Execution: VSTAR ensures fast order execution, allowing you to seize opportunities and avoid unnecessary losses.
● Leverage Flexibility: With VSTAR, you have the flexibility to take each position with leverage of up to 1:200. This enables you to amplify your trading power and potentially increase your returns.
● Competitive Spreads: VSTAR guarantees competitive spreads from 0.0 pips, ensuring you get filled at the best market prices within milliseconds.
● Fast and Reliable Service: Your trading needs are a priority at VSTAR. They provide fast and reliable service to support you every step of the way.
● Easy Registration: Registering with VSTAR is easy thanks to their simple 2-step registration procedure. Their fast KYC process allows for quick application and approval, so you can start trading without delay.
● 24/7 Live Support: Rest assured, VSTAR offers live support 24/7 during market hours to assist you whenever you need help.
● Security Measures: VSTAR is a multi-regulated and reliable broker authorized and regulated by CySEC (Cyprus Securities and Exchange Commission) under license number 409/22. They are also a proud member of the Cyprus Investor Compensation Fund, ensuring the protection of your funds. VSTAR's operations adhere to the stringent industry standards of the European Regulatory Framework of MiFID II.
● User-Friendly Trading App: The VSTAR trading app is designed to cater to traders of all kinds. It offers an easy-to-use interface and enhances your trading experience on mobile devices, allowing you to focus solely on trading and take full advantage of opportunities. You can easily explore "Popular Markets" to identify potential trades and stay ahead of the game.
● Risk-Free Demo Account: VSTAR offers a risk-free demo account where you can access real trading conditions and test your strategies in a live environment without the risk of loss. This allows you to experience their institutional-grade trading services and familiarize yourself with their platform before transitioning to live trading.
VSTAR is dedicated to providing you with the best possible trading experience. So, consider exploring the benefits of trading MSFT stock CFD with VSTAR and take your trading to the next level!
V. Conclusion
In conclusion, technical analysis is a powerful tool to help traders maximize their profits when trading Microsoft (NASDAQ: MSFT) stock. Traders can make well-informed decisions and seize trading opportunities by analyzing price patterns, identifying trends, and utilizing various technical indicators. So, harness the power of technical analysis, stay updated with market trends, and keep refining your trading strategy. With dedication and practice, you can embark on a rewarding journey of maximizing your profits while trading Microsoft stock. Happy trading!