


- Surplus Storage: Natural gas storage rose by 10 Bcf, surpassing the five-year average and last year's stocks by 303 Bcf and 341 Bcf, respectively.
- Price Fluctuations: Henry Hub spot and futures prices declined, while regional spot prices varied due to weather and demand shifts.
- Global Impact: Significant international LNG price drops might influence domestic natural gas prices.
- Demand Surge: A 21.0% rise in U.S. natural gas consumption driven by colder weather and increased residential usage.
The analysis of recent EIA data reveals a story of surplus storage, pricing complexities, and shifting demand dynamics. Amidst changing weather patterns and global market influences, the price trajectory of CFDs on natural gas faces uncertainties. Understanding these intricate nuances is key to deciphering potential market movements and investment decisions in this volatile energy sector.
Interpretation of U.S. Energy Information Administration Data
Storage Data
The reported total natural gas storage of 3,836 Bcf as of November 24, 2023, reflects a net increase of 10 Bcf from the previous week. This increase exceeded the five-year average by 303 Bcf and surpassed last year's stocks by 341 Bcf. Comparatively, this marks a 9.8% increase from the previous year and an 8.6% surplus compared to the five-year average. These figures indicate a robust supply of natural gas in storage, potentially influencing price dynamics.
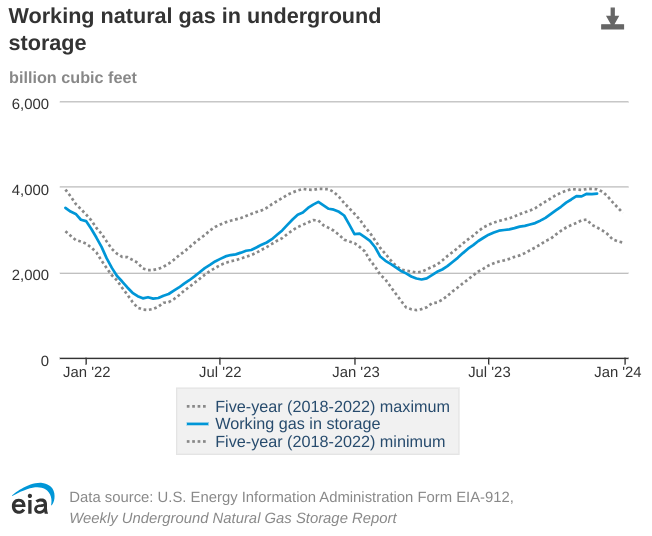
Source: eia.gov
Market Highlights
Henry Hub Spot and Futures Prices: The Henry Hub spot price decreased marginally by 2 cents from $2.72 per MMBtu to $2.70/MMBtu. Simultaneously, the December 2023 NYMEX contract expired at $2.706/MMBtu, declining by 19 cents from the previous week. The January 2024 NYMEX contract price also dropped to $2.804/MMBtu, down 23 cents from the preceding week.
Regional Spot Prices: Notably, prices rose in most areas, with variations such as a significant decrease of $1.23/MMBtu at the Algonquin Citygate and an increase of $2.00/MMBtu at Northwest Sumas. These fluctuations resulted from diverse factors like weather, demand shifts, and supply constraints.
International Futures Prices
The international natural gas futures prices witnessed a considerable decrease this week. The weekly average front-month futures prices for LNG cargoes in East Asia fell to $16.57/MMBtu from $31.01/MMBtu in the same week last year. Similarly, prices at the Title Transfer Facility (TTF) in the Netherlands dropped to $13.97/MMBtu from $40.01/MMBtu last year. This significant decline in international prices might have repercussions on domestic natural gas prices.
Supply and Demand
Supply: The average total supply of natural gas increased by 1.0% (1.1 Bcf/d) from the previous week. This uptick was attributed to a 0.3% (0.3 Bcf/d) rise in dry natural gas production, reaching a weekly average of 105.5 Bcf/d. Additionally, average net imports from Canada surged by 14.5% (0.8 Bcf/d) from the last week.
Demand: Notably, total U.S. consumption of natural gas rose significantly by 21.0% (17.3 Bcf/d) compared to the previous week. This surge was mainly driven by a substantial 50.8% (13.8 Bcf/d) increase in residential and commercial sector consumption due to colder weather. Furthermore, natural gas consumed for power generation rose by 6.7% (2.1 Bcf/d) week over week.
Liquefied Natural Gas (LNG)
Pipeline Receipts: Fluctuations were observed in natural gas deliveries to U.S. LNG export terminals, with changes in deliveries to terminals in various regions.
Vessels Departing U.S. Ports: The detailed departure of 24 LNG vessels from different ports, carrying a combined LNG-carrying capacity of 91 Bcf between November 23 and November 29. These departures signifies the volume of LNG leaving U.S. ports and potentially balancing excess domestic supply through global demand in LNG markets.
Rig Count
The natural gas rig count increased by 3 rigs from the previous week to 117 rigs. The rise in rig count might indicate increased drilling activity in the natural gas sector, potentially leading to higher production levels in the future.
Possible Implications on Price of CFDs on Natural Gas
Supply and Storage Levels
The unexpected 10 Bcf injection into storage, occurring late in November, could signify a shift from historical patterns. Typically, this period sees withdrawals, but the injection implies surplus supply. The higher-than-average storage levels, surpassing both the five-year average and last year's stocks, might exert downward pressure on prices.
Demand Dynamics
The substantial surge in demand, especially from the residential and commercial sectors due to colder weather, suggests a potential bullish sentiment. However, increased consumption for electric power generation might counterbalance this, potentially limiting the upward movement in prices.
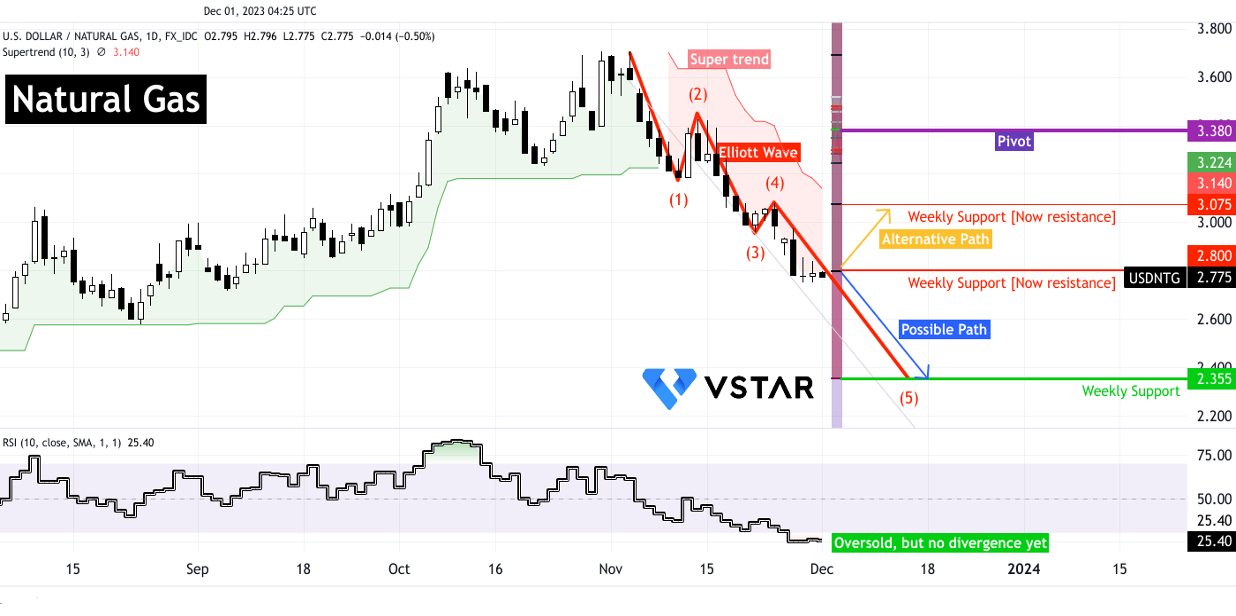
Technical Take on USD/Natural Gas
Looking at the CFD price (USD/Natural Gas), the last bearish impulsive wave (red wave) is in motion. If the downtrend accelerates from here, it may hit weekly support at $2.355 (derived from the Fibonacci retracement), following the path highlighted by the blue arrow. This path is most probable in the coming days.
Conversely, looking at the Relative Strength Index (RSI), prices have already reached oversold levels. However, there is no bullish divergence. Furthermore, current-emerged Doji candles represent market indecision. Overall, towards the upside, these 2 developments are signaling that natural gas may take an alternative path (marked by a yellow arrow) to test $3.075.

Source: tradingview.com
In conclusion, supply dynamics, unexpected storage injections, increased demand due to weather conditions, regional variations, international market shifts, and drilling activity all contribute to a complex landscape.


