


EURUSD
Fundamental Perspective
Following the release of this week's pivotal economic data, investors are turning their attention to the upcoming week, which features the European Union's Harmonized Index of Consumer Prices (HICP) and Gross Domestic Product (GDP) reports on Tuesday, as well as another interest rate decision from the Federal Reserve scheduled for Wednesday.
On Wall Street, there is a prevailing anticipation of a further deterioration in European economic conditions, with EU GDP projected to decline to a mere 0.2% for the third quarter, compared to 0.5% in the second quarter. Additionally, the EU HICP is expected to reveal a pan-European inflation drop from 4.3% to 3.4% year-on-year by the end of October.
Technical Perspective
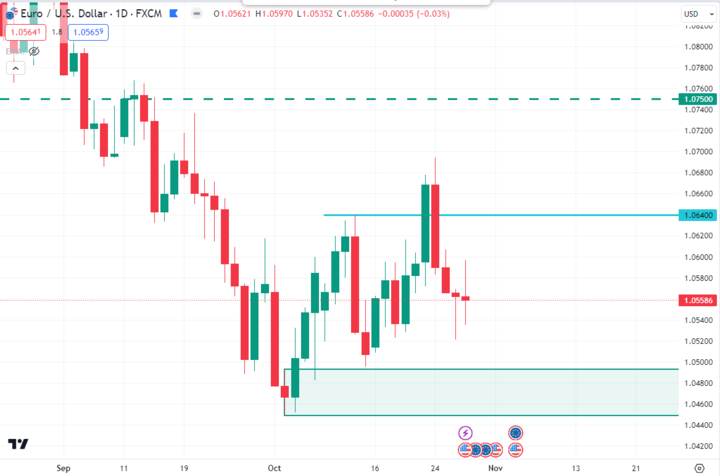
Source: TradingView
EURUSD ended the weekly candle at the 1.0558 price area with a bearish possibility. In the previous week, bulls tried to take control of the price after breaking above the 1.0640 necklines, but failed to sustain the momentum.
On the bearish side, EURUSD may continue further downside toward the 1.0490 - 1.0450 demand zone area. In this context, if the price comes down to the 1.0490 - 1.0450 demand zone area and has a strong daily bullish candle, bulls may push the price higher toward the 1.0750 event level area.
GBPJPY
Fundamental Perspective
The GBP/JPY fluctuated within a familiar lower range during the week, closing just above the 181.00 threshold by the end of Friday's trading session. The currency pair reached a weekly low of 181.04 before rebounding to 181.40 at the close.
As we look ahead to the coming week, the focus will be on central bank actions, specifically from the Bank of Japan (BoJ) and the Bank of England (BoE). The BoJ is scheduled to announce its latest interest rate decision on Tuesday, with investors closely monitoring the possibility of adjustments to the Japanese central bank's policy framework.
Persistent inflation levels in Japan have surpassed the BoJ's initial expectations, causing concerns about inflation falling below the 2% target. The prolonged period of elevated inflation has left Japanese consumers seeking action from the BoJ to protect their diminishing purchasing power, as the Yen has been steadily depreciating due to global interest rate differentials.
On the British Pound (GBP) side, the BoE is scheduled to make its rate announcement on Thursday. However, the consensus in money markets is leaning heavily toward an expected decision to maintain the current interest rates, given the ongoing challenges facing the UK economy.
Technical Perspective
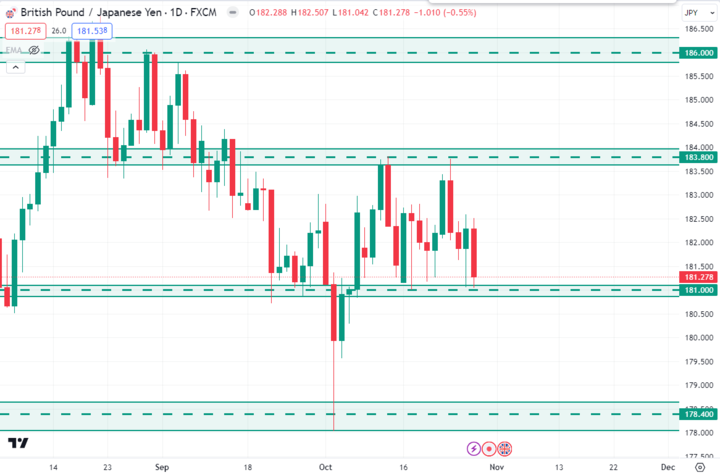
Source: TradingView
GBPJPY has made a new range area, which is around the 183.80 to 181.00 price level. GBPJPY is currently trading around the 181.27 price area, near the 181.00 psychological support level.
Therefore, if the price can form a daily bullish candle close above the 181.00 support level, bulls could extend the momentum at the 183.00 resistance area in the day ahead.
On the other hand, the continued downside pressure and a bearish D1 candle below the 181.00 support level could initiate a discount towards the 178.40 psychological level.
NAS100
Fundamental Perspective
In the week spanning from October 30, 2023, to November 3, 2023, the NASDAQ 100 (NAS100) is poised for a dynamic trading environment. Recent data underscores the influence of tech sector performance and macroeconomic factors on the index. Tech companies' earnings reports, particularly the FAANG stocks, will be pivotal in shaping market sentiment.
Investors should pay close attention to their revenue growth, profit margins, and guidance, as these metrics often sway NAS100 movements.
Furthermore, the Federal Reserve's upcoming rate decision on November 1, 2023, will be a critical event to watch. Any signals related to monetary policy adjustments can significantly impact the NAS100. Meanwhile, developments in global trade relations and any shifts in government regulations affecting tech companies should not be overlooked.
The market will also scrutinize inflation data and jobs reports for insights into the U.S. economy's health. These factors, along with the ongoing geopolitical landscape, will contribute to the NAS100's direction.
Technical Perspective
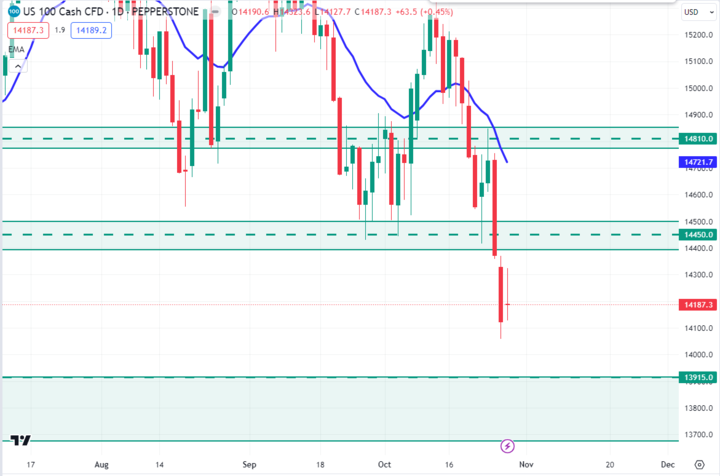
Source: TradingView
NAS100 broke below the $14450.0 support level and is currently residing around the $14187.0 price area.
As per the current price action context, the price may recover higher toward the $14450.0 price area before continuing the bearish momentum further.
So, if the price retraces toward the $14450.0 price area and rejects with an impulsive bearish candle close, the bears may sustain the bearish trend toward the $13915.0 support area in the coming days.
S&P500 (SPX500)
Fundamental Perspective
The Standard & Poor's index experienced its second consecutive week of losses, pushing it into correction territory with a 10% decline from its July high of approximately $4,600. The S&P 500 index concluded Friday's session with a decrease of around 20 points, resulting in a half-percent decline, closing at $4,117.37.
Simultaneously, the Dow Jones Industrial Average lost over 366 points, marking a 1.12% drop and closing the week at $32,417.59.In contrast, the NASDAQ Composite index defied the bearish sentiment on Friday by gaining 47.41 points, registering an almost 0.4% increase and closing at $12,643.01.
Equity markets faced broad declines as inflation continued to pose challenges for the Federal Reserve (Fed). The US Personal Consumption Expenditure (PCE) Index indicated a notable month-on-month increase in consumer price spending, the most substantial since May. Although the annual PCE moderated slightly in September, concerns about the persistence of "higher for longer" interest rates have resurfaced.
The Fed is scheduled for another rate decision next Wednesday. While money markets currently anticipate an unchanged rate next week, the likelihood of an additional rate hike in December is steadily mounting. This is due to the robust performance of the US economy relative to global competitors and the persistent inflation that exceeds initial expectations.
Technical Perspective

Source: TradingView
S&P 500 trades around the $4120.17 critical area. In the latest week, bears tried breaking below the $4210.00 support level and reached the May 2023 low. Considering the current price context, an upward correction is pending toward the $4210.00 price area.
So, if the price retraces upward toward the $4210.00 resistance area and rejects with an impulsive daily bearish candle close, bears may sustain the bearish momentum toward the $4050.00 event area in the days ahead.
HK50
Fundamental Perspective
As we look ahead to the trading week from October 30, 2023, to November 3, 2023, the Hang Seng Index (HK50) faces a mix of challenges and opportunities. Recent data reveals that the index has been responding to global economic dynamics and geopolitical events. The ongoing Evergrande debt crisis, along with concerns about China's economic slowdown, continue to influence market sentiment.
Furthermore, investors should closely monitor regulatory developments affecting Chinese tech companies, as these can have a substantial impact on the HK50's performance. In particular, any updates on regulatory actions related to fintech and e-commerce giants could lead to market volatility.
Technical Perspective
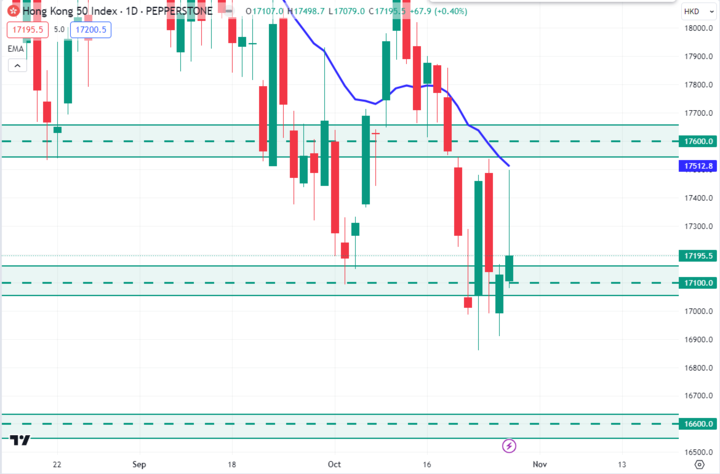
Source: TradingView
HK50 was rejected from the dynamic level of 20 EMA and currently resides around the $17195.50 price area.
Therefore, if the price can have an impulsive daily bearish candle close below the $17100.0 support level, bears may push the price down toward the $16600.0 price area in the days ahead.
On the other hand, the continuing volatility could eliminate the bearishs structure, where a daily candle above the 20 EMA could alter the current market structure.
Bitcoin (BTCUSD)
Fundamental Perspective
The 2023 Bitcoin (BTC) price rally remains intact due to its consistent pattern of forming higher highs and higher lows. In September, BTC bulls experienced a setback, resulting in a lower high on the weekly chart. However, this setback was followed by a significant surge in bullish momentum, leading to another higher high this week.
Although the technical indicators appear favorable, investors should exercise caution, considering that the recent rally was triggered by the listing of BlackRock's spot ETF ticker on the DTCC website. Subsequent reports revealed that this listing had been present on the website since August, which somewhat diminishes the significance of the recent rally and may encourage some investors to take profits.
Technical Perspective
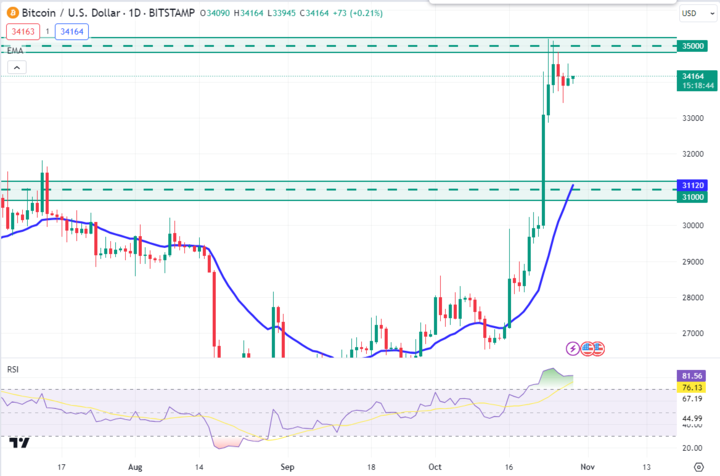
Source: TradingView
BTC price pushed higher and hit the $35000 mark. Currently, BTC is trading around the $34168 price area and may retrace down toward the dynamic level of 20 EMA.
So, if the price retraces toward the $31000 support level and bounces with a D1 candle, bulls may push the price upward and hit the $35000 price area.
On the other hand, the RSI indicator is showing an overbought situation in the market, which indicates a possible downward retracement may happen. Therefore, a deeper correction towards the 30,000.00 level could limit the buying possibility at any time.
Ethereum (ETHUSD)
Fundamental Perspective
In the week from October 30, 2023, to November 3, 2023, Ethereum (ETH) faces a significant juncture. Recent developments in the decentralized finance (DeFi) sector have contributed to heightened ETH demand, driving prices upward. The launch of Ethereum 2.0 and its transition to a proof-of-stake (PoS) consensus mechanism are key drivers underpinning ETH's potential.
However, regulatory scrutiny on the crypto industry remains a concern, and any adverse announcements may trigger price fluctuations. ETH's upcoming network upgrades, including the Ethereum Improvement Proposal (EIP) 1559 and EIP-3675, could further impact its performance.
Technical Perspective

Source: TradingView
ETH broke above the $1530.0 - $1750.0 range area and is currently trading around the $1792.3 price level. After breaking over the $1750.0 resistance area, the price has retraced and had a daily bullish candle close above the $1750.0 level. As per the current price action, the price may recover further upside toward the $1930.0 psychological event area in the days ahead.
Tesla (TSLA)
Fundamental Perspective
For the week of October 30 to November 3, 2023, Tesla Inc. (TSLA) faces a mixed outlook. As of its last earnings report, TSLA reported strong revenue growth but missed earnings per share expectations. Its stock price currently hovers around $900, maintaining a stable trend. Several factors will influence TSLA's performance, including ongoing supply chain challenges, increasing competition in the electric vehicle market, and potential impacts from global economic conditions.
Investors should closely monitor TSLA's Q3 2023 earnings report, scheduled for release in early November, for insights into the company's financial health and growth prospects. Additionally, any updates on production targets and progress in expanding manufacturing capacity, particularly in China and Germany, will be pivotal. TSLA's stock may react to broader market trends and macroeconomic indicators, so keeping an eye on economic data releases and market sentiment will be essential for a comprehensive analysis.
Technical Perspective

Source: TradingView
TSLA stock broke below the $212.50 support level and is currently residing around the $207.30 price area. As per the current price action, if the price has another D1 candle below the $212.50 price area, bears may sustain the pressure toward the $180.00 price area.
On the contrary, if the price had an impulsive daily bullish candle close above the $212.50 price area, bulls may regain momentum and push the price upward toward the $242.20 resistance area in the coming days.
GOLD (XAUUSD)
Fundamental Perspective
The price of gold has, indeed, breached the significant $2000 per ounce mark on Friday, driven by growing geopolitical concerns. The ongoing conflict between Israel and Hamas has the potential to escalate and involve more countries in the region. As of the time of this writing, the XAU/USD pair is trading at $2000, rebounding from its daily low of $1972.12.
Technical Perspective
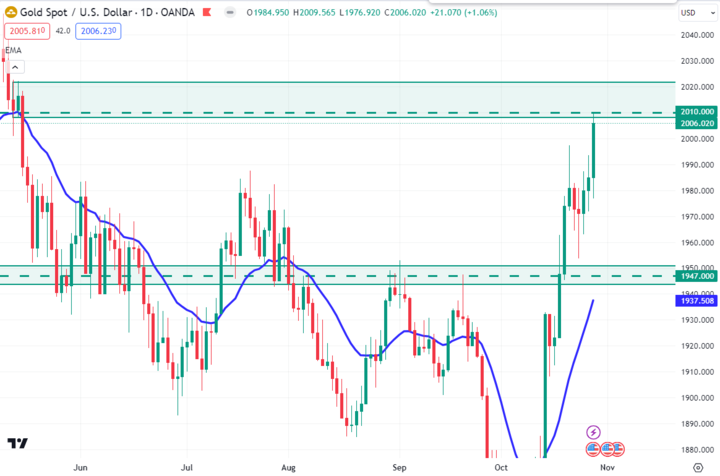
Source: TradingView
The gold price hit the daily order block area and is currently trading around the 2006.00 price area.
As per the current situation, if the price can have an impulsive daily bearish candle close below the 2010.00 resistance area, Gold may retrace down toward the dynamic level of 20 EMA, which is around the 1947.00 psychological event area.
On the other hand, a bullish extension could be potent following the recent Weekly candle close, which can increase the price toward the 2048.00 resistance level.
OIL (WTI)
Fundamental Perspective
West Texas Intermediate (WTI) Crude Oil barrels are currently experiencing a range of volatility, with prices fluctuating between $85.55 and $81.90 USD per barrel. Energy markets are actively hedging their positions within this midrange. The oil markets are facing ongoing turbulence, with developments in the Middle East capturing market attention. Traders are closely monitoring the situation in the Gaza Strip conflict, which continues to make headlines.
Early on Friday, two separate Egyptian Red Sea towns were hit by stray projectiles, underscoring global market concerns about the potential spillover effects of the escalating Israel-Hamas conflict into neighboring regions. While Israel had planned a full-scale invasion of Gaza, they have not executed this strategy yet. However, Israeli forces launched their largest ground attack on the contested region on Friday.
Technical Perspective
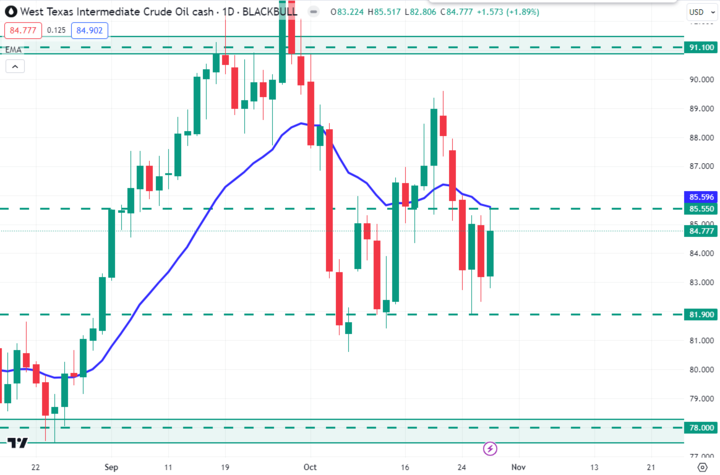
Source: TradingView
Oil price is currently fluctuating inside the range of $85.55 - $81.90 price area. As per the current scenario, if the price had a daily bullish candle close above the $85.55 resistance area, bulls may push the price higher toward the $91.10 key resistance level in the days ahead.
On the contrary, if the price had a daily bearish candle close below the $81.90 support level, bears may push the price down toward the $78.00 price area in the coming days.


