


EURUSD
Fundamental Perspective
In the most recent Friday trading session, the EUR/USD pair exhibited significant strength by surging to 1.0730, culminating in a weekly gain of 1.50%, marking its most robust performance since mid-June.
Several key factors influenced the pair's daily market dynamics. Notably, the US dollar experienced a notable decline in value due to the Federal Reserve (Fed) adopting a more dovish stance and signaling the potential conclusion of its tightening cycle during their announcement on Wednesday.
In response to this shift, US Treasuries registered their lowest yields since September, with the 2-year, 5-year, and 10-year rates declining to 4.84%, 4.50%, and 4.57%, respectively. This substantial drop in yields exerted further downward pressure on the US dollar.
Technical Perspective
Source: TradingView
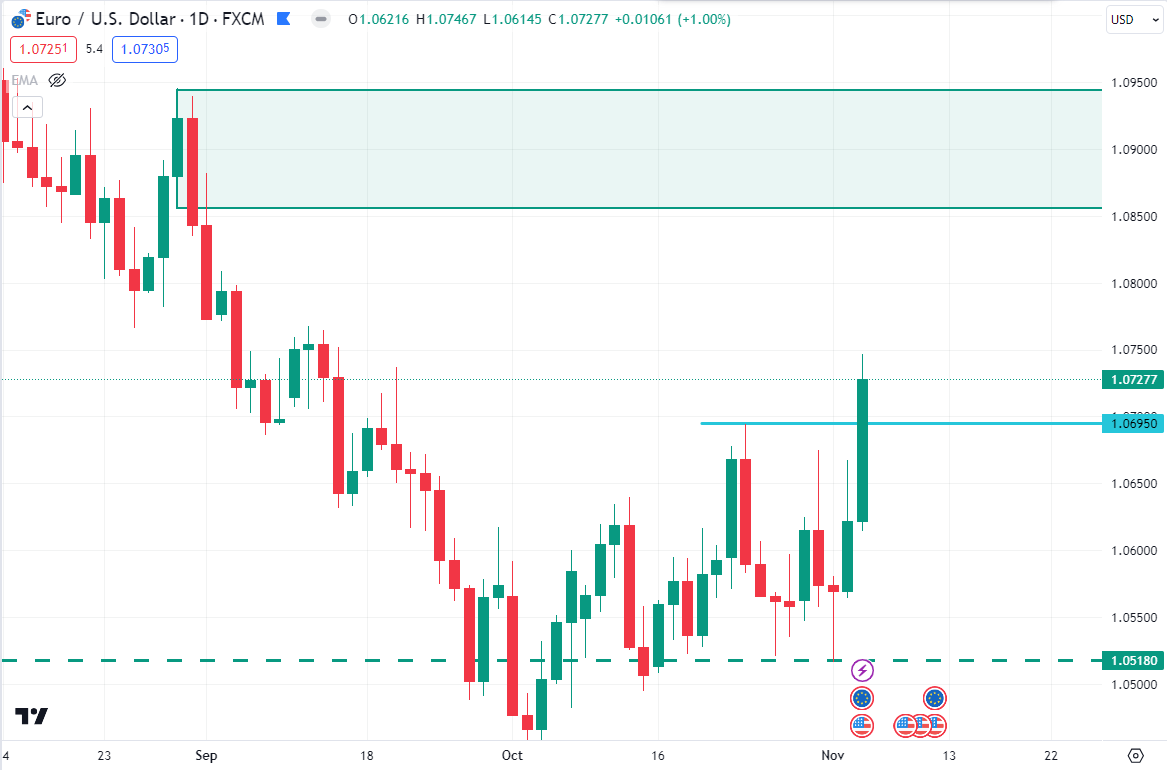
EURUSD price surged upward last week on Friday and closed the week around the 1.0727 price area. After bouncing from the 1.0518 psychological event level, bulls regained momentum and pushed the price higher quite impulsively.
As per the current EURUSD weekly forecast, the price may retrace down toward the 1.0695 price area, before continuing upward toward the 1.0860 - 1.0950 order block zone.
On the other hand, a continued downside pressure with a bearish D1 close below the 20 EMA could lower the price towards the 1.0450 level.
GBPJPY
Fundamental Perspective
The GBP/JPY pair has breached the 185.00 level as the market approaches the final hours of the trading week, ascending to an 8-week peak amid a notable resurgence in overall market risk appetite.
The Japanese Yen (JPY) has encountered a decline in value, primarily due to the recent dovish stance adopted by the Bank of Japan (BoJ). This change in policy stance has somewhat undermined the previous efforts by the BoJ to support the beleaguered JPY verbally.
In contrast, the Pound Sterling (GBP) has been making significant gains, positioning itself as one of the leading performers on Friday. This rebound comes despite some fluctuations earlier in the week when the Bank of England (BoE) opted to maintain interest rates.
As we move into the upcoming week, there is a relative scarcity of economic data directly impacting the GBP/JPY pair. GBP traders will closely monitor BoE Governor Andrew Bailey's scheduled appearance on Wednesday, while Yen investors will be attentive to Japan's wage figures set for early release on Tuesday, followed by JPY Trade Balance data on Wednesday.
Technical Perspective
Source: TradingView
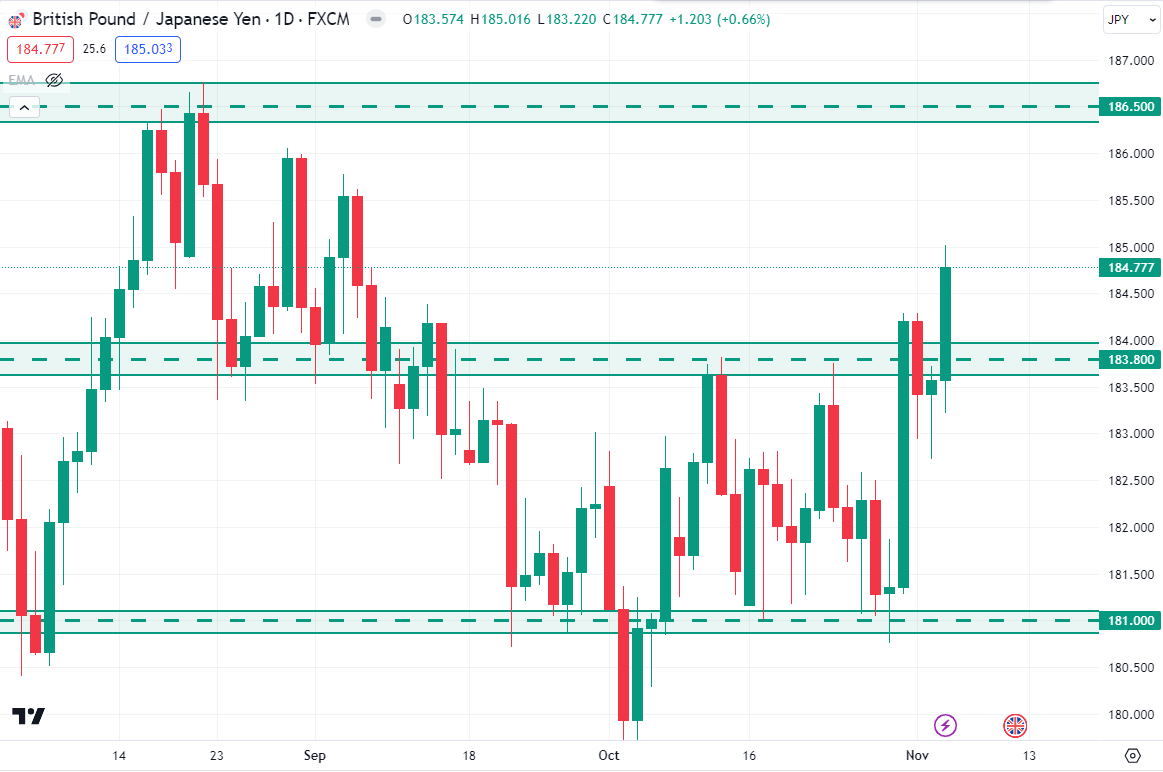
GBPJPY price experienced a huge upside movement last week and broke above the 181.00 - 183.80 range area. Therefore, we are expecting that the price may retrace down toward the 183.80 support level, from where a daily bullish candle above the 183.80 level could initiate the upward possibility towards the 186.50 psychological level.
On the bearish side,183.800 level would be a crucial price to look at as a stable bearish market pressure could lower the price towards the 181.000 level.
NAS100
Fundamental Perspective
In the week of November 6th to November 10th, 2023, the NASDAQ 100 (NAS100) index is poised for a dynamic performance, fueled by ongoing tech sector strength. Recent data highlights the index's resilience, with technology giants consistently posting robust earnings and fueling investor confidence.
The NAS100's performance is expected to remain closely tied to technology sector developments, with investors keeping a watchful eye on corporate earnings reports and product launches from major tech companies. The upcoming week will also see the release of various economic indicators, with particular attention to inflation data and employment figures, as these can influence investor sentiment and market dynamics.
Overall, the NAS100 is positioned to capitalize on the tech sector's momentum, but it may face intermittent volatility based on market sentiment and macroeconomic developments, especially in the tech space. Traders should stay attuned to earnings reports and economic releases to navigate potential opportunities and risks effectively.
Technical Perspective
Source: TradingView
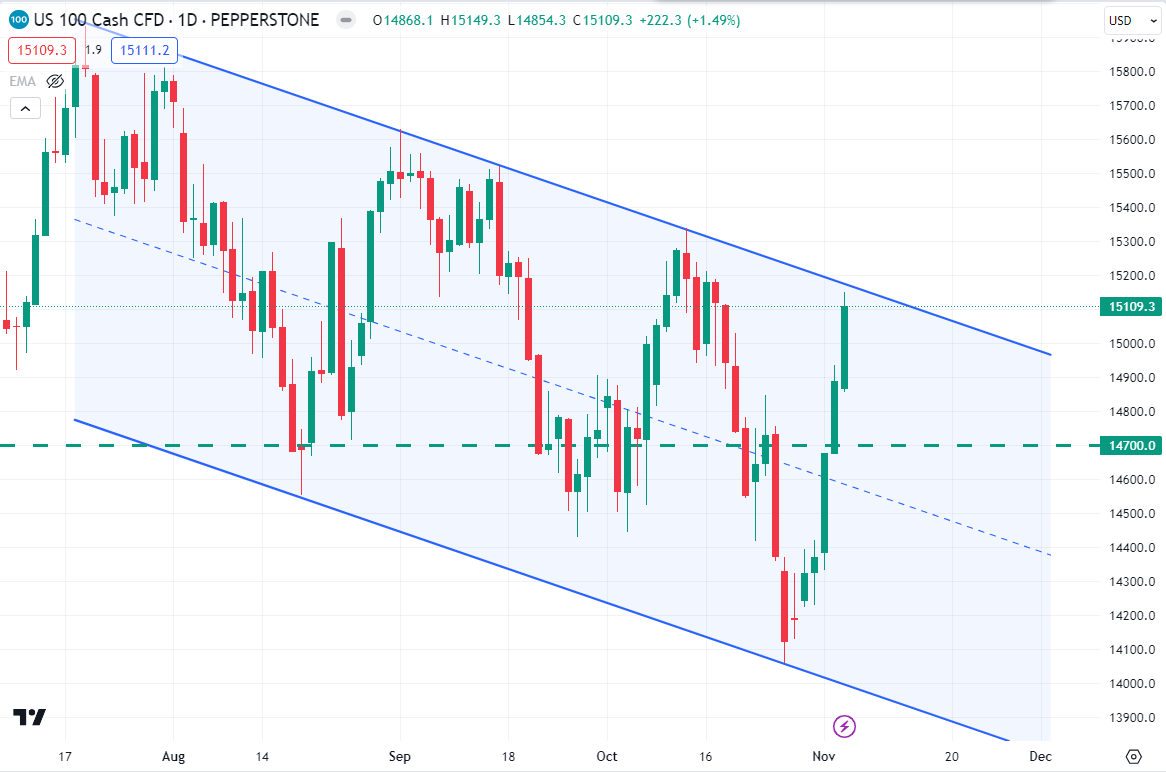
NAS100 is currently trading around $15109.3 price area and trying to move further upside. The price has been trading inside the bearish channel for an extended period.
As per the current situation, the price may recover higher toward the bearish channel’s resistance. So, if the price recovers toward the channel resistance and rejects with a daily bearish candle, bears may regain momentum toward the $14700.0 price area.
On the other hand, a bullish continuation above the $15400.00 level could extend the pressure above the $15850.00 level.
S&P 500 (SPX500)
Fundamental Perspective
The S&P 500 (SP500) faces a pivotal week from November 6th to November 10th, 2023, with multiple factors at play. Recent data indicates that the index has been resilient, achieving record highs due to strong corporate earnings and robust economic growth.
However, uncertainties surrounding the Federal Reserve's monetary policy stance, particularly in light of inflation concerns, may introduce a degree of volatility. Investors will closely scrutinize any hints of interest rate adjustments in the Federal Open Market Committee (FOMC) meeting minutes.
Additionally, the SP500's performance is intertwined with global trade dynamics, including developments in the U.S.-China trade relationship, which can impact multinational corporations listed on the index.
Technical Perspective
Source: TradingView
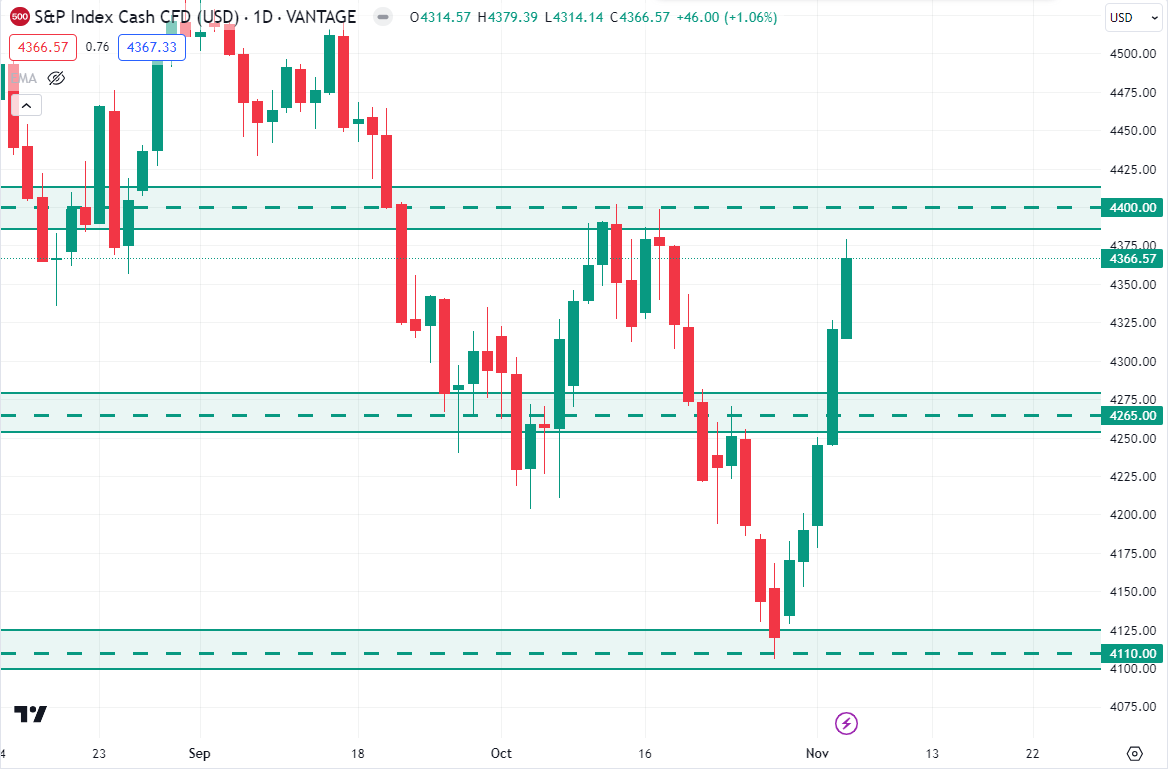
S&P 500 price moved higher last week after bouncing from the $4110.00 psychological support level. Bears failed to sustain the momentum below the $4110.00 event level and experienced strong counter pressure.
As per this market structure, we may expect the price to move further upward toward the $4400.00 resistance level. After that,a strong bearish rejection from the $4400.00 price area could offer a short opportunity, targeting the $4265.00 support level.
HK50
Fundamental Perspective
For the week of November 6th to November 10th, 2023, the Hong Kong Hang Seng Index (HK50) presents an intriguing outlook. Recent data highlights that the index has been resilient in the face of global economic fluctuations and geopolitical developments.
The performance of HK50 will likely be influenced by ongoing trade relations between the U.S. and China, as well as the impact of global economic indicators on Hong Kong's export-driven economy. Notably, the tech sector within the index may see volatility as regulatory concerns continue to weigh on certain stocks.
Additionally, the HK50's performance may be affected by inflation trends, as higher inflation can impact consumer sentiment and corporate earnings. Investors will closely monitor Hong Kong's domestic economic data, including retail sales, manufacturing output, and property market developments.
Technical Perspective
Source: TradingView
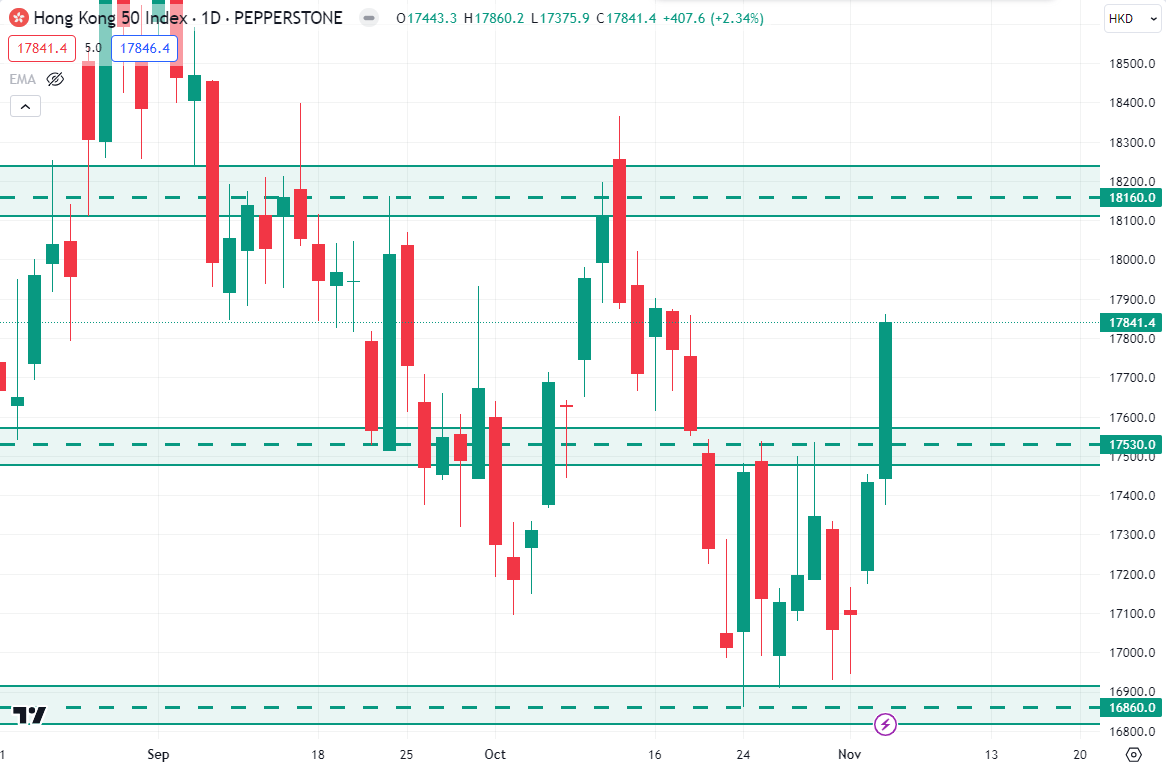
HK50 bounced from the $16860.0 support level and broke over the $17532.0 resistance level last week with a daily bullish candle close. As per the current price action context, the price may retrace down to the $17530.0 support level before continuing higher toward the $18160.0 psychological level.
Bitcoin (BTCUSD)
Fundamental Perspective
In the aftermath of the recent Bitcoin rally, the cryptocurrency's price has settled into a sideways movement. The potential for a downward trend at this juncture might be attributed to investors seeking to lock in profits. Surprisingly, this sentiment doesn't seem to apply to the 17.2 million BTC currently in circulation.
The recent surge in Bitcoin's price has prompted some individuals to sell their BTC holdings for profit, while others are holding onto their positions, anticipating a return to the $40,000 mark. This optimism is primarily fueled by the expectation of the approval of a spot Bitcoin ETF in the near future, which could trigger significant profit-taking at the $40,000 level.
However, this only scratches the surface of the overall Bitcoin investor landscape. According to Glassnode's HOLD waves metric, the supply of BTC aged between three months and ten years has remained largely unchanged, even in the face of a 32% rally that occurred in the latter part of October.
These long-held BTC holdings represent approximately 88% of the total circulating supply of Bitcoin, totaling over 17.285 million BTC, with a combined value of nearly $600 billion. This unwavering conviction is further underscored by the fact that following the rally, when the market was anticipating substantial profit-taking, less than $2 billion worth of BTC was actually sold for profits over the entire week.
Subsequently, realized profits have reverted to their average levels, confirming that BTC holders are patiently waiting for a considerably higher price point before considering divestment.
Technical Perspective
Source: TradingView
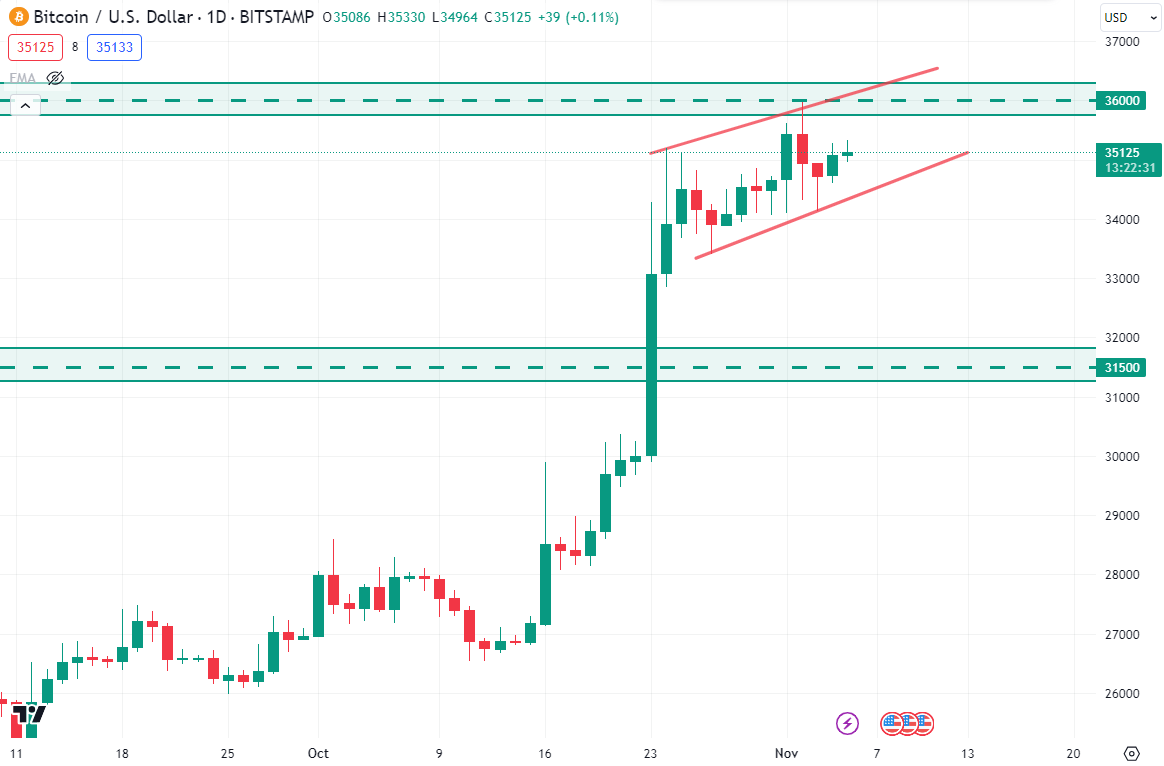
BTC price hit May 2022’s high as the bulls are still optimistic. Currently, the price is residing below the $36000 price area and forms a bullish channel on the daily chart.
As per the current price action, the price may retrace down to the $31500 support level before continuing higher. Therefore, if bulls can have an impulsive daily bearish candle close below the bullish channel’s support, the price may move down toward the $31500 area.
Ethereum (ETHUSD)
Fundamental Perspective
Ethereum has seen a notable increase in the holdings of large wallet investors within its network. The proportion of the altcoin supply held by these significant addresses has shown consistent growth from May to November 2023.
Over the past 24 hours, the price of ETH has remained stable, following a 3.15% increase for holders. Large wallet investors in the Ethereum ecosystem have steadily accumulated more ETH in the last six months. Data from the crypto intelligence tracker, Santiment, reveals a correlation between this accumulation and a spike in ETH's price, as well as an increase in the token's supply held by prominent network participants.
Concurrently, there has been a consistent decrease in Ethereum's supply on exchanges, alleviating the downward selling pressure on the asset. This reduction in ETH reserves on exchanges is a positive factor for Ethereum's long-term price prospects.
Technical Perspective
Source: TradingView
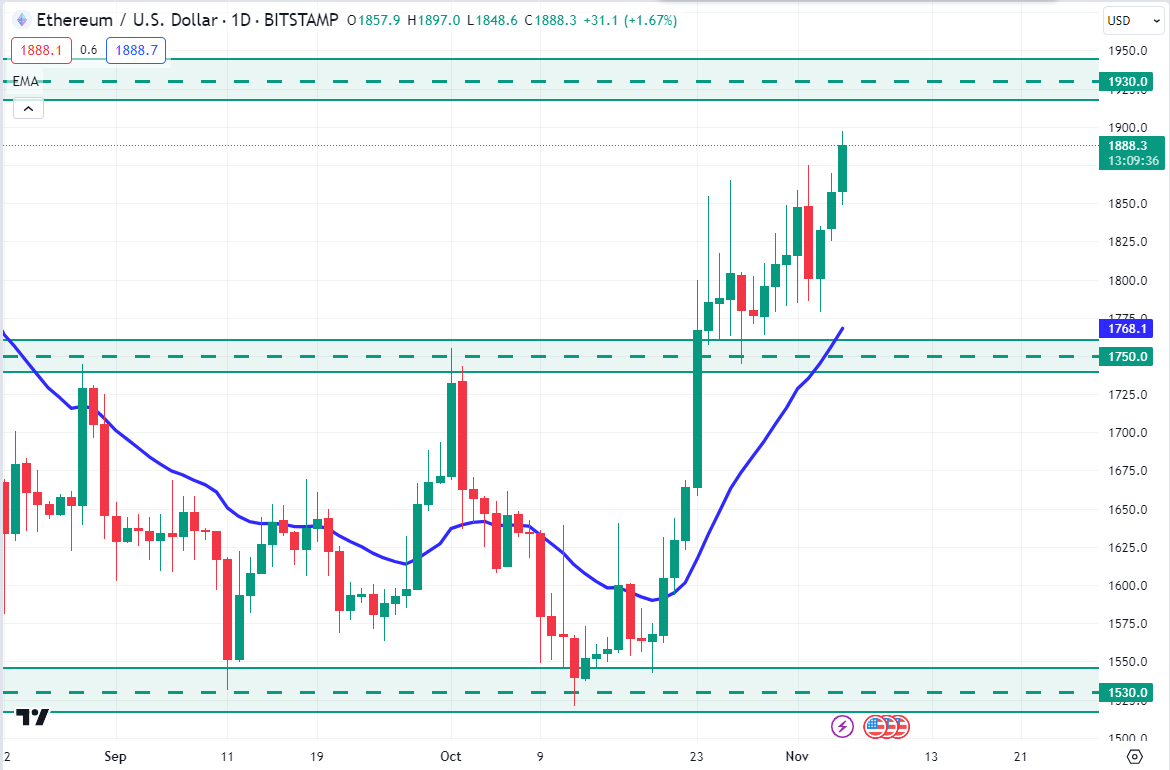
ETH price is currently residing around the $1886.2 price area after breaking above the $1750.0 resistance level. However, the price may surge further higher toward the $1930.0 price area in the days ahead.
Therefore, if the price continues further upward toward the $1930.0 resistance level and rejects with an impulsive daily bearish candle, ETH price may retrace down toward the $1750.0 support level in the coming days.
Tesla stock (TSLA)
Fundamental Perspective
In the week of November 6th to November 10th, 2023, Tesla (TSLA) is poised for a dynamic performance in the stock market. Recent data shows that TSLA stock has been navigating a period of robust growth, backed by strong demand for electric vehicles (EVs) and expansion into new markets. With Tesla's Gigafactories churning out vehicles at an accelerated pace and deliveries reaching record levels, the company's fundamentals remain impressive.
However, potential headwinds include ongoing global supply chain disruptions affecting the automotive industry, which could impact production and delivery timelines. Additionally, regulatory developments, particularly related to government incentives for EVs, may influence TSLA's performance.
Technical Perspective
Source: TradingView
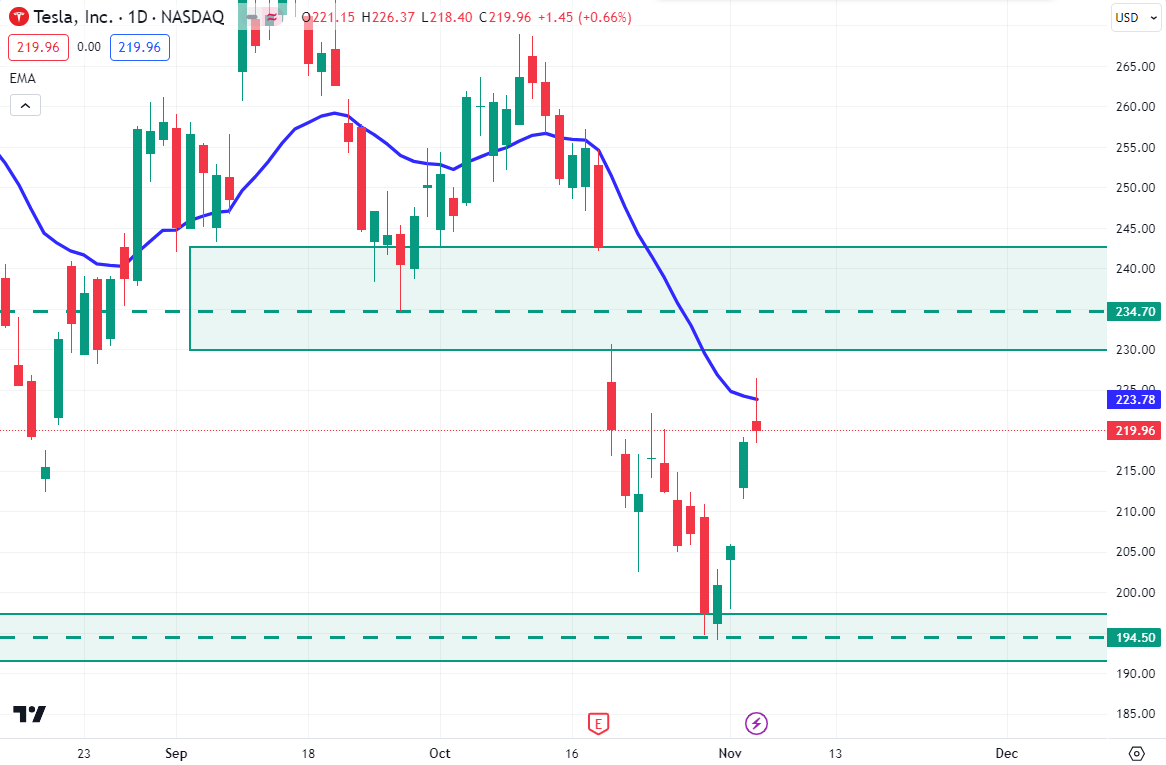
TSLA stock price faced resistance at the dynamic level of 20 EMA on the daily chart last week. However, the price may recover further to fill up the bearish gap. So, if the price recovers further upward toward the bearish gap area and forms a bearish candle close below the $234.70 level, bears may push the price down to the $194.50 support level.
GOLD (XAUUSD)
Fundamental Perspective
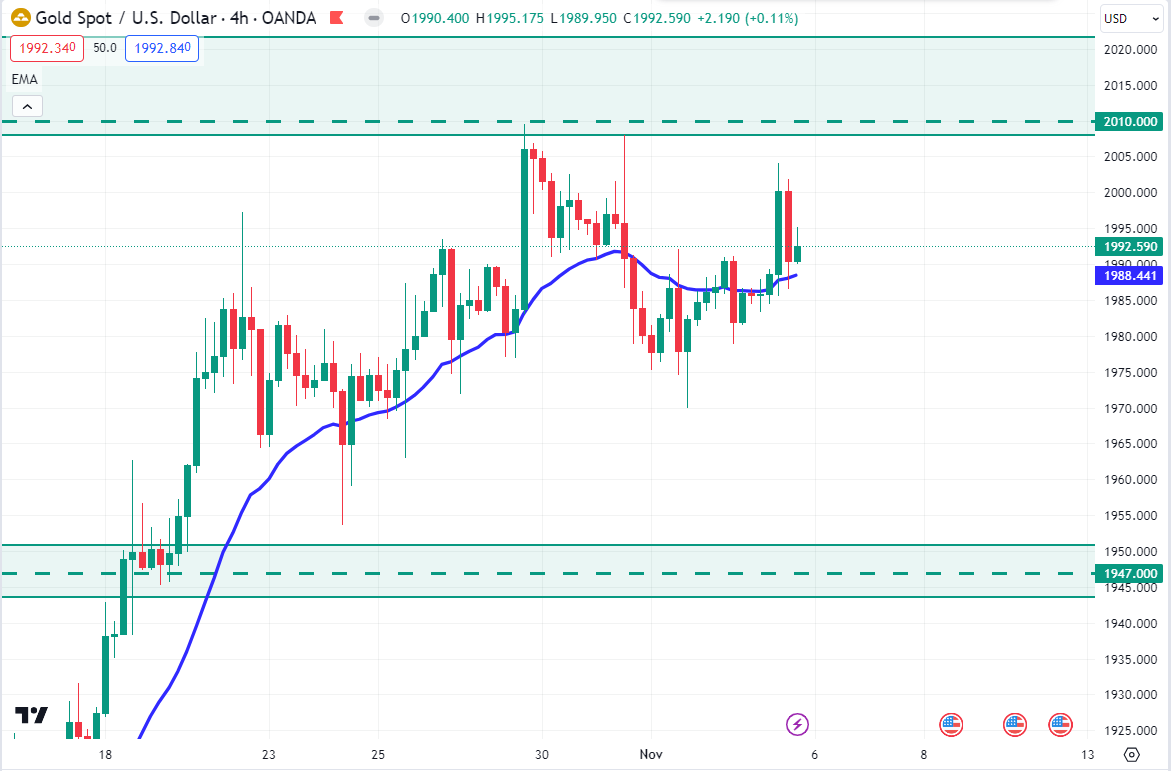
On Friday, the XAU/USD pair surged to an intraday high, nearly reaching $2,005, driven by the release of the weakest US Nonfarm Payrolls (NFP) data in nearly three years. However, Gold prices subsequently retraced to close the trading day around $1,992.50, settling in the middle of the day's trading range.
The US NFP report fell short of expectations, revealing that the United States added a mere 150 thousand jobs in October, a substantial drop from the previous month's robust figure of 297 thousand jobs, which was subsequently revised downward from the initial 336K print. Initial market projections had suggested an October figure of 180K, and this headline miss ignited a surge in global markets as investors cheered the anticipated end of Federal Reserve (Fed) rate hikes.
Despite the disappointing NFP report, Gold struggled to secure substantial gains as market sentiment remained cautious. Despite the moderation in US economic data, the Fed continues to closely monitor inflation and excessive wage growth as pivotal considerations. A single subpar NFP reading is unlikely to deter the Fed from its "higher-for-longer" stance on interest rates.
Technical Perspective
Source: TradingView
Gold price may recover higher toward the $2010.00 price area again as the dynamic level of 20 EMA still holds the price as strong support on the H4 chart. So, if the price surges further upward and has an impulsive H4 bearish candle close below the $2010.00 resistance level, it could be a short opportunity, targeting the $1947.00 price area.
Crude Oil (WTI)
Fundamental Perspective
West Texas Intermediate (WTI), the benchmark for US Crude Oil, rebounded by more than 1.80% on Thursday, putting an end to three consecutive days of losses and surpassing the $82.70 per barrel mark with a gain of 2.28%. Market sentiment reflects a growing belief that the US Federal Reserve (Fed) has concluded its tightening cycle, evident as Wall Street posts gains, US Treasury bond yields decrease for the second consecutive day, and the US Dollar weakens further, as demonstrated by the US Dollar Index (DXY) touching new two-day lows.
During the recent Fed announcement on Wednesday, where rates were maintained within the 5.25%-5.50% range, the central bank reiterated its commitment to combat high inflation. Despite this, investors responded positively to the decision made by Powell and his team, even though they remain susceptible to a potential hawkish shift by the Fed. This is because Powell indicated that elevated rates at the long end of the yield curve were contributing to the maintenance of restrictive monetary conditions.
Nevertheless, market expectations of additional rate hikes are keeping rates elevated. Alongside the weakening US Dollar, this heightened oil demand, as restrictive policies are perceived as a potential threat to overall demand.
Technical Perspective
Source: TradingView
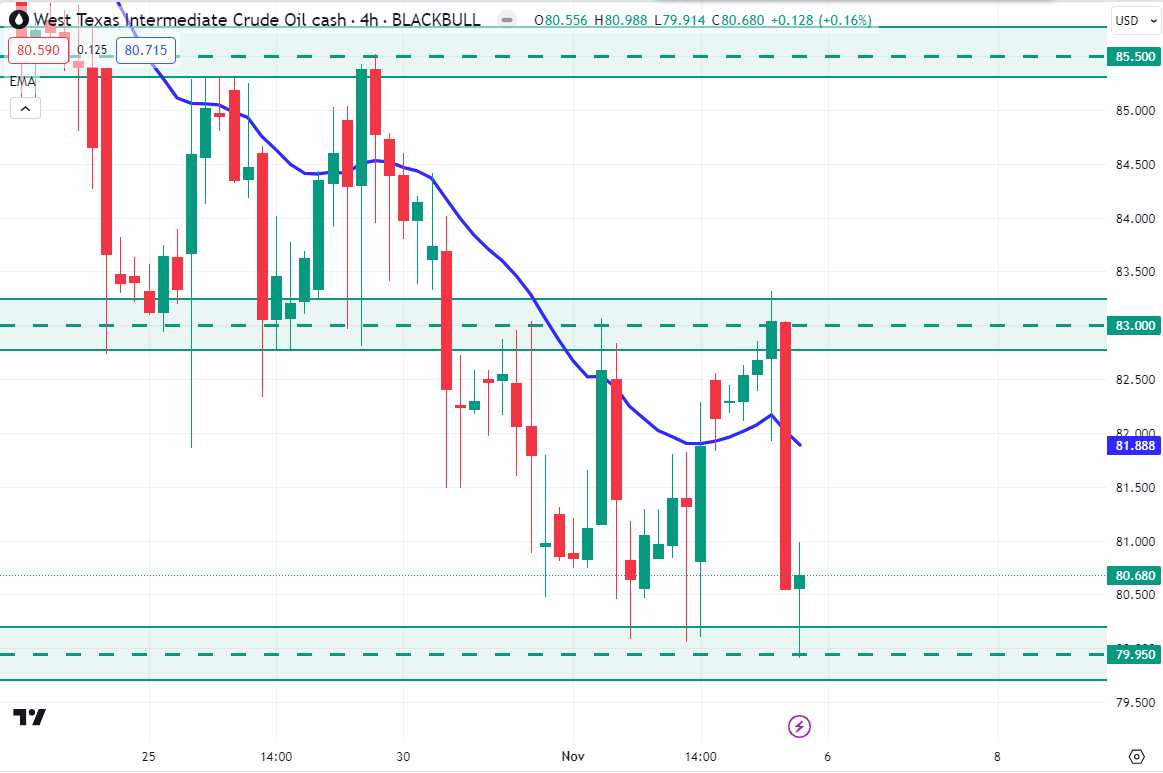
Oil price found support around the $79.95 price area after an impulsive bearish momentum. As per the current situation, the price may recover higher toward the $83.00 price area in the days ahead.
Therefore, if the price recovers higher toward the $83.00 resistance area and rejects with an impulsive h4 bearish candle, a short opportunity might come, targeting the $79.95 price area.


