


EURUSD
Fundamental Perspective
Towards the end of last week's trading sessions, the EUR/USD touched the 1.0900 level, concluding a week marked by an initial surge to the 1.0880 area. This upward movement was prompted by the week's opening bids, which were observed around 1.0680.
Notably, US inflation figures exhibited a noticeable softening over the course of the week, influencing market sentiment to favor the Euro (EUR) and consequently causing a broad decline in the US Dollar (USD). As a result, risk-on positions became more prevalent, contributing to the EUR's strength against the USD.
Amidst this market dynamics, the EUR/USD has remained positioned on the higher side, with traders momentarily shifting their focus away from ongoing concerns about the Federal Reserve's (Fed) potential interest rate hikes.
Technical Perspective
Source: TradingView
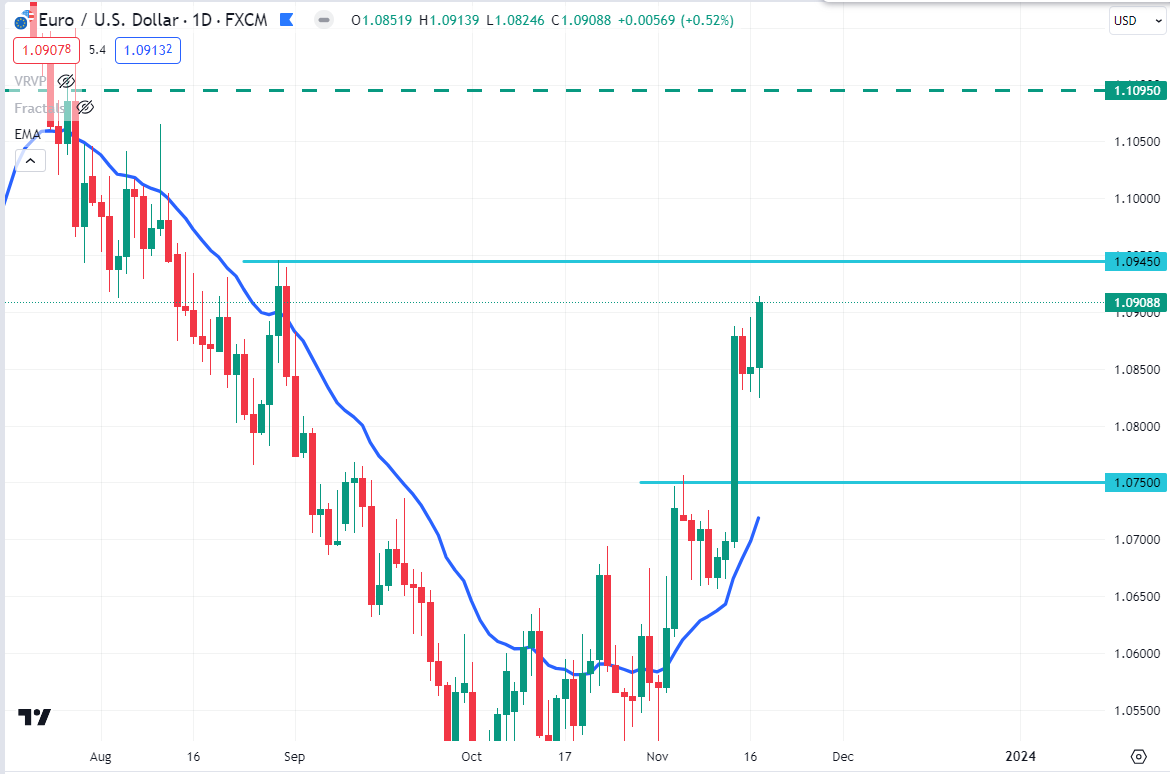
On the weekly timeframe, EURUSD broke above the dynamic level of 20 EMA and had a strong W1 bullish candle close. After bouncing from the 1.0500 weekly support level, bulls regained momentum and impulsively pushed the price upside.
On the daily chart, the momentum of EURUSD is also bullish. Therefore, if the price can have a daily bullish candle close above the 1.0945 price area, the price may recover further higher toward the 1.1095 event area in the coming days.
On the bearish side, if the price rejects the 1.0945 price area with an impulsive bearish candle close, the bears may push the price down the 1.0750 price area in the days ahead.
GBPJPY
Fundamental Perspective
The GBP/JPY pairing continues to experience downward pressure for the second consecutive day this Friday, distancing itself from the recent peak in the 188.25-188.30 range, which marked its highest level since November 2015. Presently, spot prices hover around the 186.85-186.80 zone, reflecting a marginal decline of just over 0.10% for the day. Traders are now directing their attention to the upcoming UK Retail Sales figures, anticipating fresh momentum.
Simultaneously, the release of subdued UK consumer inflation data on Wednesday has solidified market expectations of an imminent interest rate cut by the Bank of England (BoE). This development is identified as a pivotal factor contributing to the relatively subdued performance of the British Pound, thereby exerting pressure on the GBP/JPY cross.
Additionally, a more cautious risk sentiment in the market prompts a flow of safe-haven assets towards the Japanese Yen (JPY), further influencing the pair's slightly bearish tone.
Technical Perspective
Source: TradingView
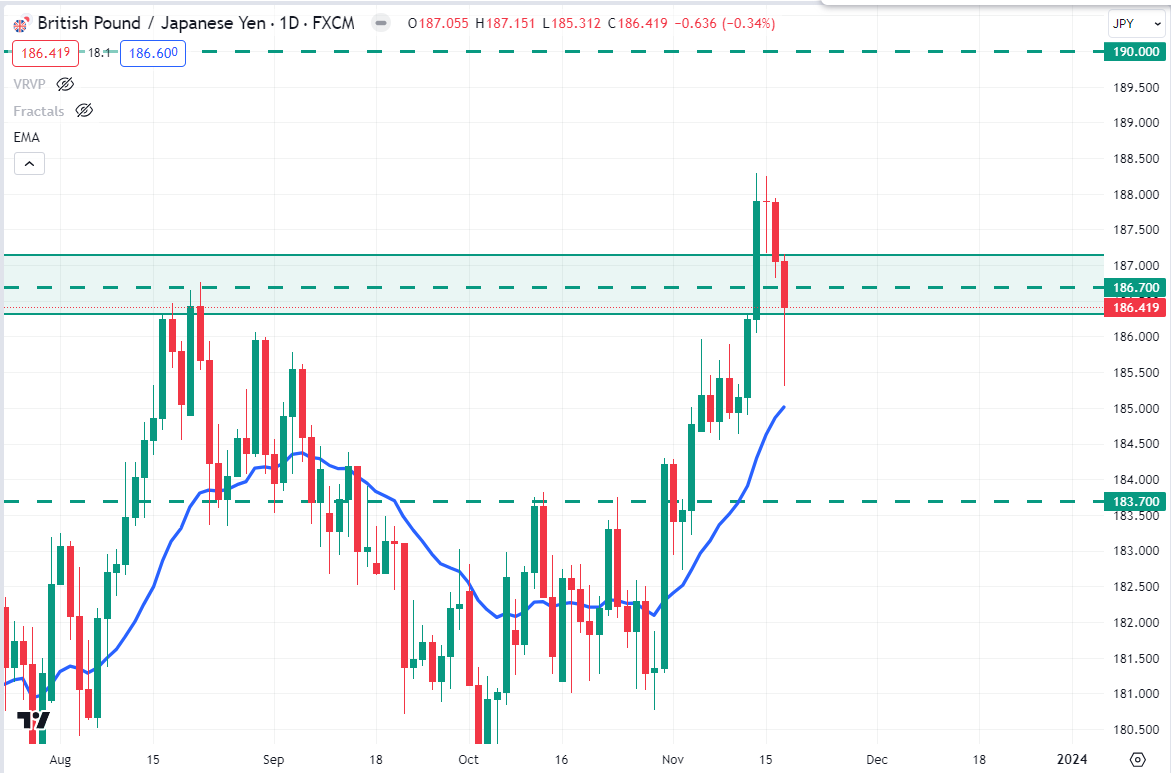
On the weekly chart, GBPJPY failed to break above the 186.70 key resistance level and had a weekly close below it. As the weekly candle appeared as a rejection candle, GBPJPY bears may regain momentum and retrace down a little bit before continuing further higher.
Furthermore, on the daily chart, the GBPJPY price still resides above the dynamic level of 20 EMA. So, if the price retraces down to the dynamic level of 20 EMA and has a daily bullish candle close above the 186.70 price area, bulls may sustain the bullish momentum toward the 190.00 price area in the days ahead.
On the bearish side, if the price can break below the dynamic level of 20 EMA with a daily bearish candle close, the bears may regain momentum and push the price down to the 183.700 price area.
NAS100
Fundamental Perspective
Expect a pivotal week for the NAS100 index (Nasdaq). The latest data highlights its resilience, buoyed by robust tech sector performance and positive earnings releases. Notably, the index demonstrates sensitivity to inflation concerns and Federal Reserve communications. As we approach the week of November 20th to 24th, 2023, traders should keenly watch for updates on economic indicators and Fed policy, as these factors will likely shape the NAS100's trajectory. Stay attuned to evolving market dynamics and corporate developments.
Technical Perspective
Source: TradingView
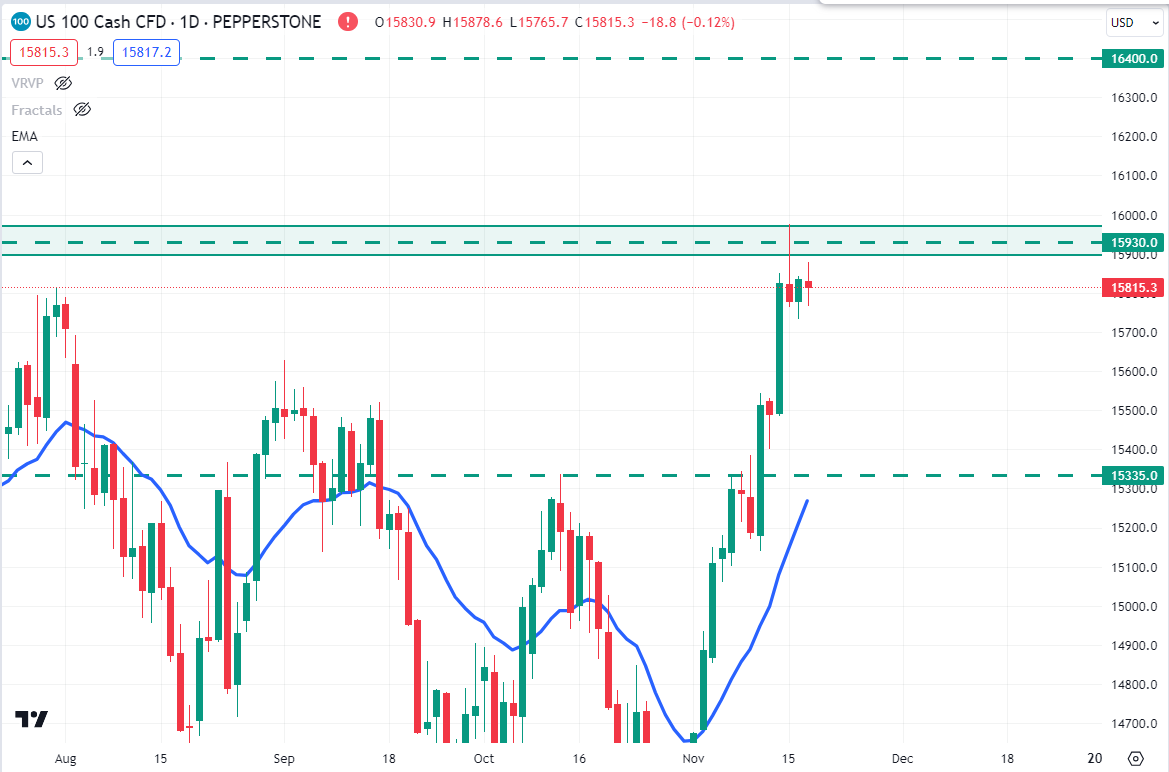
On the weekly chart, the NAS100 price was rejected from the $15930.0 psychological resistance level and had a weekly close below it. However, the bias is still bullish on the weekly chart.
Moreover, on the daily chart, NAS100 had a bearish pin bar candle close after rejecting the $15930.0 resistance area on Wednesday, but bears failed to break below the pin bar low. As per the current situation, if the price can have a daily bullish candle close above the $15930.0 price area, the bulls may continue further higher toward the $16400.0 price area in the coming days.
On the bearish side, if the price breaks below the bearish pin bar low with a daily bearish candle, the price may retrace the downside toward the $15335.0 support area in the days ahead.
S&P500 (SPX500)
Fundamental Perspective
The S&P 500 gained more than 9% in three weeks, where the recent CPI release ensured that the Fed is likely to pause the rate hike.
On the other hand, S&P 500 stocks showed three consecutive earnings declines, while analysts provided a positive development in 2025. Among this week's releases, PayPal and Etsy would be in focus, as both stocks are trading below the $100 level.
Investors should focus on FOMC meeting minutes this week, besides PMI readings.
Technical Perspective
Source: TradingView
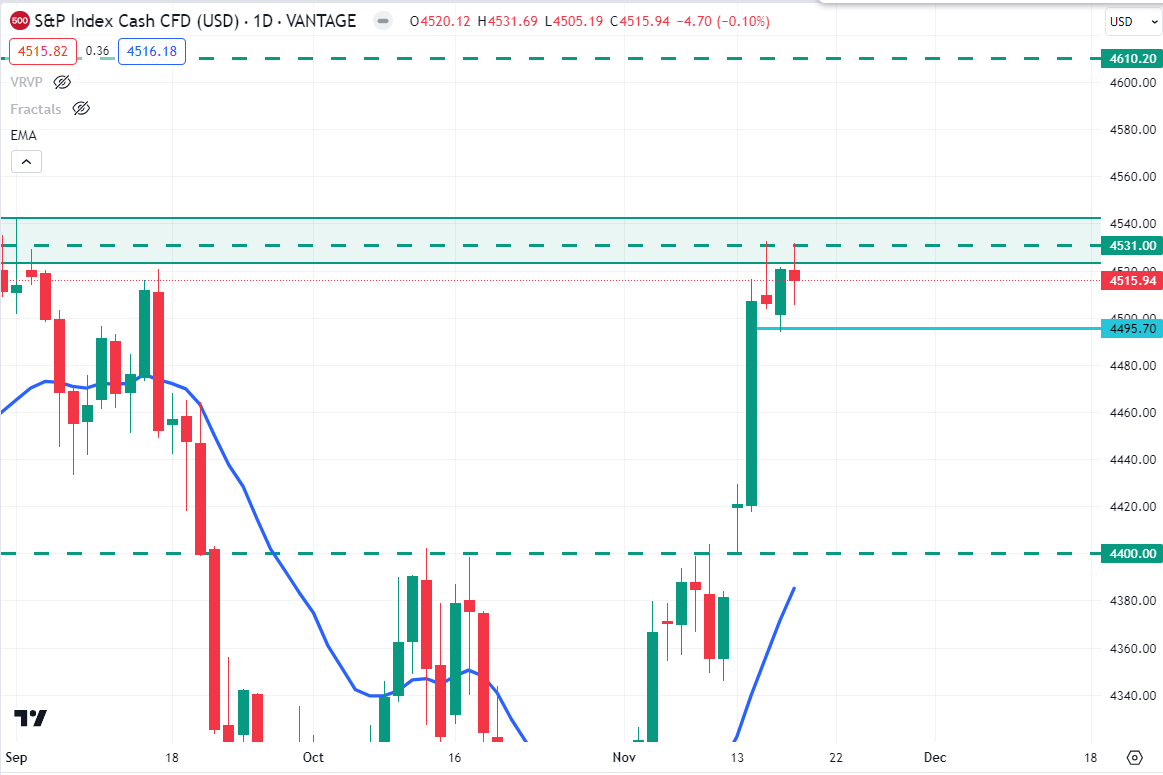
S&P500 price faced strong resistance around the $4531.00 price area and had a weekly close below it. However, the price remains above the dynamic level of 20 EMA.
On the daily chart, if the SP500 price can break above the $4531.00 resistance level with a daily bullish candle close, the bulls may sustain the bullish momentum toward the $4610.20 key resistance area in the coming days.
On the bearish side, if the price can break below $4495.70, which is the daily bullish candle's low, the bears may regain momentum and push the price down to the $4400.00 support area.
HK50
Fundamental Perspective
Anticipate a dynamic week for the HK50 index (Hang Seng). Recent data reveals heightened volatility due to global economic shifts and trade tensions. As of the latest update, the HK50 displays a resilient bullish trend, influenced by positive earnings reports from key constituents. Market sentiment is responsive to geopolitical developments, particularly US-China relations.
Traders should closely monitor economic indicators and policy statements, with potential impacts on sectors like technology and finance. The HK50's resilience amid external pressures underscores its significance as a barometer for regional economic health. Stay informed of strategic opportunities in this coming week.
Technical Perspective
Source: TradingView
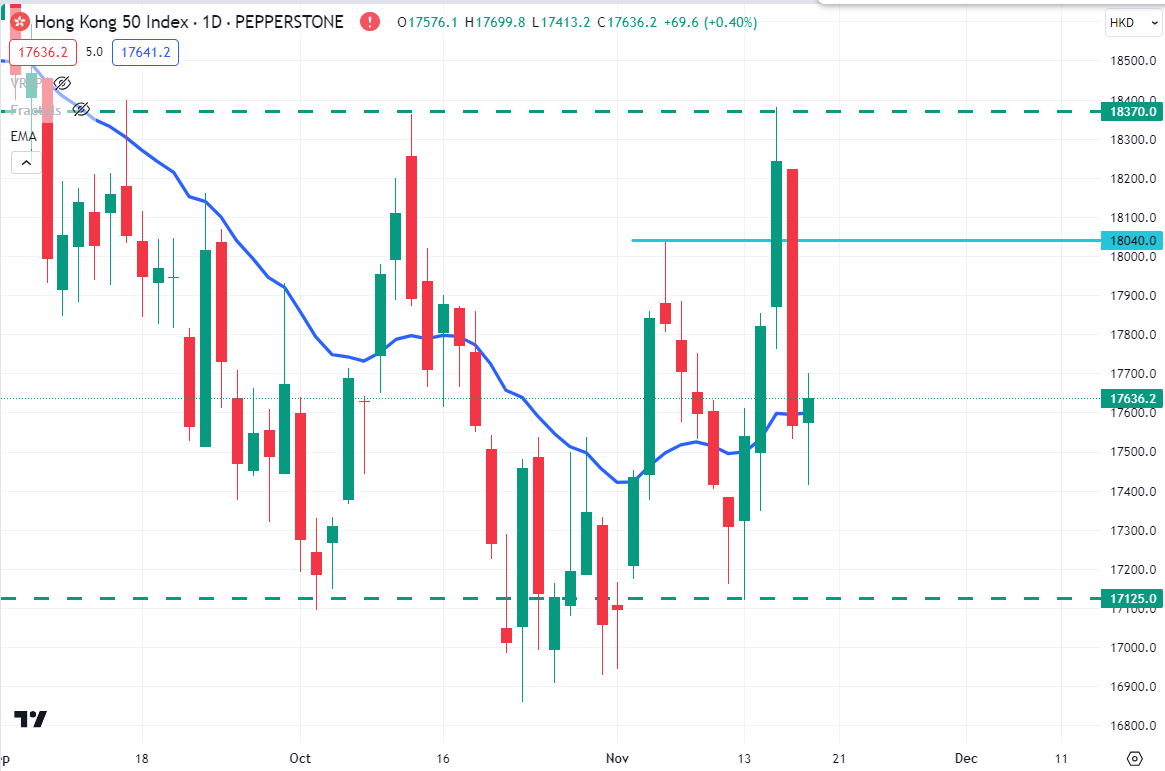
On the weekly timeframe, the price was rejected from the dynamic level of 20 EMA as the momentum is still bearish.
As per the current price action on the daily chart, HK50 had a daily bullish candle close above the dynamic level of 20 EMA on Friday, which indicates the bulls may push the price higher toward the $18040.0 price area.
On the bearish side, if the price retraces toward the $18040.0 price area and has a daily bearish candle close below it, the bears may push the price down to the $17125.0 price area in the days ahead.
Bitcoin (BTCUSD)
Fundamental Perspective
After the US Securities and Exchange Commission (SEC) announced a delay in deciding on an ETF for Bitcoin (BTC), the price of BTC saw a sudden increase, which seemed a bit surprising. Currently, BTC is just below the $38,000 mark, and investors are uncertain about its next move. Analysts believe that there's a high likelihood of approval for a spot ETF by January 10, 2024.
If this happens, it could be very positive for the entire cryptocurrency ecosystem. Due to the anticipation of this approval, there has been a significant increase in capital inflow, leading to increased market volatility.
Traders should exercise caution because Bitcoin prices could swing dramatically in either direction until the ETF decision is finalized. In a matter of minutes, BTC might break the critical support level at $35,000 and retest the support range between $31,000 and $30,000. If such a scenario unfolds, it could trigger widespread panic and result in millions of US Dollars worth of liquidations.
Technical Perspective
Source: TradingView
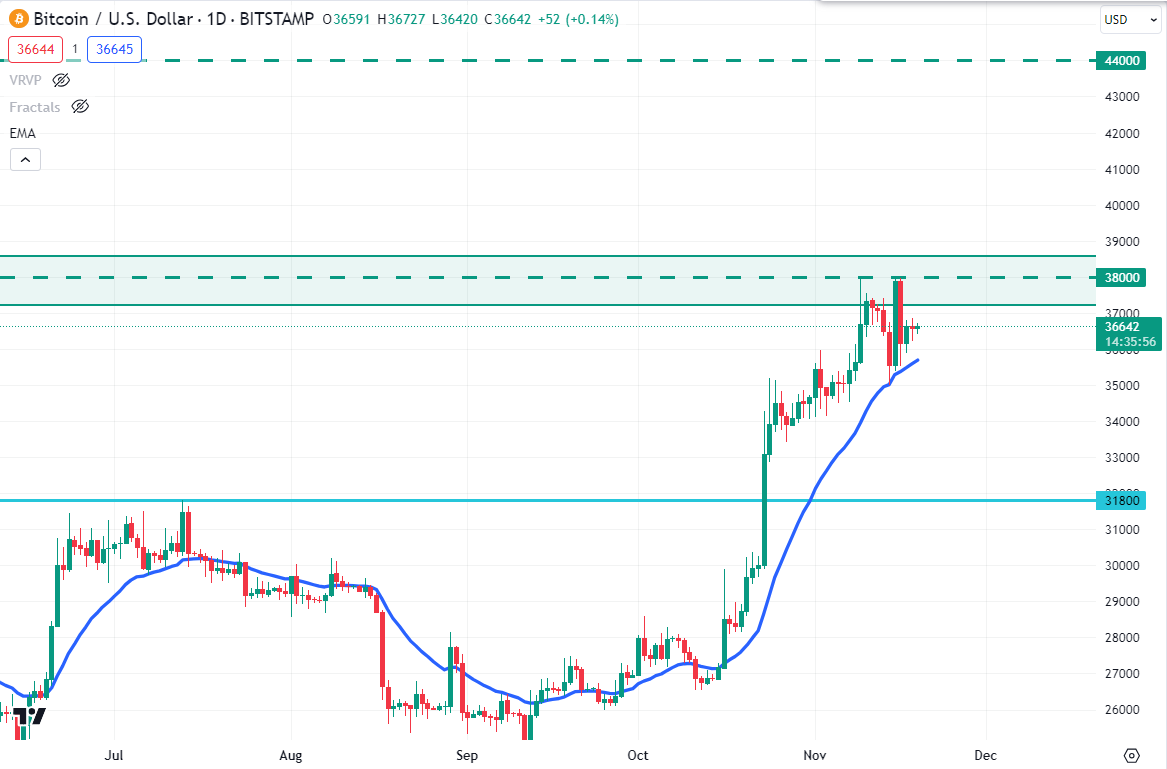
On the weekly timeframe, the BTC price was rejected from the $38000 psychological price area and had a weekly bearish candle close below it. However, the momentum is still bullish on the weekly chart.
On the daily chart, the dynamic level of 20 EMA is still carrying the price as strong support. Therefore, if the price had a daily bullish candle close above the $38000 price area, the bulls may sustain the bullish pressure further toward the $44000 price area in the days ahead.
On the bearish side, if the price can break below the dynamic level of 20 EMA with a daily bearish candle, the bears may regain momentum and push the price down to the $31800 price level.
Ethereum (ETHUSD)
Fundamental Perspective
The price of Ethereum (ETH) is currently testing a crucial support level at $1,935. If it fails to hold, ETH may decline to $1,864, about 5% lower. In a more severe scenario, a further drop towards the psychological level of $1,800 is possible, finding support around $1,753.
Conversely, if the $1,935 level holds, along with the order block between $1,864 and $2,004, ETH could move upward, crossing the ascending trendline at $2,029. In a highly optimistic scenario, gains might reach the high of $2,136, reflecting a 10% increase from current levels.
Technical Perspective
Source: TradingView
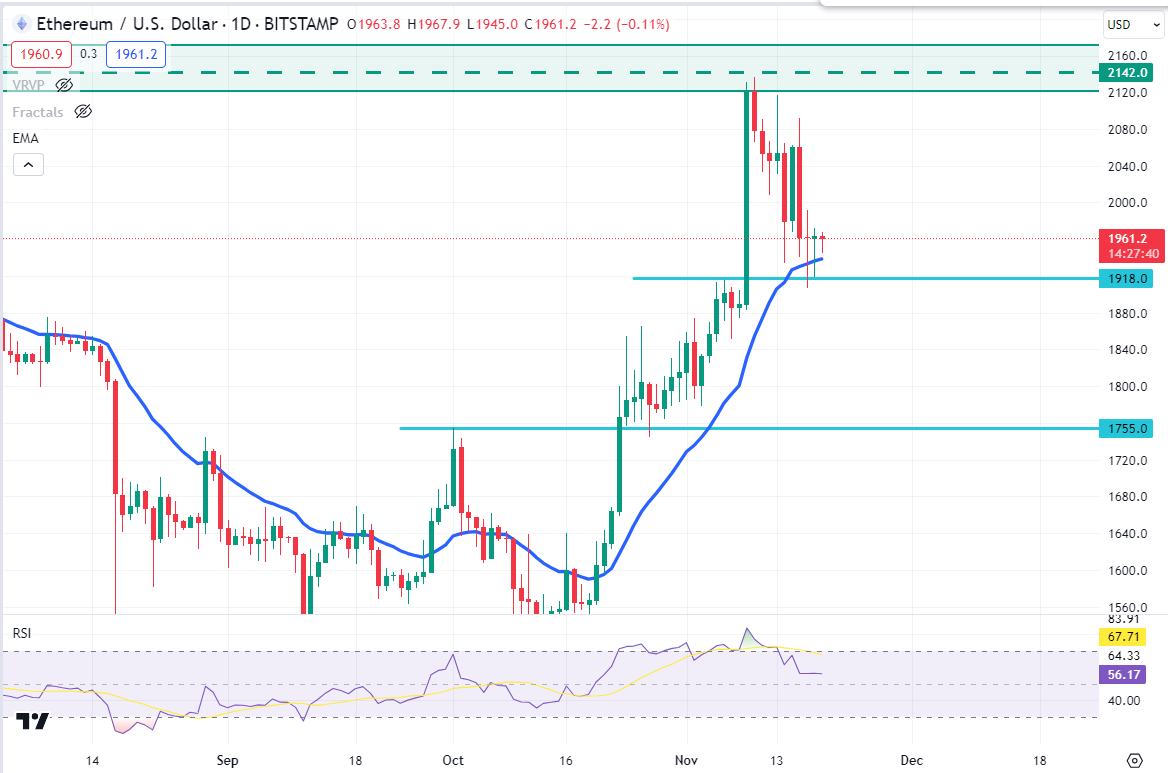
ETH bulls faced strong resistance around the $2142.0 psychological area and had a weekly bearish candle close below it. However, the price remains over the dynamic level of 20 EMA.
On the daily timeframe, the dynamic level of 20 EMA still holds the price as strong support. So, if the price can have a daily bullish candle close above the 20 EMA, the bulls may recover higher toward the $2142.0 price area again in the coming days.
On the bearish side, the RSI indicator's line currently resides above the line 50.00 and sloping downside, indicating the bears may recover further down to the $1755.0 price area.
Tesla Stock (TSLA)
Fundamental Perspective
In the approaching week of November 20th to 24th, 2023, Tesla (TSLA) faces a pivotal period. Recent data underscores TSLA's ongoing prominence in the electric vehicle sector, supported by rising demand and production milestones. Key factors influencing TSLA's trajectory include updates on battery technology advancements, global supply chain dynamics, and regulatory developments. Investors should closely monitor market sentiment, as TSLA remains sensitive to macroeconomic shifts.
Additionally, any announcements regarding expansion plans or partnerships can significantly impact the stock's performance. Stay informed for strategic insights into TSLA's movement during this dynamic week.
Technical Perspective
Source: TradingView
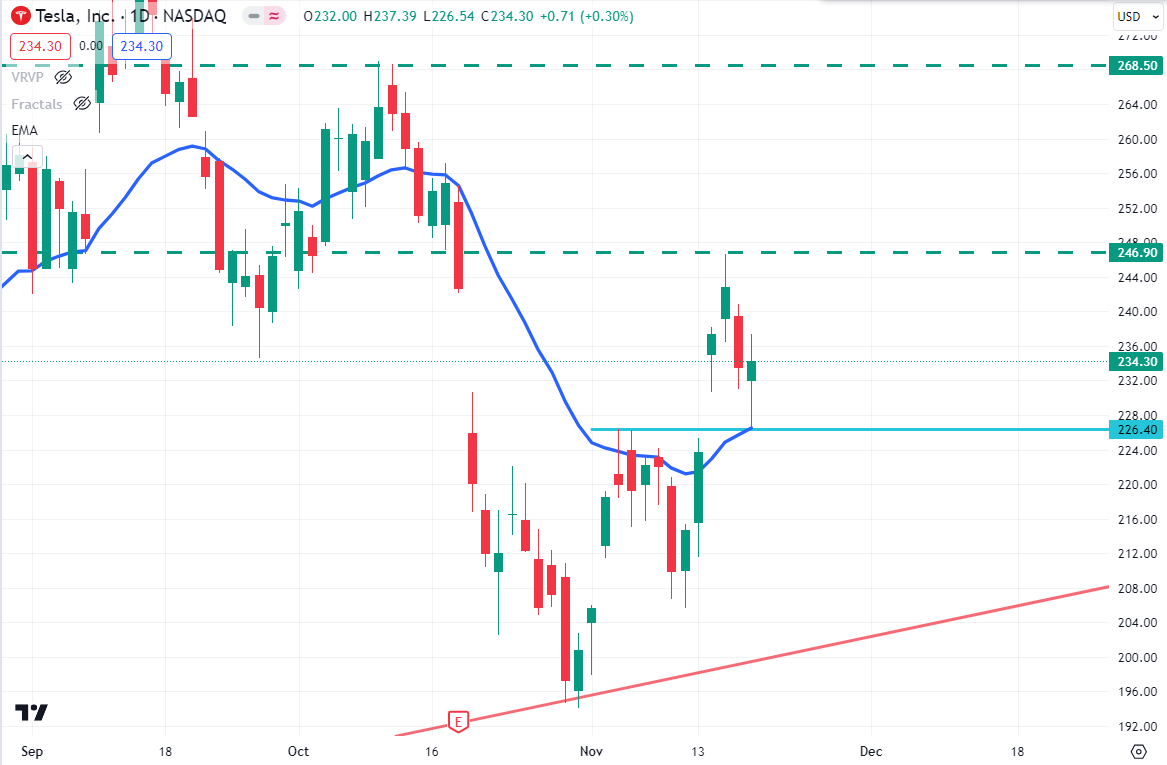
On the weekly chart, TSLA price was rejected from the $246.90 event area and had a weekly close below it. However, the bullish trend line still holds the price as strong support.
On the daily chart, if the TSLA stock price can break above the $246.90 price area with a daily bullish candle close, the bulls may sustain the bullish pressure toward the $268.50 price area in the days ahead.
On the bearish side, if the price can break below the $226.40 support level with a daily bearish candle close, the bears may push the price down to the weekly bullish trend line support.
GOLD (XAUUSD)
Fundamental Perspective
Gold shifted direction, recovering from the losses of the previous week. Based on technical analysis, it seems that XAU/USD might reach $2,000 in the near future.
Expect some market turbulence in the latter part of the upcoming week. Gold gained over 2.5% last week, benefitting from a decline in the US Dollar (USD) and US Treasury bond yields. Looking ahead, the economic calendar for this week doesn't include major macroeconomic events, so traders may focus on the technical aspects of XAU/USD for potential trading opportunities.
Technical Perspective
Source: TradingView
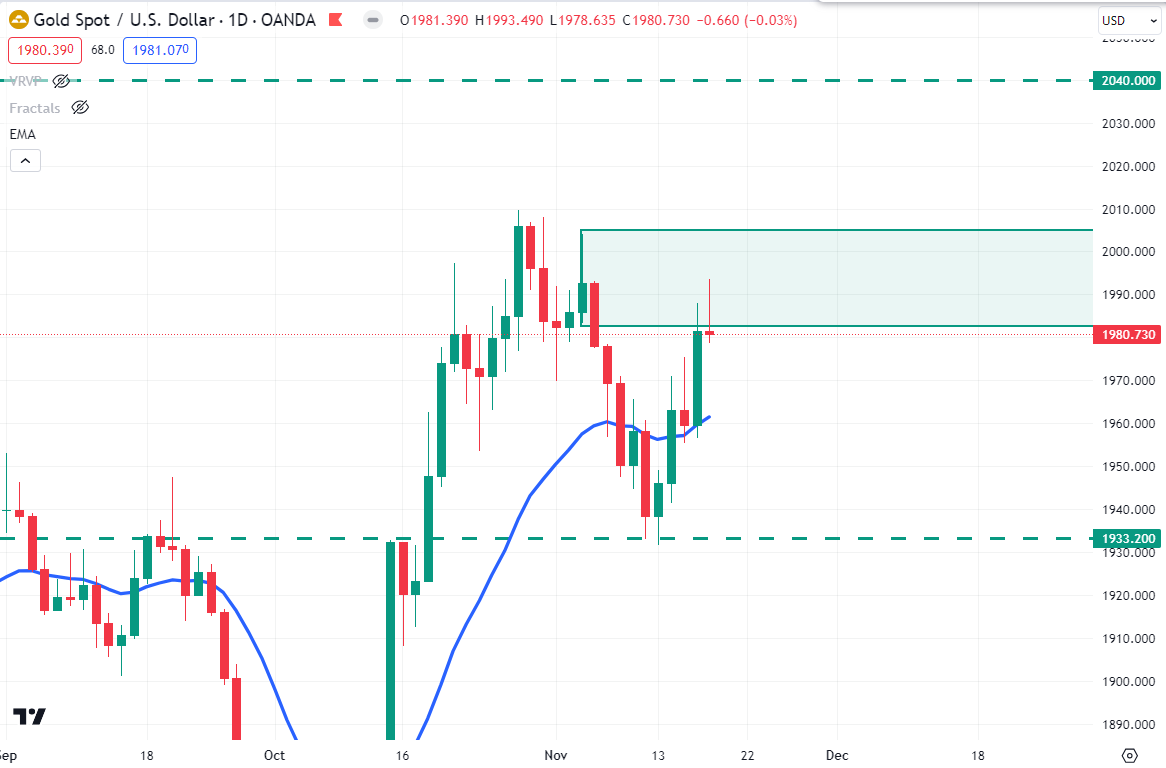
On the weekly timeframe, Gold price moved higher with the support of a dynamic level of 20 EMA and had a strong bullish candle close.
On the daily chart, the price was rejected from the daily order block area but the momentum is still bullish. So, if the price can surge over the order block area with a daily bullish candle close, the bulls may sustain the bullish bias toward the $2040.00 key resistance area in the days ahead.
On the bearish side, if the price breaks below the bearish pin bar low with a daily bearish candle, the bears may push the price down to the $1933.20 support level again in the coming days.
Crude Oil (WTI)
Fundamental Perspective
On early Friday, WTI oil stayed within a tight consolidation after a 5.3% drop the day before, marking its most significant one-day decline since October 4. It's facing more pressure due to worries about lower demand and ample supply.
The short-term price movement is following a downward path, set for the fourth week in a row with losses. This trend started when concerns about disruptions in Middle East output eased. Meanwhile, demand is lower, and supply is exceeding expectations, leading to a notable increase in US crude inventories.
Technical Perspective
On the weekly timeframe, Oil price pushed lower and had another weekly bearish candle close below the dynamic level of 20 EMA. However, the price bounced from the $72.520 support level last week, which indicates an upcoming bullish retracement.
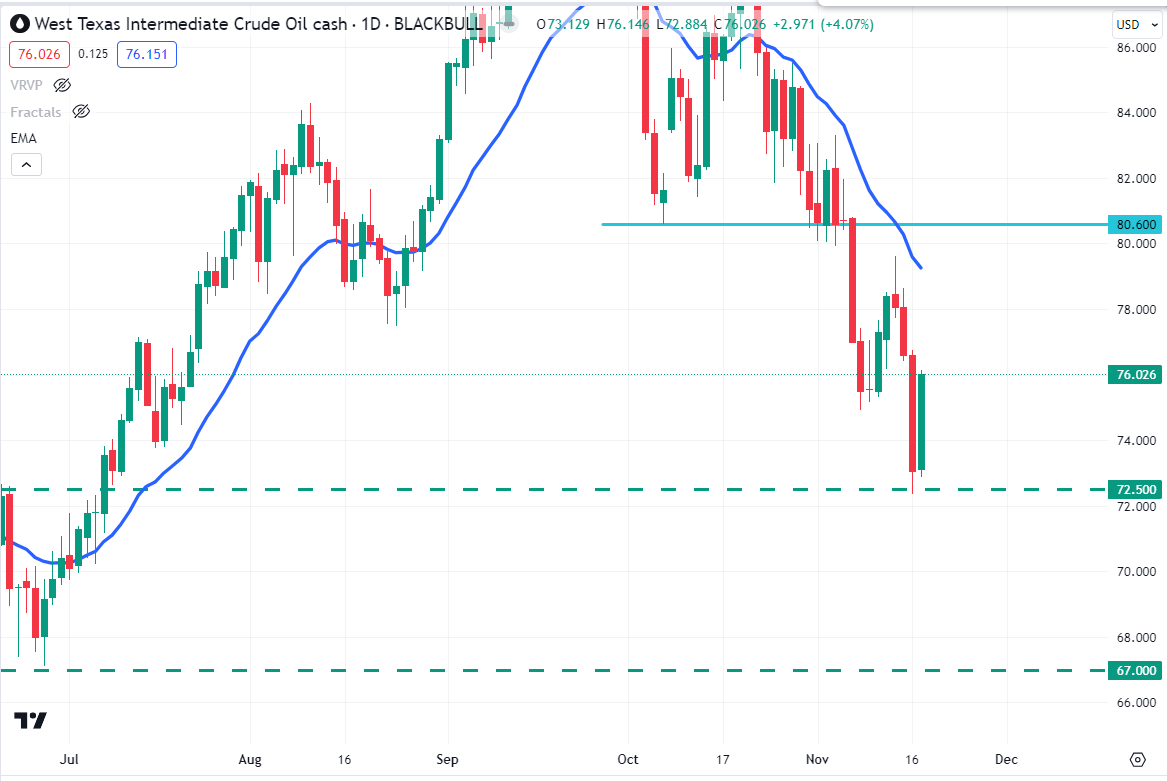
Source: TradingView
On the daily chart, after bouncing from the $72.50 support level, the price had an impulsive bullish candle close. Therefore, there is a high chance that the price may recover further toward the $80.60 price area in the coming days.
On the bearish side, if the price can break below the $72.50 support level with a daily bearish candle, the bears may regain momentum and push the price down to the $67.00 price area in the days ahead.


