


EURUSD
Fundamental Perspective
The EUR/USD currency pair exhibited a notable upward movement, surging by 117 pips from its Friday low of 1.0482 to breach the significant 1.0600 level. This uptick in the exchange rate was catalyzed by the release of the US Non-Farm Payrolls (NFP) report on Friday, which prompted a significant shift in investor sentiment away from the US Dollar and toward higher-risk assets, effectively concluding the trading week. Presently, the EUR/USD pair is consolidating around the 1.0580 mark, as market participants gauge the prevailing sentiment at the close of the trading session.
Furthermore, the Euro (EUR) has managed to regain positive ground for the trading week, albeit marginally, following its dip to a weekly low of approximately 1.0448. The upbeat performance of the Euro can be attributed to the robust employment data from the United States, which revealed the addition of 336,000 jobs in the previous month. This figure significantly surpassed the consensus forecast of 170,000 and represented an improvement over the prior report of 176,000 (which was subsequently revised upward to 227,000).
Technical Perspective
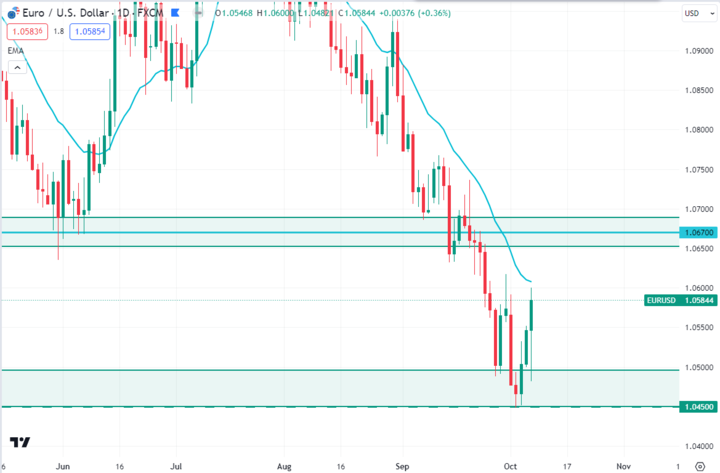
Source: TradingView.com
EURUSD is hovering at the 1.0585 price area and aimed upside with a corrective pressure. After an impulsive downside pressure, the price faced strong support around the 1.0450 price area and pushed higher last week.
As per the current price action, EURUSD price may retrace higher towards the 1.0670 resistance area. However, a retracement towards the 1.0670 price area and and impulsive daily bearish candle close could regain the bearish momentum and push the price down toward the 1.0450 support level.
GBPJPY
Fundamental Perspective
The GBP/JPY currency pair has advanced to reach the weekly peak, approximately at the 182.80 level, propelled by a robust resurgence in investor market sentiment. It has exhibited a remarkable ascent of 1%, originating from its daily low, just slightly above 181.00, and is currently undergoing a test at 182.75 after achieving a noteworthy gain of 180 pips.
In the week beginning October 9, 2023, GBPJPY is poised for dynamic movements. The GBP could strengthen as the Bank of England considers interest rate hikes, while the Bank of Japan maintains its accommodative approach. Key UK economic data, including GDP and employment figures, will be closely watched, impacting the GBP's performance. Brexit-related developments may introduce volatility. The JPY, traditionally a safe-haven currency, could fluctuate based on global risk sentiment linked to geopolitical events. Traders should also monitor central bank communications for policy insights. Overall, the currency pair is likely to experience shifts in response to monetary policy divergence, economic data, and broader market sentiment.
Technical Perspective
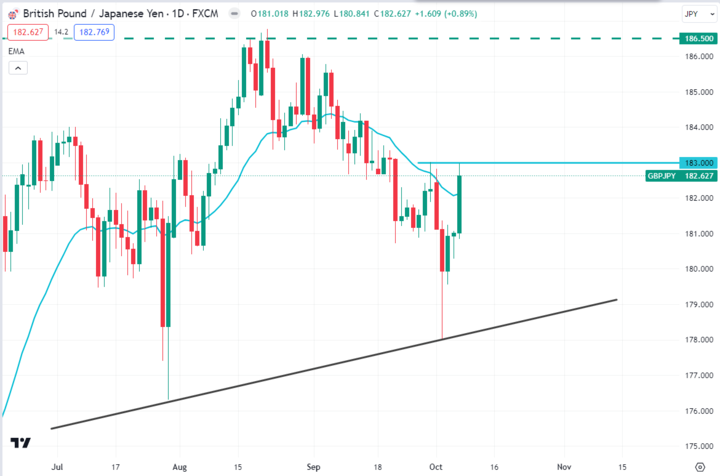
Source: TradingView.com
GBPJPY is currently residing near the psychological resistance area 183.00. After bouncing from a bullish trend line, the bulls pushed the price higher and hit the 183.00 price area last week. As per the current scenario, if the price rejects the 183.00 psychological resistance area with a daily bearish candle this upcoming week, the bears may push the price down toward the trend line again in the coming days. On the contrary, if the price breaks above the 183.00 price area with a strong daily bullish candle, the bulls may sustain the bullish momentum toward the 186.50 key resistance level in the days ahead.
NAS100
Fundamental Perspective
The NAS100 index is poised for an interesting week ahead, spanning from October 9th to October 13th, 2023. Recent market data indicates a cautiously optimistic outlook. Strong corporate earnings reports from tech giants like Apple and Amazon have injected momentum into the index, driving it to new highs. However, geopolitical tensions and inflation concerns remain lurking threats. Traders are closely monitoring the Federal Reserve's stance on interest rates, which could significantly impact market sentiment. Additionally, any developments in global trade relations and the energy sector will play a pivotal role in shaping NAS100's performance. As we move into the upcoming week, market participants should remain vigilant, adapting to evolving news and data to make informed decisions in this dynamic landscape.
Technical Perspective

Source: TradingView.com
NAS100 is currently residing at around the $14997.1 price area and trying to continue further higher. After an impulsive bearish momentum, the price found support around the $14560.0 price area. As per the current price action context, the price may retrace higher towards the $15151.0 price area. So, if the price retraces higher towards the $15151.0 price area and rejects with an impulsive bearish candle close, the bears may push the price down toward the $14560.0 price area again in the coming days.
SP500 (SPX500)
Fundamental Perspective
As we look ahead to the week of October 9th to October 13th, 2023, the fundamental forecast for the S&P 500 index reveals a mix of factors influencing market sentiment. Recent data highlights robust corporate earnings, particularly in the technology sector, bolstering investor confidence. However, inflation concerns and potential interest rate adjustments by the Federal Reserve continue to cast a shadow of uncertainty. Geopolitical developments and energy market dynamics will also impact the S&P 500's performance. Traders should remain vigilant and adapt their strategies as news unfolds, with a keen eye on economic indicators, earnings reports, and global events that can sway market direction during this upcoming week.
Technical Perspective

Source: TradingView.com
SP500 had a daily bullish candle close after bouncing from the $4204.50 support level last week. After breaking below the $4336.85 support level, the bears pushed the price down quite impulsively and hit the $4204.50 demand zone. As per the current price action context, the price may retrace upward toward the $4336.85 price area. Then if we find any daily bearish candle close from the $4336.85 resistance area, we will look for a sell and our target will be the $4204.50 support level again.
HK50
Fundamental Perspective
The forecast for the HK50 index reflects a nuanced picture. Recent data indicates resilience in the Hong Kong market, with economic recovery in full swing, led by robust trade activity and tech sector performance. However, concerns about regulatory shifts in the Chinese mainland, coupled with global trade tensions, remain pivotal factors affecting the HK50's trajectory. Additionally, market participants will closely monitor any developments in the property market and their impact on the broader economy. Traders are advised to maintain a cautious yet adaptive approach, keeping a watchful eye on both local and global events that may shape the HK50 index's movement during the upcoming week.
Technical Perspective

Source: TradingView.com
HK50 is currently trading around $17688.8 price area and trying to push higher. After breaking below the $18250.0 psychological support level last month, bears struggle a lot to reach the $17100.0 price area. As per the current price action, the price may retrace towards the $18250.0 price area before continuing further downside in the days ahead. Moreover, the MACD indicator also shows bullish divergence, which indicates further upward movement may take place next week.
Bitcoin (BTC)
Fundamental Perspective
The price of Bitcoin (BTC) is currently displaying a notable sense of optimism as the weekend approaches, and this sentiment is mirrored in the movements of Ethereum (ETH) and Ripple (XRP). These indications suggest a resurgence of bullish sentiment as market volatility reawakens. However, it is imperative for participants to exercise prudence and be vigilant to prevent falling into a potential bull trap.
Technical Perspective
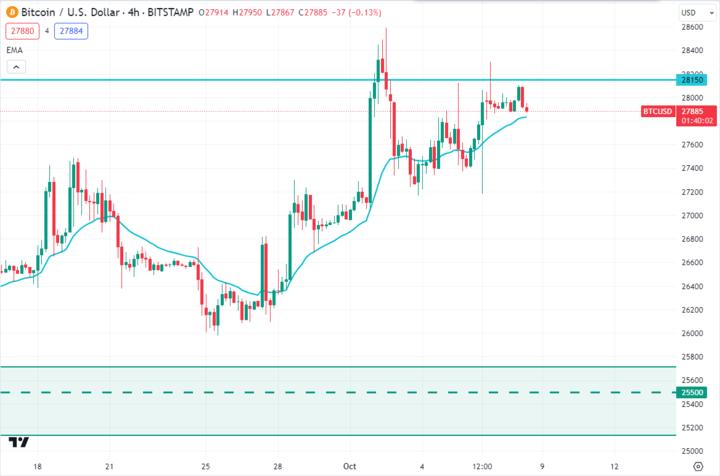
Source: TradingView.com
BTC is currently trading at around $27900 price area and trying to push the downside. After bouncing from the $25500 support level, the bulls regained momentum and pushed the price upside quite impulsively. As per current price action, the price is facing resistance around the $28150 price area. So, if the price can have an impulsive H4 bearish candle close below the dynamic level of 20 EMA, the bears may regain momentum and push the price down toward the $25500 price area in the days ahead.
Ethereum (ETH)
Fundamental Perspective
Ethereum (ETH) presents a compelling landscape. Recent data indicates that Ethereum has been benefiting from increased adoption in decentralized finance (DeFi) applications, non-fungible tokens (NFTs), and smart contract platforms. This momentum has been further fueled by the highly anticipated Ethereum 2.0 upgrade, which promises scalability and reduced energy consumption.
Nevertheless, Ethereum faces challenges related to scalability issues and potential regulatory developments. Traders should stay attuned to technical upgrades, network congestion, and any regulatory news. The interplay between technological advancements and regulatory dynamics will be pivotal in shaping ETH's performance during the upcoming week, making it essential for investors to maintain a vigilant and informed approach in this dynamic cryptocurrency landscape.
Technical Perspective
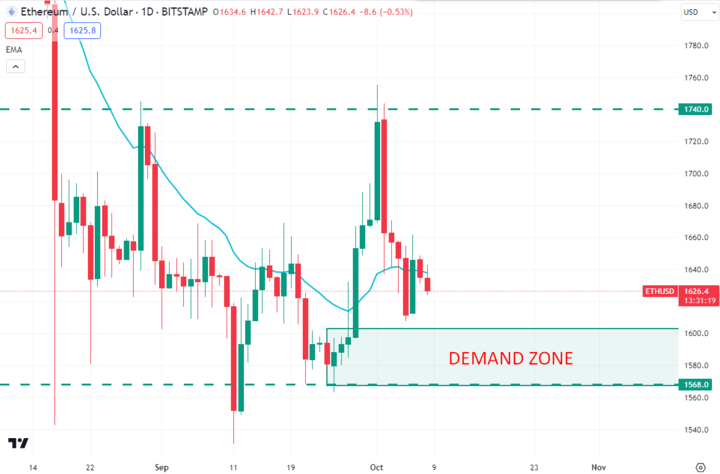
Source: TradingView.com
ETH price was rejected from the $1740.0 psychological event level and is currently trading around the $1625.3 price area. After bouncing from the $1568.0 price area, the bulls regained momentum and pushed the price higher, but failed to sustain the bullish momentum above the $1740.0 resistance level. As per the current price action, the price may retrace down towards the demand zone. So, if the price retraces down to the demand zone and has a strong daily bullish candle close above it, the bulls may push the price toward the $1740.0 price area again in the days ahead.
Tesla (TSLA)
Fundamental Perspective
Anticipating the week of October 9th to October 13th, 2023, Tesla (TSLA) faces an intriguing fundamental forecast. Recent data showcases strong electric vehicle demand, reaffirming Tesla's market leadership. However, supply chain challenges and battery shortages persist as potential obstacles. Additionally, regulatory developments surrounding autonomous driving and emissions standards could impact Tesla's trajectory.
Investors should closely monitor production updates, delivery figures, and any regulatory shifts. Tesla's foray into energy solutions and new vehicle models will also be influential. Striking a balance between innovation and regulatory compliance will be essential for Tesla's performance during this upcoming week, prompting investors to remain astute and well-informed in this evolving landscape.
Technical Perspective
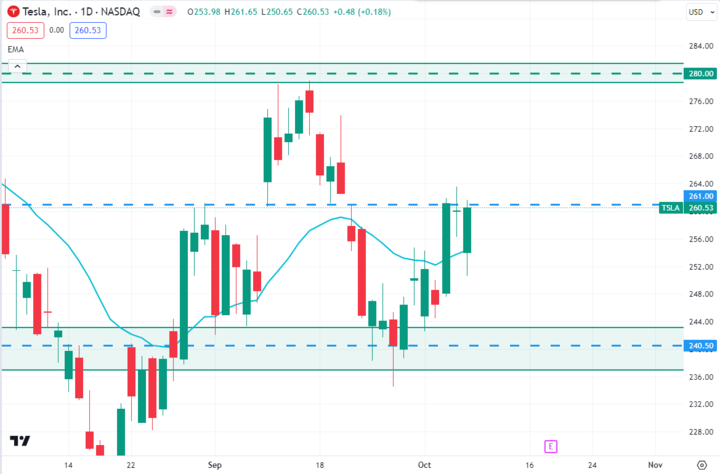
Source: TradingView.com
TSLA is currently trading around the $260.50 price area and trying to push higher. After a strong daily bullish candle close above the $240.50 support level, the bulls pushed the price upward quite strongly and hit September’s high. As per the current scenario, if the price can have an impulsive daily bullish candle close above the $261.00 price area, the bulls may sustain the bullish momentum toward the $280.00 price level in the coming days. On the other hand, if the price rejects the $261.00 price area with a strong daily bearish candle close, the bears may regain momentum and push the price down toward the $240.50 price area in the days ahead.
GOLD (XAUUSD)
Fundamental Perspective
The latest data release indicates that non-farm payrolls (NFP) in the United States exceeded expectations for the previous month. According to statistics provided by the Labor Department, payrolls increased by a substantial 336,000 in September, surpassing the anticipated figure of 170,000 and significantly outperforming the upwardly revised count of 227,000 from the previous month.
Additionally, the nation's unemployment rate came in higher than the initial projections, registering at 3.8%. This development had a notable impact on the market, prompting a rebound in the price of gold, which had previously reached a 7-month low.
Technical Perspective
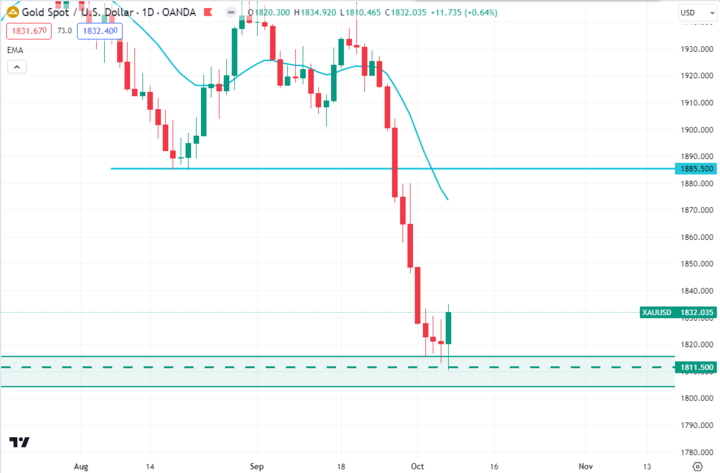
Source: TradingView.com
Gold price found support around the $1811.50 price area after an impulsive bearish momentum. As per the current price action context, the price had an impulsive daily bullish candle close above the $1811.50 psychological support level last week, which indicates that the price may retrace higher toward the $1885.50 price area in the coming days.
OIL (WTI)
Fundamental Perspective
The price of WTI has experienced a substantial decline over the past few trading sessions. Thursday's decrease can be attributed to the concurrent increase in open interest and trading volume, signaling the possibility of a sustained downward trend in the immediate future. Moreover, a breach of the $82.00 price level may lead to a potential reevaluation of the crucial psychological level of $80.00 per barrel.
Technical Perspective
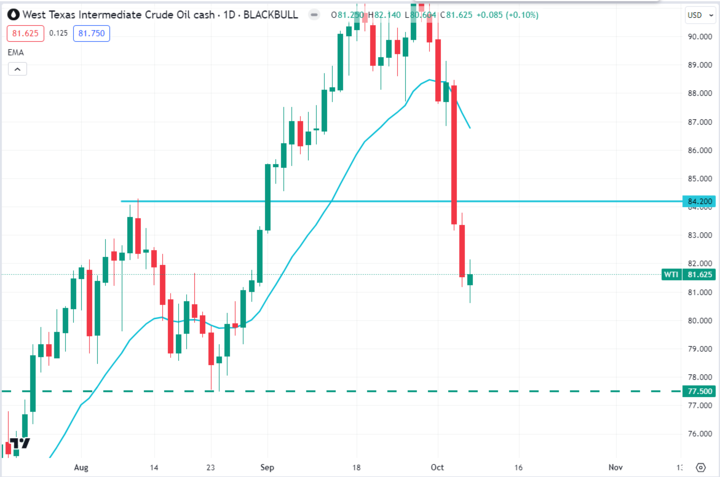
Source: TradingView.com
WTI broke below the $84.20 support level and is currently trading around the $81.62 price area. As per the current price action, the price may retrace higher toward the $84.20 area. So, if the price retraces higher toward the $84.20 price area and rejects with an impulsive daily bearish candle close, the bears may sustain the bearish momentum toward the $77.50 support level in the coming days.


