


Since Monday, Tesla stock (TSLA) dipped 7.8%, falling below $200 and reaching its lowest point since late May. This decline occurred despite a broader market rally and a rebound in the technology sector, which had previously been struggling.
Panasonic's Production Cut Could Affect Tesla
Panasonic, Tesla's battery supplier, announced a reduction in automotive battery production in Japan for the September quarter. Additionally, they revised their annual profit forecast downward by 15%, attributing this adjustment to the impact of a global decline in electric vehicle (EV) sales.
Notably, Panasonic manufactures battery cells for electric vehicles (EVs) used by various automakers around the globe, but they collaborate with Tesla at the Nevada Gigafactory in the United States.
This production cut affected both Japanese and international clients, excluding North American operations. During the second quarter, Panasonic reduced its delivery of 1865 EV batteries to Tesla. These older batteries are still used in Tesla Model S and Model X vehicles, which do not qualify for EV tax credits under the Inflation Reduction Act (IRA).
According to Panasonic's CFO, Hirokazu Umeda, demand has decreased because high-end Tesla models exceed the IRA's $80,000 price cap.
Tesla Financial Statement Review
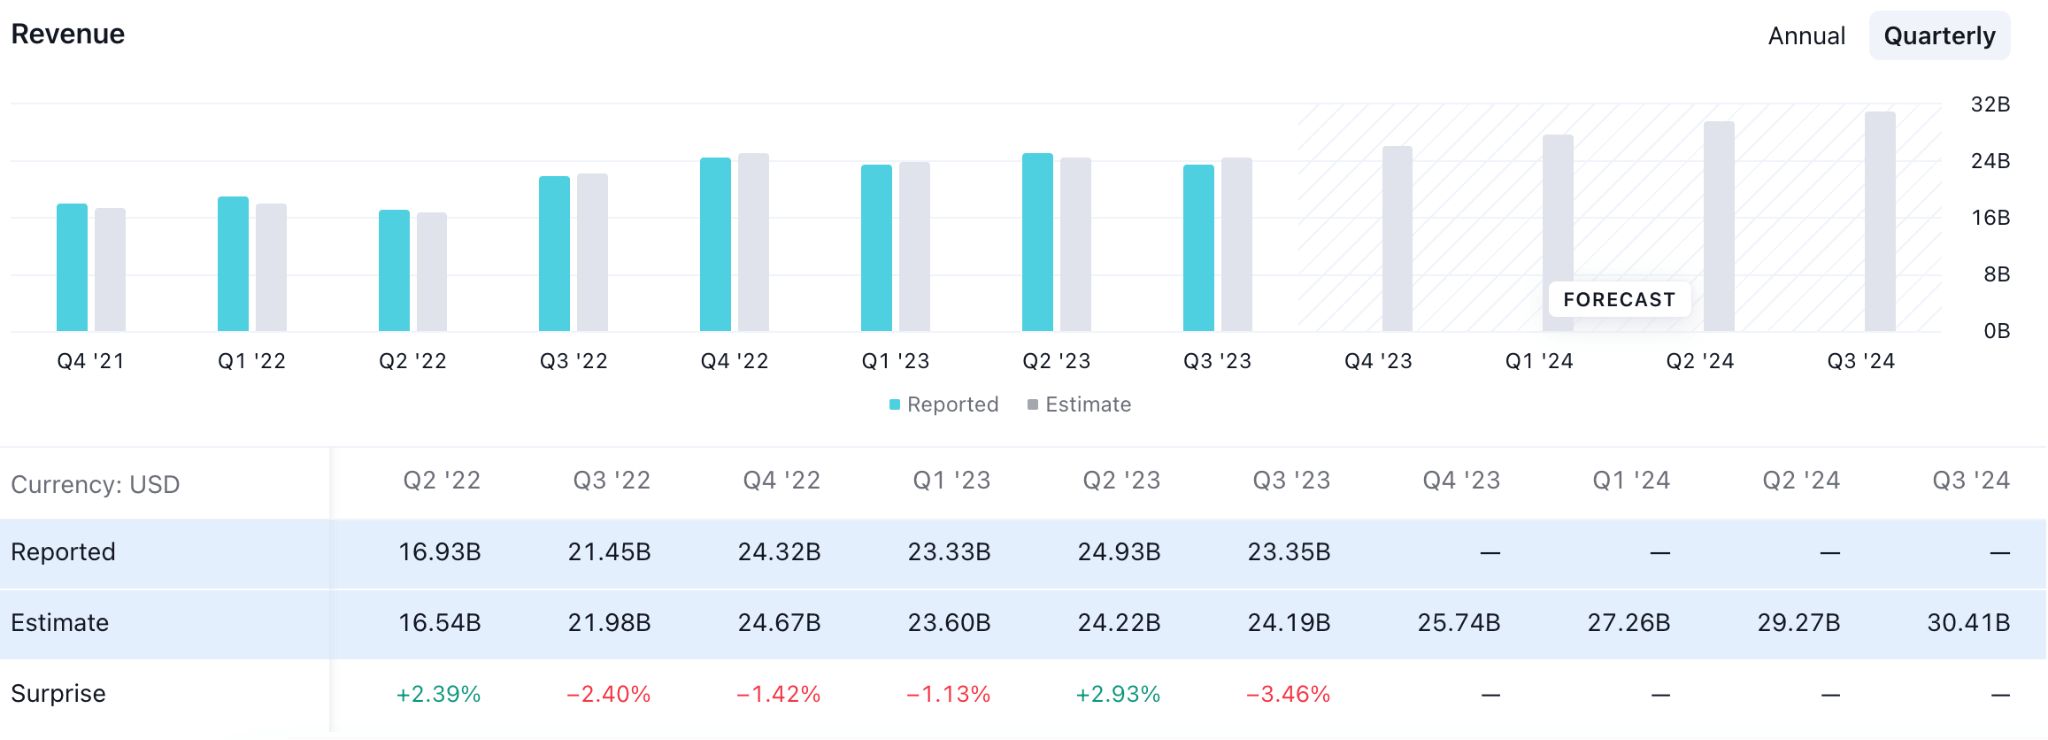
In the latest earnings report, Tesla Earnings Per Share came 9.48% lower to $0.66. However, the revenue was less hurt by coming 3.45% down from the expectation of $24.18 billion.
In the latest revenue curve, the last 4 quarterly report remains at the $24 billion level despite the ongoing chip issues and production.
Source: Tradingview
The current liquidity ratio shows a positive sentiment, where the current assets are 1.18X higher than current liabilities. Therefore, it is a sign that the company has enough liquidity to run the day-to-day business.
However, the net profit margin dipped to 7.93% in the last two quarters, which is lower than the previous 8 quarters. However, the GP margin was not 17.89% in the last two quarters, which was not much lower compared to the previous 8 quarters.
Finally, the long-term debt to equity looks stable as the company has more room to generate investment through debt finance.
Tesla Stock (TSLA) Technical Analysis
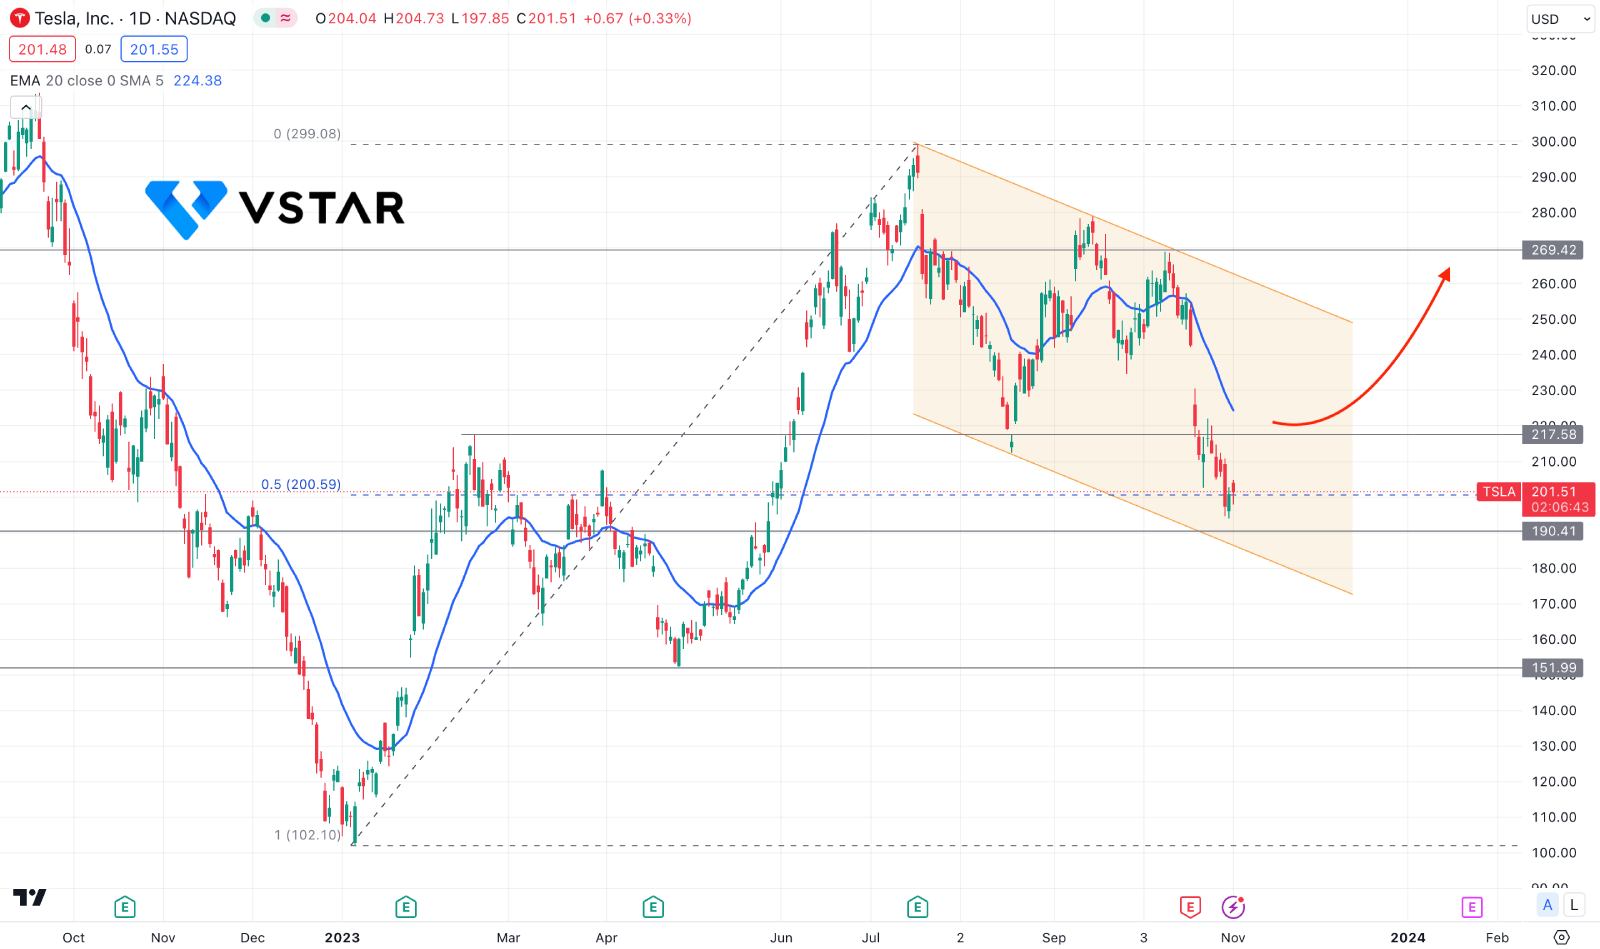
In the Tesla stock (TSLA) daily chart, the current price trades at the 50% Fibonacci Retracement level from the 2023 swing, which indicates a discounted zone. Moreover, a lower low is seen below the 212.09 level, while the current price reached near the descending channel support.
In the main chart, the dynamic 20-day Exponential Moving Average is still above the current price, while 190.41 is the immediate support level.
In that case, a bullish reversal with a D1 candle above the 217.58 level could be a long opportunity, targeting the 269.42 level.
On the other hand, the break below the 190.00 level could be a strong bearish opportunity, which could lower the price towards the 151.99 support level.


