


In 2023, gold experienced a relatively subdued year, reaching a new peak while demonstrating a modest 10% growth. Surprisingly, the value of platinum, its close relative, has decreased by around 10% this year.
Gold - Platinum Ratio Indicates A Divergence
Throughout trading history, gold and platinum have maintained a close relationship, fluctuating in tandem to a comparable degree. Nevertheless, this correlation appears to have deteriorated by 2023. Platinum is priced at approximately $1011 per ounce at the moment, which is considerably less than gold's $2,075 per ounce.
According to historical records, both platinum and silver reached an all-time high of approximately $2,200 per ounce. However, platinum is currently trading at approximately 55% less than that peak. This discrepancy has endured for the past five years, as platinum has encountered difficulty in surpassing $1,300 per ounce.
The gold/platinum ratio is frequently followed by investors and speculators on account of the two metals' historical correlation. The gold-to-silver ratio signifies whether one metal is being overvalued or undervalued in relation to the other. At the present time, the cost of one ounce of gold is greater than two ounces of platinum, indicating that gold is comparatively more expensive than platinum.
Platinum's Demand Is Solid
Platinum is primarily utilized in the automotive industry for catalytic converters; however, platinum prices have been pressured in 2023 due to decreased demand caused by slowing car sales and the rise of battery-electric vehicles. An economic recovery in 2024, on the other hand, might stimulate a surge in automobile demand, which could result in platinum price increases.
In light of these considerations, investors who are expecting an economic recovery may choose to hold a long position in platinum. Conversely, individuals with substantial knowledge of the precious metals industry might choose to short platinum and sell gold in an attempt to capitalize on a return to the mean in the gold-to-platinum ratio.
XPTUSD Technical Analysis
In the daily chart of XPTUSD, the broader market direction is bullish, initiated from the inverse Head and Shoulders breakout. Moreover, the recent price moved above the 50% Fibonacci Retracement level from 836.93 low to 992.63 high. As the current price trades at the premium zone, investors might expect an extensive bearish correction in the coming days.
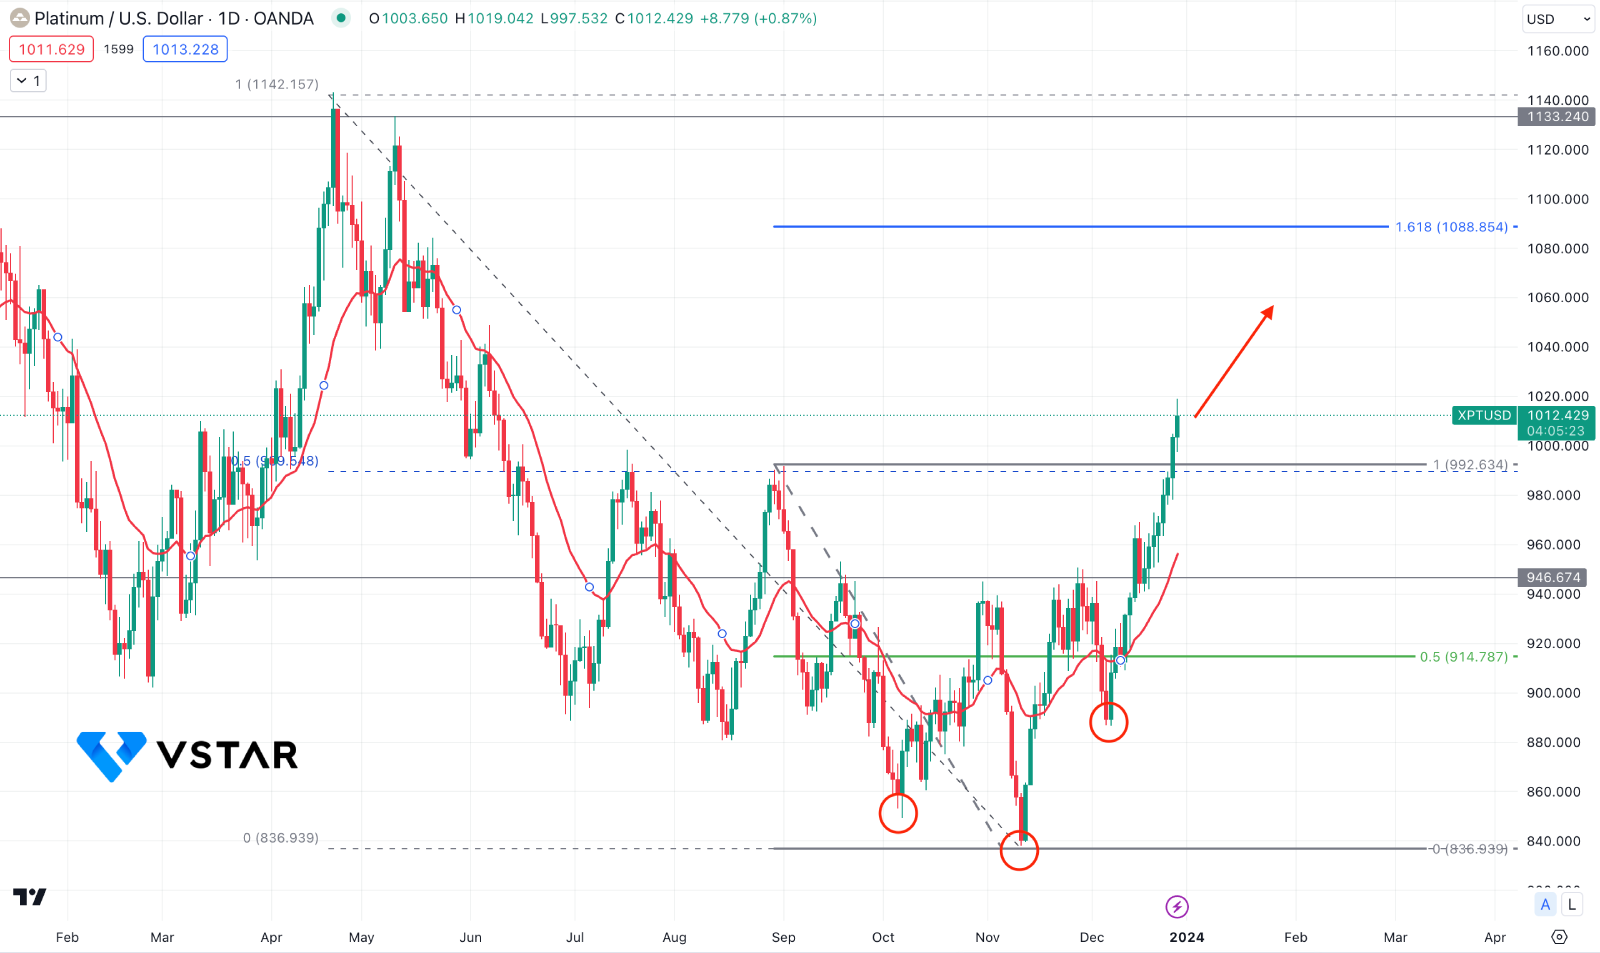
In the near-term price action, the buying pressure above the 1000.00 mark came with a new 28-week high formation in this pair.
Based on the current market outlook of XPTUSD, the ongoing buying pressure could extend towards the 1088.85 level, which is the 161.8% Fibonacci Extension level from the near-term swing.
On the bearish side, an immediate selling pressure with a daily close below the dynamic 20-day EMA could lower the price towards the 900.00 area.


