Introduction
Technical analysis and its importance for traders
Technical analysis is essential to the stock market because it gives traders important information about price movements, levels of support and resistance, and prospective trading opportunities. Technical analysis looks at previous price and volume data to forecast future price movements instead of fundamental analysis, which concentrates on a company's finances and intrinsic value. Traders frequently utilize it as a tool to make deft decisions based on market trends and patterns.
Overview of Sea Limited (NYSE: SE) and its recent performance
Sea Limited is a dynamic and rapidly growing company that operates in three main business segments: e-commerce, digital entertainment, and digital financial services. With a strong presence in Southeast Asia, Sea Limited has gained popularity among traders and investors due to its innovative products and impressive growth prospects.
SE's recent stock price performance has been somewhat muted as the reopening of the world’s economy has faded into the distance. The pandemic caused a bit of a stir for a while, but at the end of the day, the global economy seems to be slowing down, thereby putting pressure on many stocks.
Technical Analysis of Sea Limited (NYSE: SE) Stock
Price action and trend of SE's stock
For traders looking to locate prospective trading opportunities, analyzing the price movement and trend of SE's stock is essential. Traders can understand the stock's behavior and make wise judgments by looking at historical stock price performance and current trends.
Traders can determine SE's present valuation and possible upside or downside by comparing the stock price to its historical highs and lows. Determining SE's relative strength and performance compared to its competitors also involves evaluating the stock price of SE in relation to both its sector and the larger market.
SE is currently trading around the $58 level, with a 52-week high of just over $93. SE has a valuation of $70.57 per share, making it an attractive stock for value hunters. However, it is also important to understand that SE has announced it will be disbanding the financial part of the business.
Some notable peers and similar companies include:
· JD.com (JD)
· MercadoLibre (MELI)
· Alibaba (BABA)
Analysis of key technical indicators for SE Stock
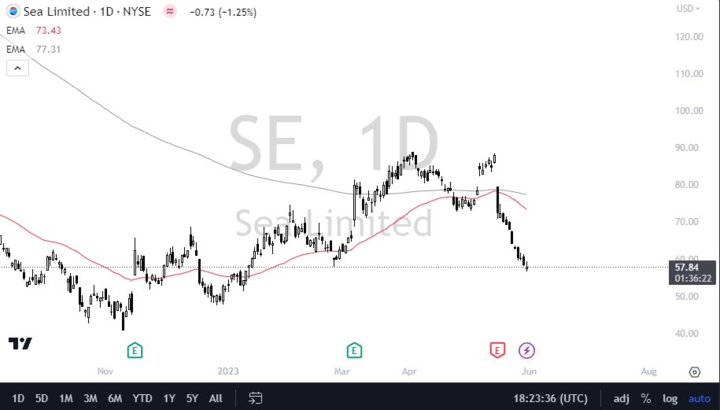
Moving averages: Moving averages are frequently used to spot trends and probable support and resistance levels. Traders can determine the direction of the stock and possible entry/exit points by computing the average price over a given time frame.
Relative strength index (RSI): A momentum oscillator called the RSI gauges whether a stock is overbought or oversold. Traders use this indicator to assess if the stock is due for a price correction or continuation.
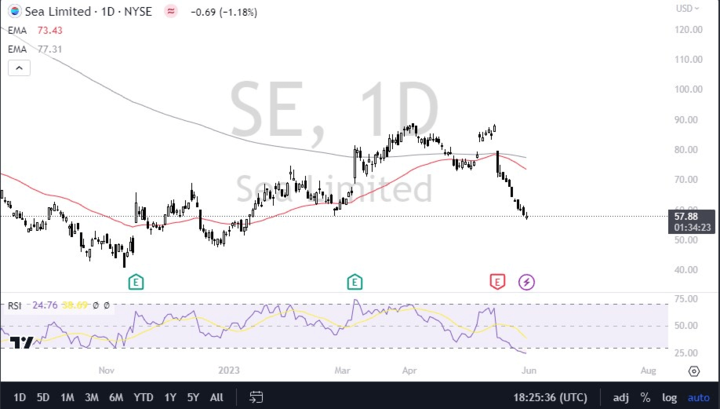
Moving averages and the RSI indicator on a daily chart of SE. You can see that the moving averages are starting to drift lower, and the RSI is falling. However, the RSI is in the oversold condition, suggesting that a bounce could be forthcoming.
Bollinger Bands: Bollinger Bands give information about potential reversal points and volatility. The bands, which enlarge and contract in response to price volatility, comprise a moving average line and two standard deviation lines. Breakouts from the bands may indicate potential trading opportunities.
MACD (Moving Average Convergence Divergence): The trend-following momentum indicator MACD aids in spotting changes in trends and the intensity of momentum. To identify probable buy or sell signals, traders examine the MACD line, signal line, and histogram.
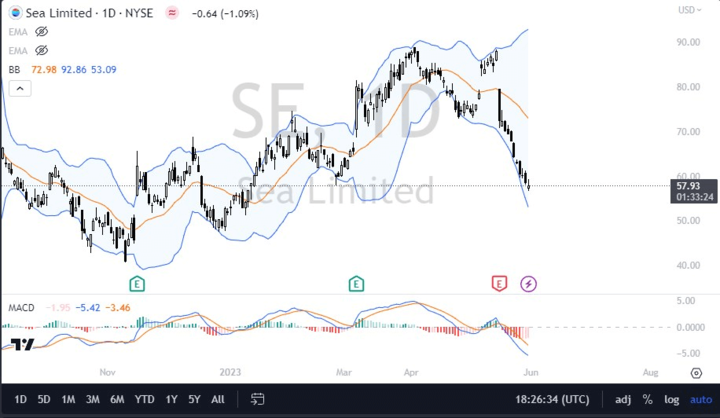
Bollinger Bands and MACD on a daily chart of SE. The Bollinger Bands are stretched to the downside, suggesting that a bounce could be coming. However, the market is decidedly still in a downtrend, as seen in the MACD.
Analysis of support and resistance levels
For traders, it is essential to pinpoint important support and resistance levels using previous price activity. Resistance levels serve as a price ceiling where increasing selling pressure may occur, while support levels represent a price floor at which purchasing pressure is anticipated. Traders can forecast probable price swings by studying how the stock responds around these levels and can then modify their trading methods accordingly.
Some crucial resistance levels include the $90 and the $100 levels above. The market has seen support at the $50 and $40 levels, respectively.
How to use chart patterns to identify potential trading opportunities
Price fluctuations and potential reversal or continuation patterns are represented visually by chart patterns like head and shoulders and double bottoms. These patterns can help traders identify probable entry or exit positions. Traders may make wise decisions and successfully manage risk by examining how these patterns arise and behave.
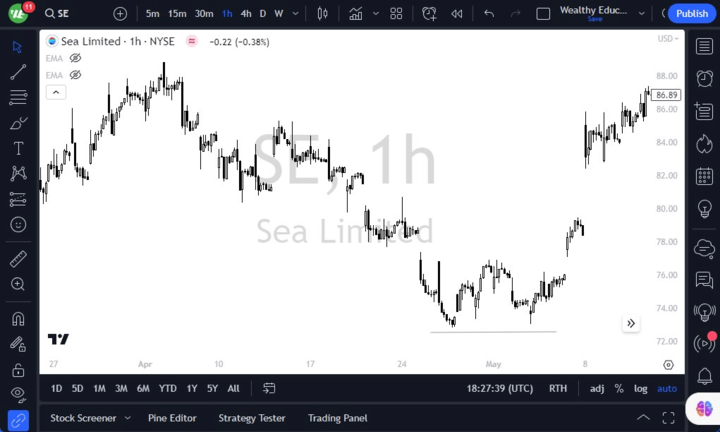
A recent “double bottom” in SE on the 1-hour chart. As this formation happens, traders start buying with a stop loss under the line on the chart.
Comparison of SE's performance to its industry and the broader market
It is possible to evaluate SE's market share and competitive advantages by comparing its financial performance to that of its competitors in the industry. Traders can assess the company's potential for growth, profitability, and operational effectiveness compared to its rivals. Additionally, traders can assess SE's value and financial health by contrasting its financial statistics with similar companies in the sector and the larger market.
The company announced in May that it was freezing salaries, dropping its financial division, and also eliminating bonuses. This is a reflection of a bad 2021, and should be some cause for alarm. Earnings per share came in at -$1.72, in contrast to JD.com, which came in at $1.68, and Alibaba coming in at $3.77. Simply put, SE has a lot of work to do.
While it can be compared to other companies focusing on e-commerce, digital entertainment, and digital finance, it is better to look at companies focusing on Asia specifically, as the global economy continues to bifurcate in what some call “deglobalization.”
Trading Strategies for Sea Limited (NYSE: SE) Stock
Different trading styles and their suitability for SE's stock
Trend following strategies: These tactics are designed to profit from long-term pricing trends. When employing this strategy, traders would search for evidence of a trend already developed in SE's stock and place trades anticipating that trend to hold.
Some of the most common ways people use trend following is by getting involved in the market with a “buy and hold” mentality, as longer-term investors look for stability and longer-term gains.
Mean reversion strategies: Mean reversion techniques presume that prices will return to their average or equilibrium levels following a deviation. To predict a price correction, traders using this technique would watch for overbought or oversold levels in SE's stock.
Traders often use oscillators like the RSI and MACD to determine the best time to buy or sell. This typically is a strategy where people look for overdone conditions but can be risky if not managed properly.
Breakout trading strategies: Using breakout methods, traders watch for important levels of support or resistance and place trades when the market breaches them. To identify prospective trading opportunities, traders employing this method would watch for major price changes in SE's shares.
A simple way to think about a breakout strategy is to buy or sell a stock when it breaks a specific level that has proven important more than once.
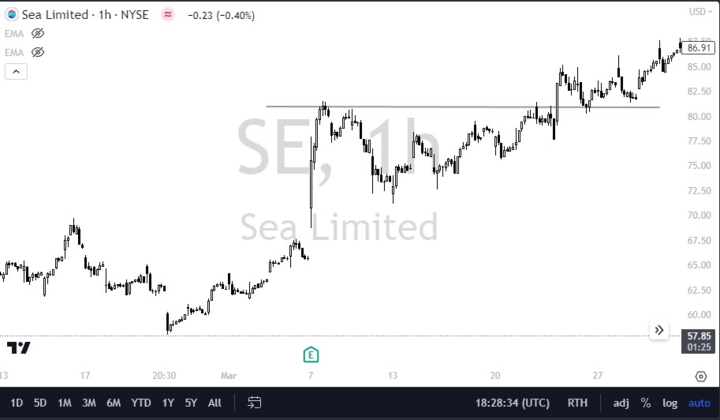
A recent breakout in SE on the 1-hour chart
It is essential to consider the pros and cons of each trading style and align it with one's risk tolerance, time horizon, and trading preferences.
Potential entry and exit points based on technical analysis
Technical analysis can give traders probable entry and exit opportunities based on several indicators, chart patterns, and support/resistance levels. Traders can determine the best entry and exit points for a position by combining various technical tools and undertaking in-depth analysis. However, this is very subjective and will come down to what each trader feels comfortable with and what their backtesting shows them regarding results.
Risk management strategies for trading SE's stock

Managing risk is crucial for traders to protect their capital and minimize potential losses. Risk management strategies for trading SE's stock may include:
Setting stop-loss orders: To minimize losses if the price swings against them, traders can define fixed levels at which they will close a trade. You should NEVER enter a trade without a stop-loss order.
Position sizing: Determining the appropriate position size based on risk tolerance and the potential reward-to-risk ratio helps control the overall risk exposure. Overexposure to the market can be very financially damaging to your account.
Use of fundamental analysis to complement technical analysis
Fundamental analysis considers a company's underlying financial and qualitative components, while technical analysis concentrates on price patterns and indications. Using fundamental and technical research together can give investors a complete picture of SE's stock. Fundamental elements that affect the stock price include news about the industry, management changes, and earnings reports.
However, some events have nothing to do with the company you should know. For example, unemployment could harm earnings if it becomes a major problem.
Potential catalysts that could impact SE's stock price
Investors should keep track of any triggers that might affect the price of SE's shares. These catalysts could consist of the following:
Macroeconomic trends: Economic indicators, interest rate changes, and trade conflicts all have the potential to impact market sentiment and, consequently, the price of SE's stock.
Industry-specific news: The stock price of SE can be greatly impacted by changes in governmental regulations, the introduction of new products by rival companies, or technological breakthroughs in the e-commerce and digital entertainment industries.
Company-specific events: Since they represent the financial performance and future prospects of the company, earnings reports, management changes, strategic collaborations, and acquisitions can all directly affect SE's stock price.
Three Ways to Invest in SE Stock
Hold the share: A typical investment strategy is to purchase shares of SE's stock to hold them for a long time, profiting from possible capital growth and dividends. This is the strategy that most people are familiar with.
Options: Options provide investors the chance, but not the commitment, to purchase or sell SE's shares at a predetermined price within a predetermined time window. Options can earn revenue, hedge holdings, or predict price movements.
It should be noted that the options markets come with time decay and of course, a lot of leverage. This can be very dangerous if you do not know what you are doing.
CFD (Contract for Difference): Without holding the underlying asset, traders can bet on the price changes of SE's shares using CFDs. Using leverage in CFD trading can go long or short on the stock and potentially increase gains or losses. Due to their accessibility, liquidity, and margin trading capabilities, traders favor CFDs.
A major advantage of CFD trading is that it allows you to tailor your position size easily. For example, you can trade as little as 1 share, unlike options.
Why trade SE Stock CFD with VSTAR
Choosing a reliable and reputable broker like VSTAR can enhance the trading experience when trading SE's stock as a CFD. VSTAR offers several benefits, including:
Competitive spreads: VSTAR provides competitive spreads, ensuring traders can enter and exit positions at favorable prices.
Advanced trading platform: VSTAR offers a user-friendly and feature-rich trading platform that provides real-time market data, charting tools, and order execution capabilities.
Risk management tools: VSTAR offers risk management tools, such as stop-loss orders and take-profit orders, allowing traders to manage their positions effectively and control risk.
Access to global markets: With VSTAR, traders can access a wide range of markets and instruments, including SE's stock, allowing for diversified trading opportunities.
Regulation: VSTAR is highly regulated and licensed in major jurisdictions worldwide, allowing traders to feel comfortable with their deposit at VSTAR and that the broker is reputable.
How to trade SE Stock CFD with VSTAR - Quick Guide


Trading SE's stock CFD with VSTAR is a straightforward process. Here's a quick guide:
Set up a VSTAR account: Fill in all the required information and finish the registration process to sign up on the VSTAR platform.
Deposit money: Transfer money into your trading account using one of the VSTAR-accepted payment methods.
Analyze an idea: Utilize the tools and resources VSTAR offers to do a technical and fundamental analysis of SE's stock. Think about elements like market news, indications, and price movements.
Set up a trade: Select the stock CFD for SE on the VSTAR trading platform. Specify the required transaction size based on your analysis and decide whether to go long (buy) or short (sell).
Establish risk management guidelines: Set stop-loss and take-profit thresholds to control your risk and reach your prospective profit goals. These parameters automatically close your position if the price exceeds the predetermined levels.
Monitor and manage your trade: On the VSTAR platform, you may monitor your positions, track your progress, and make adjustments.
Close your trade: To lock in profits or reduce losses, close the trade if it meets your predetermined exit criterion. Remember, all orders will fire off automatically if you have positions hitting stop-loss orders or take-profit orders.
Conclusion
Understanding price movements, support/resistance levels, and potential trading opportunities for Sea Limited (NYSE: SE) stock depend heavily on technical analysis. Trading decisions and strategies can be made by using a variety of technical indicators, examining chart patterns, and taking support and resistance levels into account.
Executing risk management tactics is crucial, considering various trading philosophies and whether they are appropriate for SE's stock and combining technical and fundamental analysis. The potential catalysts that affect the price of SE's stock should also be kept up to date by traders.
Selecting a trustworthy broker like VSTAR can offer traders a dependable and feature-rich trading platform when trading SE's shares as a CFD. Traders may easily execute trades and manage their holdings by using a brief tutorial and the tools and resources offered by VSTAR.
Ultimately, traders can negotiate the volatility of SE's stock and potentially profit from trading opportunities with careful technical analysis, sensible risk management, and a reliable trading platform.