


After the Non-farm payroll release, the US economy shows less possibility of a rate hike, while other indicators show a weakness.
The employment added 187K new positions in June, indicating a lower possibility of a rate reduction. However, it is going to be the first week of the month with fewer high-impact releases, which may offer a decent movement based on technical analysis.
As we delve into the Weekly Performance and Outlook for the week of September 04 - September 10, we find ourselves at a juncture where economic indicators, policy pronouncements, and market sentiment intertwine to shape the trajectories of key assets.
Gold / XAUUSD
Fundamental Perspective
Gold prices (XAU/USD) remain stable ahead of the US Nonfarm Payrolls (NFP) release and ISM Manufacturing PMI data for August. These upcoming economic indicators will establish the foundation for the Federal Reserve's (Fed) decision on interest rates, scheduled for September 20th. During the Jackson Hole Symposium, Fed Chair Jerome Powell emphasized that future policy actions would hinge on incoming data, noting that inflation's responsiveness to the job market has increased.
The precious metal is grappling with indecision as investors await a clearer understanding of labor market conditions before making informed trading decisions. Wednesday's release of the US ADP Employment Change report indicated a softening in labor demand and a slowdown in wage growth momentum for August. It appears that businesses are hesitating to expand their workforce due to a weakening demand outlook, aiming to avoid excess production.
Technical Perspective
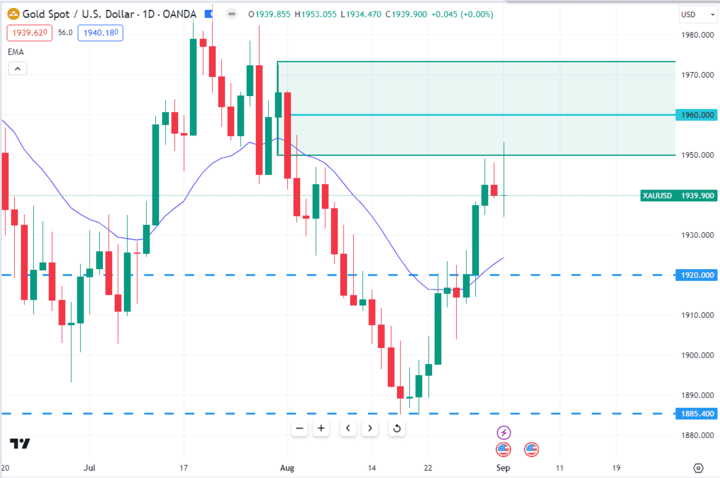
Source: tradingview.com
Gold is currently trading around 1939.90 price area. After bouncing from the 1885.40 key support level, the bulls pushed the price higher and broke above the 1920.00 psychological event level. As per the current scenario, Gold price may continue towards the 1960.00 order block area. So, if the price hits the 1960.00 price level and has an impulsive daily bearish candle close, the bears may regain momentum and push the price lower toward the 1920.00 support level in the coming days.
Oil / WTI
Fundamental Perspective
Western Texas Intermediate (WTI), the US crude oil benchmark, has reached a new year-to-date (YTD) high of $85.57, breaking a two-week losing streak thanks to additional supply cuts led by Saudi Arabia and Russia. Currently, WTI is trading at $85.56, marking a 2.79% gain.
Saudi Arabia is expected to continue its reduction of 1 million barrels per day (bpd) in output into October. According to Deputy Prime Minister Alexander Novak, Russia has also agreed with the Organization of the Petroleum Exporting Countries (OPEC) and its allies to reduce exports next month. Furthermore, the US Energy Information Administration (EIA) has reported a decrease in commercial crude inventories in the US for five of the last six weeks, indicating an increasing demand for WTI.
Technical Perspective
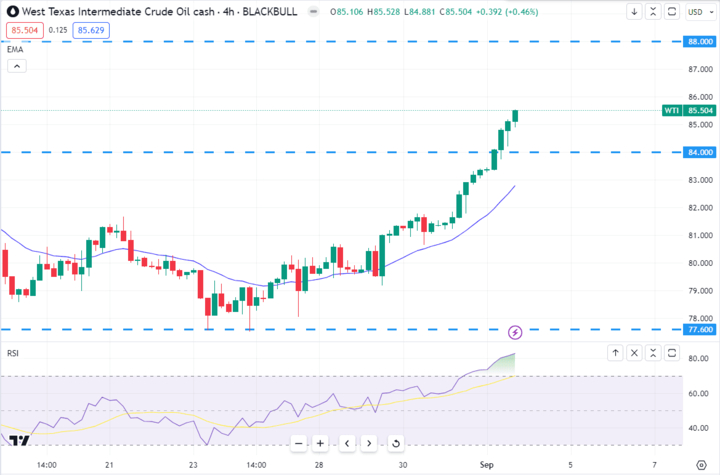
Source: tradingview.com
WTI broke above the key psychological resistance level $84.00. After bouncing from $77.60 support level, the bulls regained momentum, pushed the price higher, and broke above April’s key high level. As per the current price action context, the price may retrace towards the $84.00 key level before continuing further higher towards the $88.00 price area. Also, the RSI indicator shows that the price reached an overbought situation, which indicates a downward retracement in the days ahead.
EURUSD
Fundamental Perspective
After the release of a Nonfarm Payrolls report with mixed results, which showed higher-than-expected employment growth, slowing wages, and an unemployment rate surpassing expectations in August, the US Dollar (USD) changed its direction. It rebounded, driven by stronger Institute for Supply Management (ISM) PMIs.
The manufacturing index exceeded expectations but still indicated that the sector remains in contraction (below 50), registering at 47.6 compared to the expected 47. The Employment Index also outperformed expectations, reaching 48.5 against the anticipated 44.2. The USD's DXY index initially dropped to 103.27 following the lackluster Nonfarm Payrolls report but then regained ground after the release of better-than-expected PMIs, reaching around 104.22.
US yields experienced some volatility, initially declining to levels not seen since August 10 but later recovering some of those losses. The decrease in yields suggests that investors are increasingly betting on a lower likelihood of a Federal Reserve (Fed) interest rate hike this year. The CME FedWatch tool indicates that the probability of a 25 basis point (bps) increase is currently at nearly 35% for November and December, down from nearly 50% earlier this week.
Continued data releases will help investors shape their expectations for the upcoming September 20 meeting. As long as investors maintain their expectations of no interest rate hikes for the remainder of 2023, the potential for the USD to strengthen is limited.
Technical Perspective
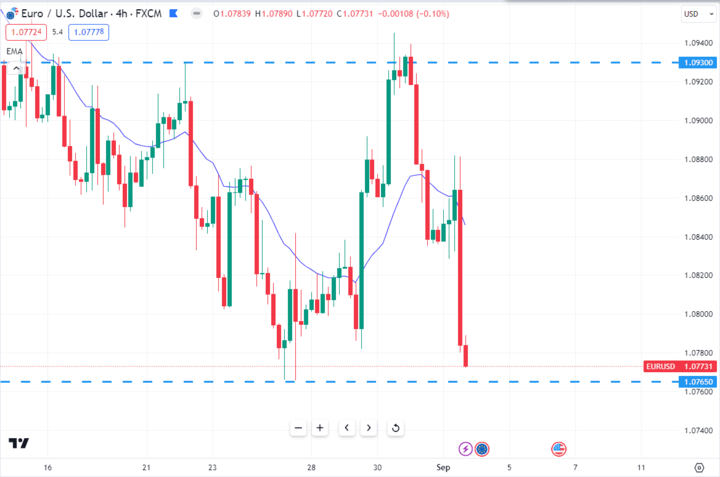
Source: tradingview.com
EURUSD is currently trading inside the range of 1.0765 - 1.0930 price area. After rejecting the 1.0930 resistance level, the bears pushed the price lower and broke below the dynamic level of 20 EMA. As per the current scenario, the price may continue towards the 1.0765 support level. So, if the price reaches the 1.0765 support level and has a bullish candle close, the bulls may push the price higher toward the 1.0930 resistance level again in the coming days.
GBPJPY
Fundamental Perspective
For the second consecutive day on Friday, the GBP/JPY currency pair is trading with a slight bearish bias, remaining close to the lower end of its weekly range during the Asian session. Despite this, spot prices manage to stay above the key 184.00 level. This situation urges cautiousness among aggressive bearish traders and prompts consideration of potential further downside movements.
Despite a generally positive sentiment in equity markets, the Japanese Yen (JPY) is drawing safe-haven flows due to concerns about a deeper global economic downturn. This safe-haven demand acts as a hindrance for the GBP/JPY pair. However, the GBP/JPY's decline is limited by underwhelming Japanese macroeconomic data. The most recent survey from Jibun Bank revealed that Japan's manufacturing sector continued to contract in August. Specifically, the Manufacturing PMI was confirmed at 49.6, slightly lower than the initial estimate of 49.7.
Technical Perspective
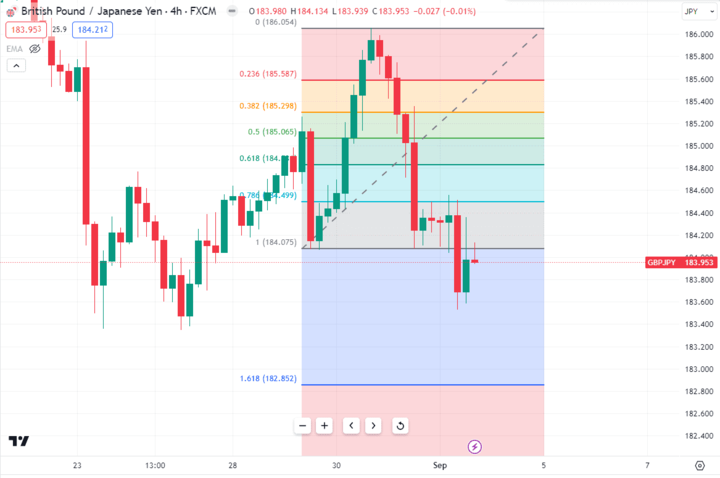
Source: tradingview.com
GBPJPY is currently residing around the 183.95 price area after breaking below the 184.075 support level. After bouncing from the 184.075 support level, the bulls pushed the price upwards but failed to break above the 186.05 resistance level. As per the current price action, the price may retrace toward the 0.50 Fibo level, before continuing further in the coming days.
NAS100
Fundamental Perspective
The NAS100, comprising the top 100 non-financial companies on the NASDAQ, faces an intriguing week ahead from September 3 to September 8, 2023. Despite lingering concerns about global economic growth, the index has displayed resilience. Investors will closely watch the release of economic data, including the US employment report, which could impact market sentiment. Additionally, any developments in international trade relations or political events may sway the NAS100's trajectory.
Tech giants like Apple, Amazon, and Google parent Alphabet will remain key drivers of the index, with their earnings and product releases affecting market sentiment. The NAS100 has been supported by strong corporate earnings, but valuations are high, posing potential risks.
The Federal Reserve's stance on interest rates will also be crucial, as any unexpected shifts can influence investor sentiment. Overall, while the NAS100 has shown strength, caution and a vigilant eye on economic indicators and global events will be essential in navigating the market in the coming week.
Technical Perspective
Source: tradingview.com
NAS100 is currently residing around the $15484 price area and trying to retrace downside. After an impulsive bullish momentum, the price found resistance around the $15600 price level. So, if the price retraces toward the $15365 support level and has an impulsive bullish candle close above it, the bulls may continue further toward the $15800 key resistance level in the coming days.
SP500 / SPX500
Fundamental Perspective
The S&P 500 faces a pivotal week from September 3 to September 8, 2023, as it navigates various economic and geopolitical factors. Investors will closely monitor the release of key economic data, particularly the US Nonfarm Payrolls report, which could sway market sentiment. Concerns about inflation and the Federal Reserve's potential response will remain in focus, with any unexpected policy shifts having a significant impact.
Earnings reports from major corporations will play a crucial role, as robust corporate performance has been a key driver of the index's strength. Tech giants like Apple, Microsoft, and Facebook will be particularly influential.
Global trade dynamics, particularly in relation to China and Europe, may also weigh on the S&P 500, given its multinational composition. Geopolitical events and their potential to disrupt markets will demand attention.
Technical Perspective
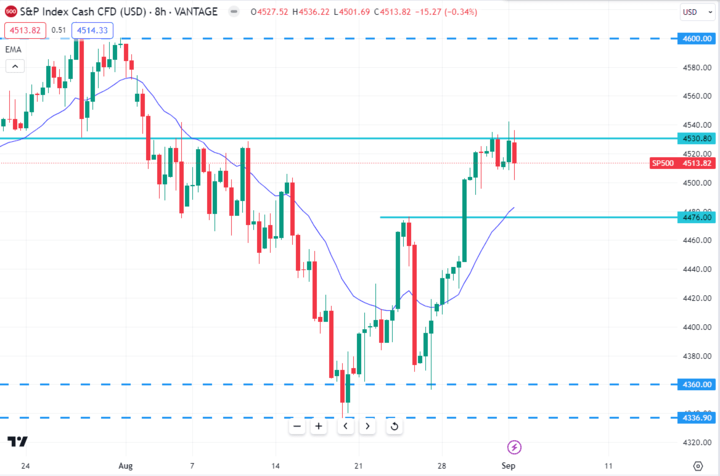
Source: tradingview.com
SP500 is currently trading around the $4513.80 price area and trying to push downward. After bouncing from the $4336.90 - $4360.00 support area, the bull regained momentum and pushed the price higher toward the $4530.80 event level. As per the current price action, the price may retrace towards the dynamic level of 20 EMA. So, if the price retraces towards 20 EMA and has an impulsive bullish candle close, the bulls may push the price higher toward the $4600 key level in the coming days. On the contrary, if the price breaks below the dynamic level of 20 EMA and has an impulsive bearish candle close, the bearish may regain momentum and push the price down toward the $4360 price area in the coming days.
HK50
Fundamental Perspective
The Hang Seng Index (HK50) faces a challenging week from September 3 to September 8, 2023, characterized by various factors influencing its direction. The ongoing regulatory changes in China, particularly affecting the technology and education sectors, will continue to cast a shadow on Hong Kong's markets. Traders will closely monitor any further developments and potential policy shifts.
Economic data releases, both domestic and global, will also be pivotal. Chinese economic indicators, such as manufacturing and trade data, can significantly impact the HK50 due to Hong Kong's close economic ties with mainland China.
Technical Perspective
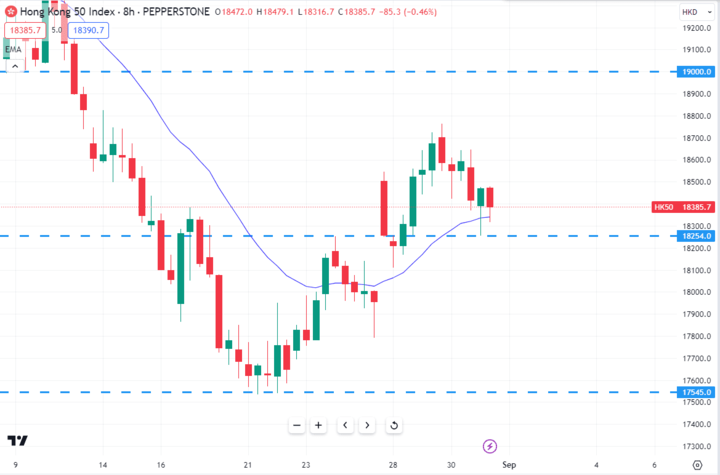
Source: tradingview.com
HK50 is currently residing around the $18385 price area after breaking over the $18254 resistance level. Last week price found support after retracing to the $18254 event level and had an impulsive bullish candle close with a support of 20 EMA. As per the current price action, if the price can remain over the 20 EMA in the coming days, the bulls may push the price higher towards the $19000 price level.
Bitcoin / BTC
Fundamental Perspective
The Bitcoin price is significantly influenced by the Federal Reserve's macroeconomic policies, and the Fed closely monitors labor market indicators to assess inflation trends, with the upcoming Nonfarm Payrolls (NFP) report taking a prominent role. The NFP data has been released at 179,000, slightly surpassing the forecast of 170,000. However, as the deviation is relatively modest, it's unlikely to have a substantial impact on the financial markets.
Nevertheless, it's essential for investors to consider that Fed Chair Jerome Powell has hinted at the possibility of another interest rate hike if the data indicates a slowdown in inflation. Investors will have to wait until September 20 to learn whether the Fed will raise or pause interest rates. Currently, the CME FedWatch Tool indicates a 93% probability that the Fed will not raise interest rates.
Technical Perspective
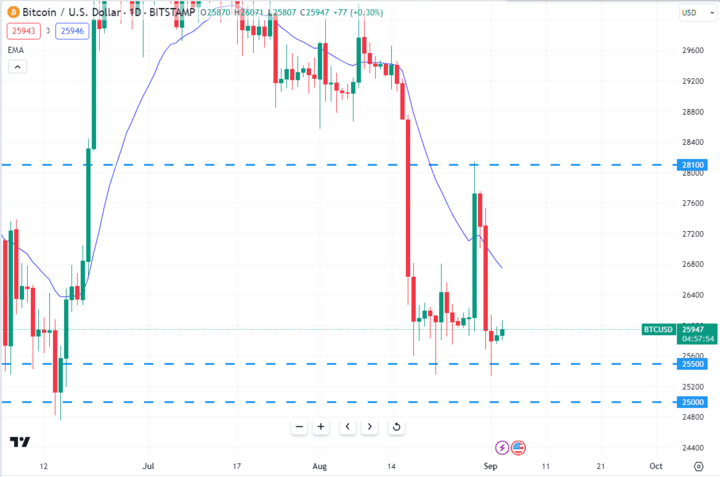
Source: tradingview.com
BTC is currently trading around the $25930 price area and trying to push higher. After rejecting the $28100 resistance level, the bears regained momentum and pushed the price downside, but failed to break below the $25500 - $25000 support level. As per the current scenario, if the price can have an impulsive bullish candle close over the $25500 - $25000 support level, the bulls may push the price upward toward the $28100 resistance area again in the days ahead.
Ethereum / ETH
Fundamental Perspective
Ethereum (ETH) faces a pivotal week from September 3 to September 8, 2023, with several factors shaping its outlook. Regulatory developments and government actions regarding cryptocurrencies will continue to be in focus, potentially affecting market sentiment. Ethereum's ongoing transition to Ethereum 2.0, with its upgrade to a proof-of-stake consensus mechanism, remains a significant driver. Progress in this transition could bolster confidence in the network's scalability and sustainability.
Market sentiment and broader economic conditions will also influence ETH's performance. Geopolitical tensions, inflation concerns, and macroeconomic data releases can sway investor sentiment toward cryptocurrencies.
Technical Perspective
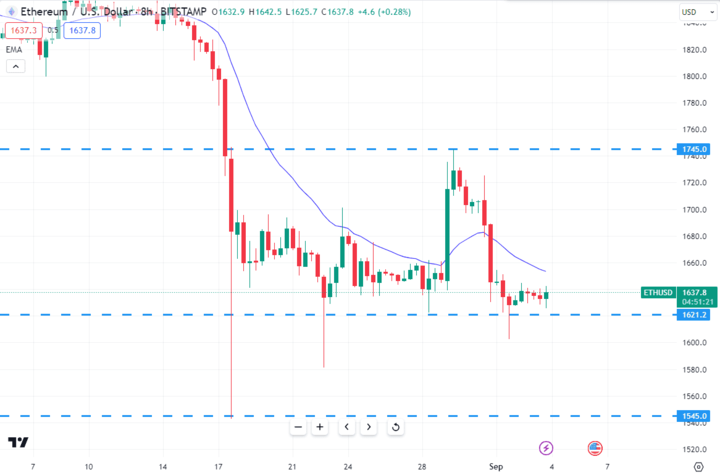
Source: tradingview.com
ETH is trading inside the range of $1745 - $1621 price area for an extended period. As per the current price action context, if the price can have a strong bullish candle close over the $1621 support level, the bulls may regain momentum and push the price upward in the coming days. On the contrary, if the price can have an impulsive bearish candle close after breaking below the $1621 support level, the price may continue further lower towards the $1545 area in the days ahead.
Tesla / TSLA
Fundamental Perspective
Tesla (TSLA) enters the week from September 3 to September 8, 2023, with several factors shaping its market outlook. One key driver will be the electric vehicle (EV) industry's broader performance, as Tesla remains a bellwether in this sector. Any significant developments, such as new product announcements or changes in EV adoption trends, can sway TESLA's stock price.
Earnings reports and production updates will also be pivotal. Investors are keen to see whether Tesla can maintain its impressive growth and profitability. Government policies and incentives related to clean energy and EVs will continue to play a crucial role. Changes in regulations and subsidies can significantly impact Tesla's sales and market sentiment. Global economic conditions and trade dynamics will further influence TSLA's performance, especially given its international footprint.
Technical analysis will provide key support and resistance levels for traders to monitor.
Overall, Tesla's outlook remains promising, but investors should remain vigilant about industry trends, regulatory changes, and broader market factors to make informed decisions during the coming week.
Technical Perspective
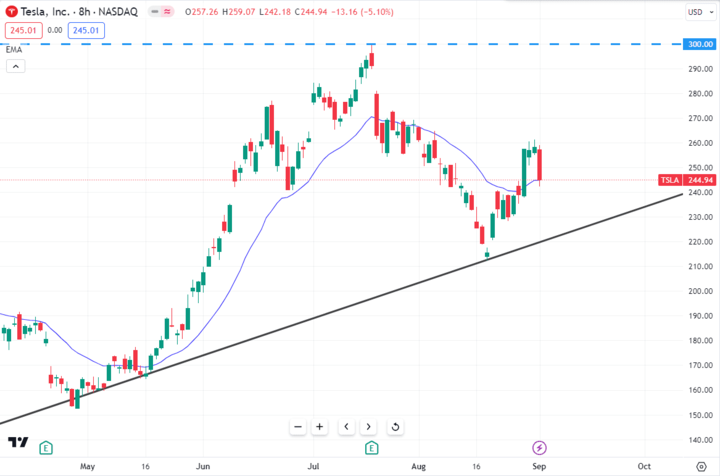
Source: tradingview.com
TSLA is currently trading around $244.94 price area and trying to push downside. After bouncing from the bullish trend line, the bulls pushed the price upwards but failed to sustain above the $260 price area. As per the current scenario, the price may retrace towards the bullish trend line again in the coming days. So, if the price retraces towards the bullish trend line and has a strong bullish candle close above it, the bulls may regain momentum and push the price higher toward the $300 key resistance level in the days ahead.


