EURUSD
Fundamental Perspective
The EURUSD pair closed just below 1.1100, remaining stable for the week despite early losses that saw the pair hit a low of 1.1001. The US Dollar initially gained strength due to market risk aversion but later reversed as the European Central Bank (ECB) and US inflation data influenced sentiment.
The ECB reduced its deposit rate by 25 basis points to 3.5% while cutting other key rates by 60 basis points, reflecting slow economic growth in the Eurozone. ECB President Christine Lagarde acknowledged these economic headwinds and indicated that restrictive monetary policy would remain in place as long as needed to control inflation. The ECB reaffirmed that future decisions would be made on a meeting-by-meeting basis and would rely on incoming data.
In the US, inflation data fell to beat expectations. The Consumer Price Index (CPI) and Producer Price Index (PPI) figures both missed forecasts, reducing hopes for a larger 50-basis-point rate cut by the Federal Reserve. Instead, markets now expect a 25-basis-point reduction, with the Fed's updated economic projections likely to shape future policy.
Upcoming monetary decisions from the Bank of England and Bank of Japan, as well as critical economic data from the US and Eurozone, may further influence market sentiment.
Technical Perspective
The last weekly candle closed as a doji with a small red body and longer lower wick after a green inverted hammer candle. This suggests that EURUSD might still have bullish pressure for next week.
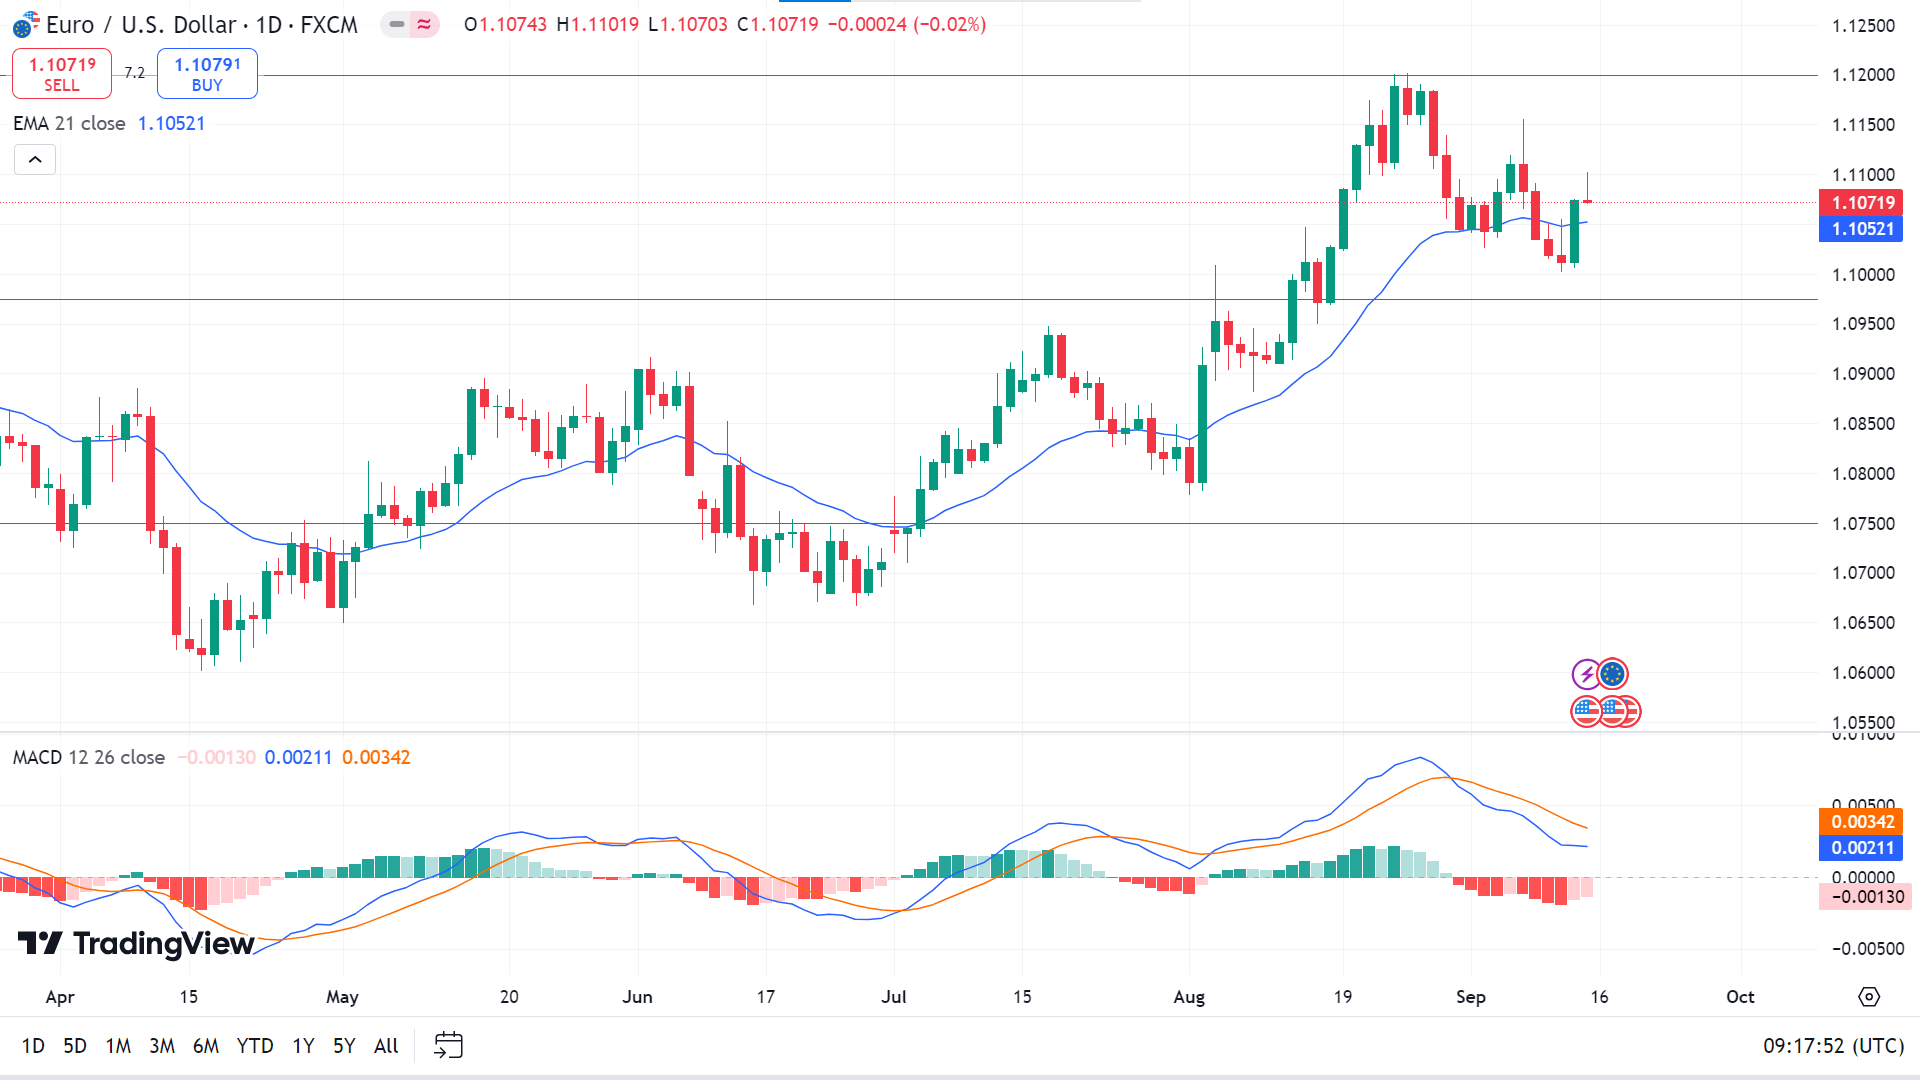
On the daily chart, the price is above the EMA 21 line, reflecting recent bullish pressure, while the MACD indicator window reading suggests otherwise. The red histogram bars on the MACD window are fading, indicating a weaker selling pressure. Following the major trend, the price has a higher possibility of hitting the nearest resistance near 1.1200, followed by the next resistance near 1.1432.
Meanwhile, if the bearish pressure on the MACD indicator window continues and the price declines below the EMA 21 line, it can reach the primary support near 1.0975, followed by the next support near 1.0745.
GBPJPY
Fundamental Perspective
The Pound Sterling weakened following softer UK wage growth and disappointing GDP data. In July, average earnings excluding bonuses rose 5.1% year-over-year, down from 5.4% in June. Meanwhile, the UK economy showed no growth in July, missing the expected 0.2% increase, after stalling in June, according to the Office for National Statistics.
In Japan, Bank of Japan (BoJ) board member Naoki Tamura indicated the need to raise short-term rates to around 1% by fiscal 2026 to reach the 2% inflation target consistently. This strengthened expectations of another BoJ rate hike by year-end, which could further pressure the GBP/JPY pair as capital shifts toward the yen.
Focus now turns to the upcoming UK Consumer Price Index (CPI) report and the Bank of England's (BoE) rate decision, which will likely influence the next directional move for GBPJPY. Although it's not a "Super Thursday," the BoE will announce its rate decision without updated projections or a press conference from Governor Andrew Bailey. Traders will also watch the UK retail sales figures and a speech by BoE policymaker Cathrine Mann for additional guidance.
Technical Perspective
The last weekly candle closed with a solid red body, posting two consecutive losing weeks, which might work as a bearish continuation signal.
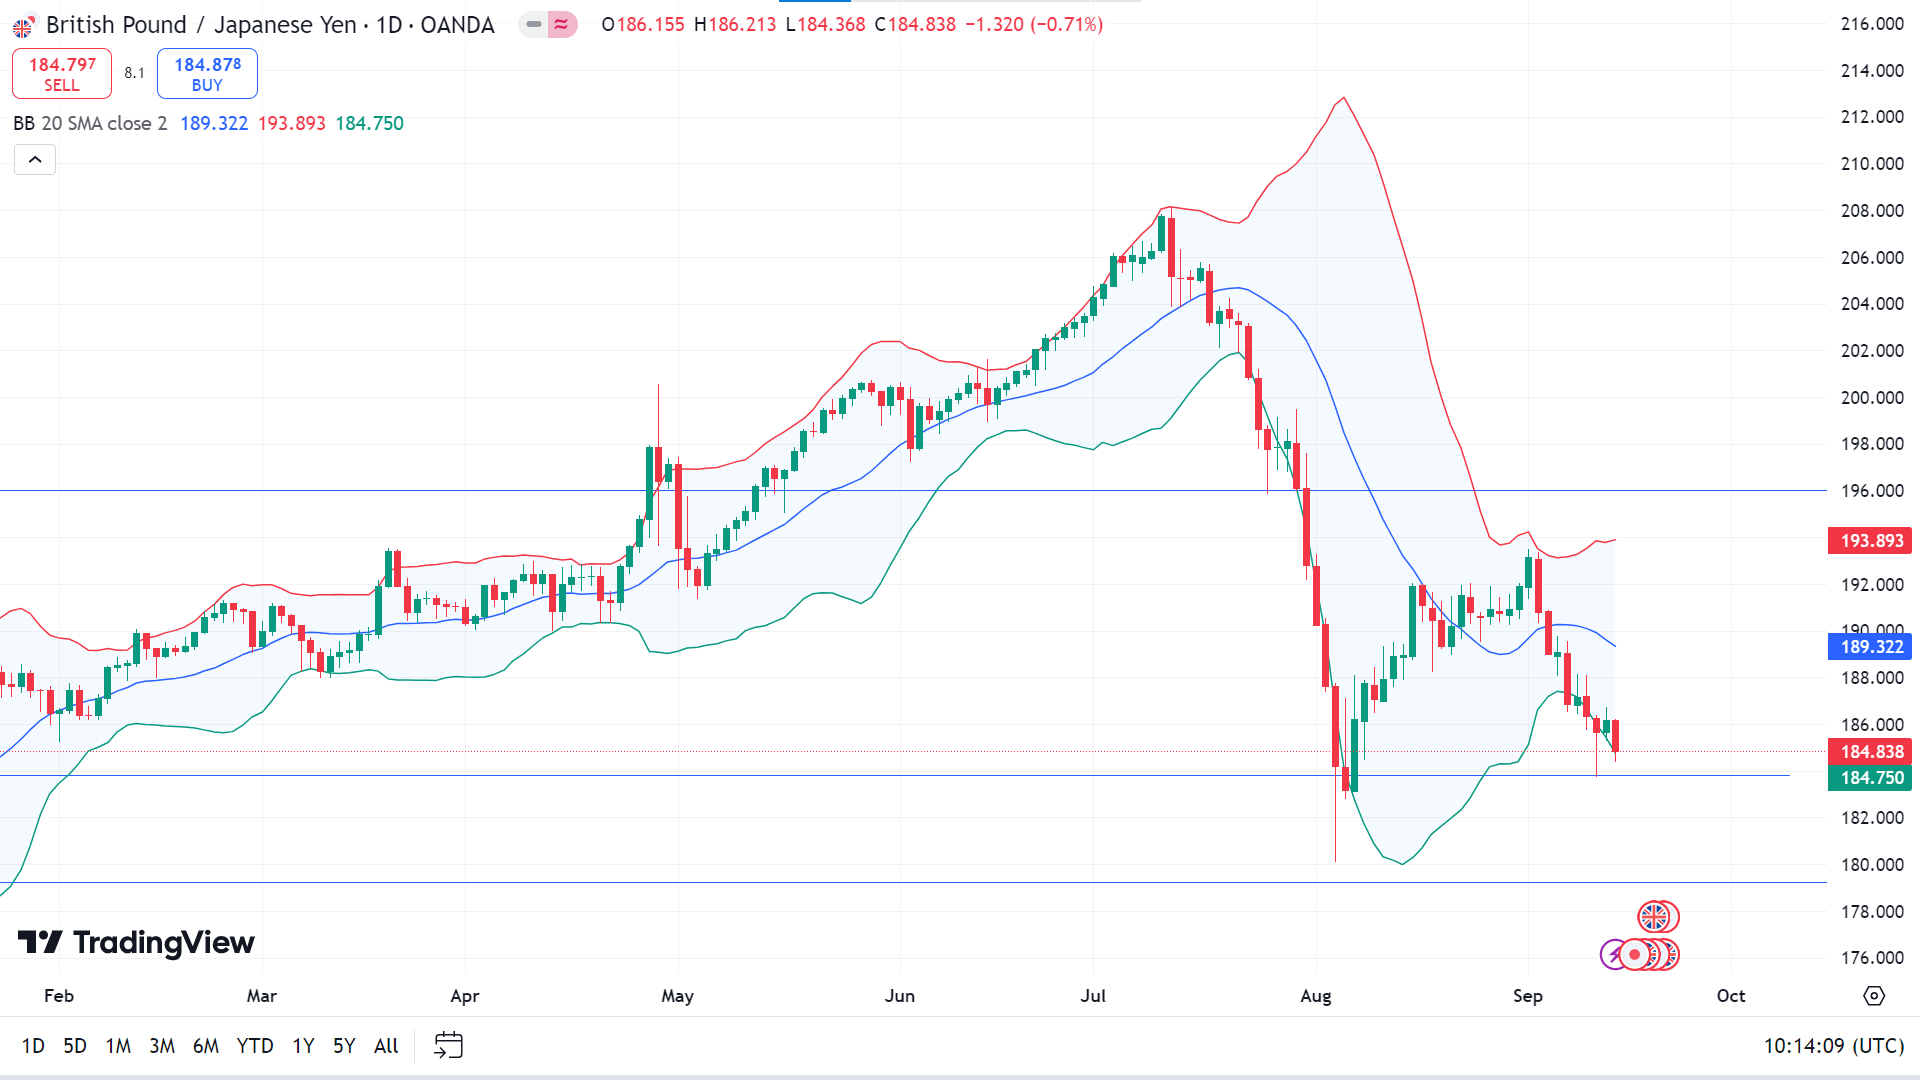
On the daily chart, the price is floating closely with the lower band of the Bollinger Bands indicator, reflecting excessive selling pressure. The recent bearish pressure can trigger the price toward the primary support level near 183.80, followed by the next support near 179.25.
Meanwhile, the price on the lower band of the Bollinger Bands suggests it's an oversold condition and a possible retracement. Any bullish correction may drive the price toward the nearest resistance near 189.32, followed by the next resistance near 193.89.
NASDAQ 100 (NAS100)
Fundamental Perspective
Wall Street's main indexes ended higher last week as investor speculation grew over the likelihood of a more significant Federal Reserve interest rate cut. Small-cap stocks, which are more sensitive to interest rate changes, led the gains as bets on the Fed's decision fluctuated.
By late Friday, the CME FedWatch Tool showed a nearly even split, with the probability of a 50-basis point cut jumping to 49%, up from 28% the day before. Meanwhile, the chances of a 25-basis point cut stood at 51%. This shift followed comments from former New York Fed President Bill Dudley, who argued there was a strong case for a more considerable rate reduction. His remarks contributed to the market's upward momentum.
Despite earlier reports of slightly higher producer and consumer prices suggesting a more minor cut, Dudley's remarks helped fuel Friday's rally. Investors had been closely watching for signals ahead of the Fed's decision on September 18, where the central bank faces a tough choice on how much to ease.
Additionally, a survey revealed improved U.S. consumer sentiment in September as inflation pressures eased. However, caution persisted as Americans remained wary ahead of the upcoming presidential election.
Technical Perspective
The last weekly candle closed as a solid green candle, eliminating losses from the previous two weeks, signaling an upward continuation.
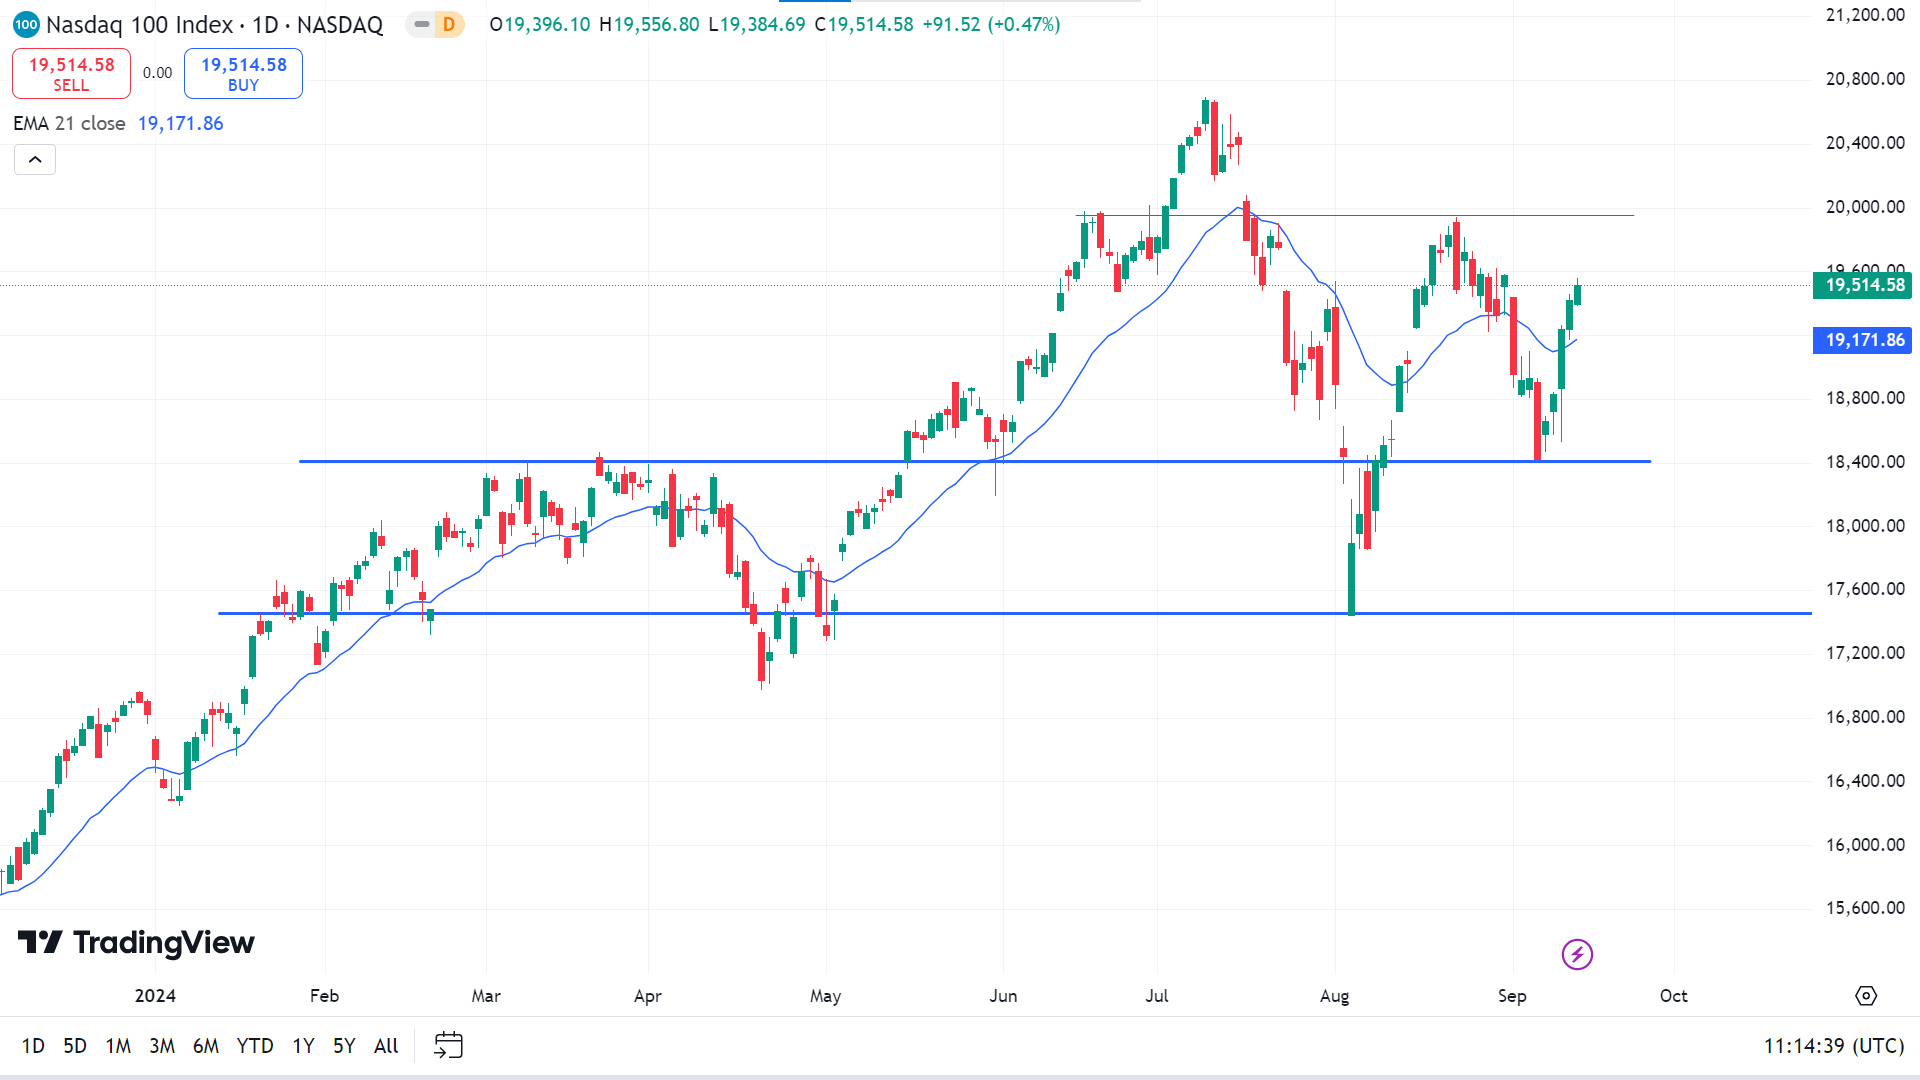
On the daily chart, the price surge over the EMA 21 line is a bullish continuation, which can drive the price toward the nearest resistance near 19,955.44, followed by the next resistance near 20,554.05.
However, if the price declines below the EMA 21 line, it will open room for the price to reach the primary support near 18,408.13, followed by the next support near 17,457.76.
S&P 500 (SPX500)
Fundamental Perspective
U.S. benchmark equity indexes closed higher last Friday as investors looked ahead to the Federal Reserve's upcoming monetary policy decision. Gains were broad-based, with utilities and communication services leading the advance.
The Federal Open Market Committee (FOMC) will start its two-day meeting on Tuesday, and markets will closely monitor the outcome. The CME FedWatch Tool showed a 53% chance of a 25-basis-point interest rate cut on Wednesday, while a more aggressive 50-basis-point cut remains a 47% possibility.
In the bond market, the U.S. two-year yield declined 5.9 basis points to 3.59%, and the 10-year yield dropped 2.1 basis points to 3.66%.
On the economic front, U.S. consumer sentiment reached its highest point since May, with year-ahead inflation expectations falling to their lowest level since December 2020, based on preliminary data from the University of Michigan.
Meanwhile, West Texas Intermediate crude oil rose 0.5% to $69.28 a barrel, on track for a weekly gain.
Technical Perspective
The last weekly candle ended solid green, completely recovering the previous red candle, reflecting strong demand for the asset.
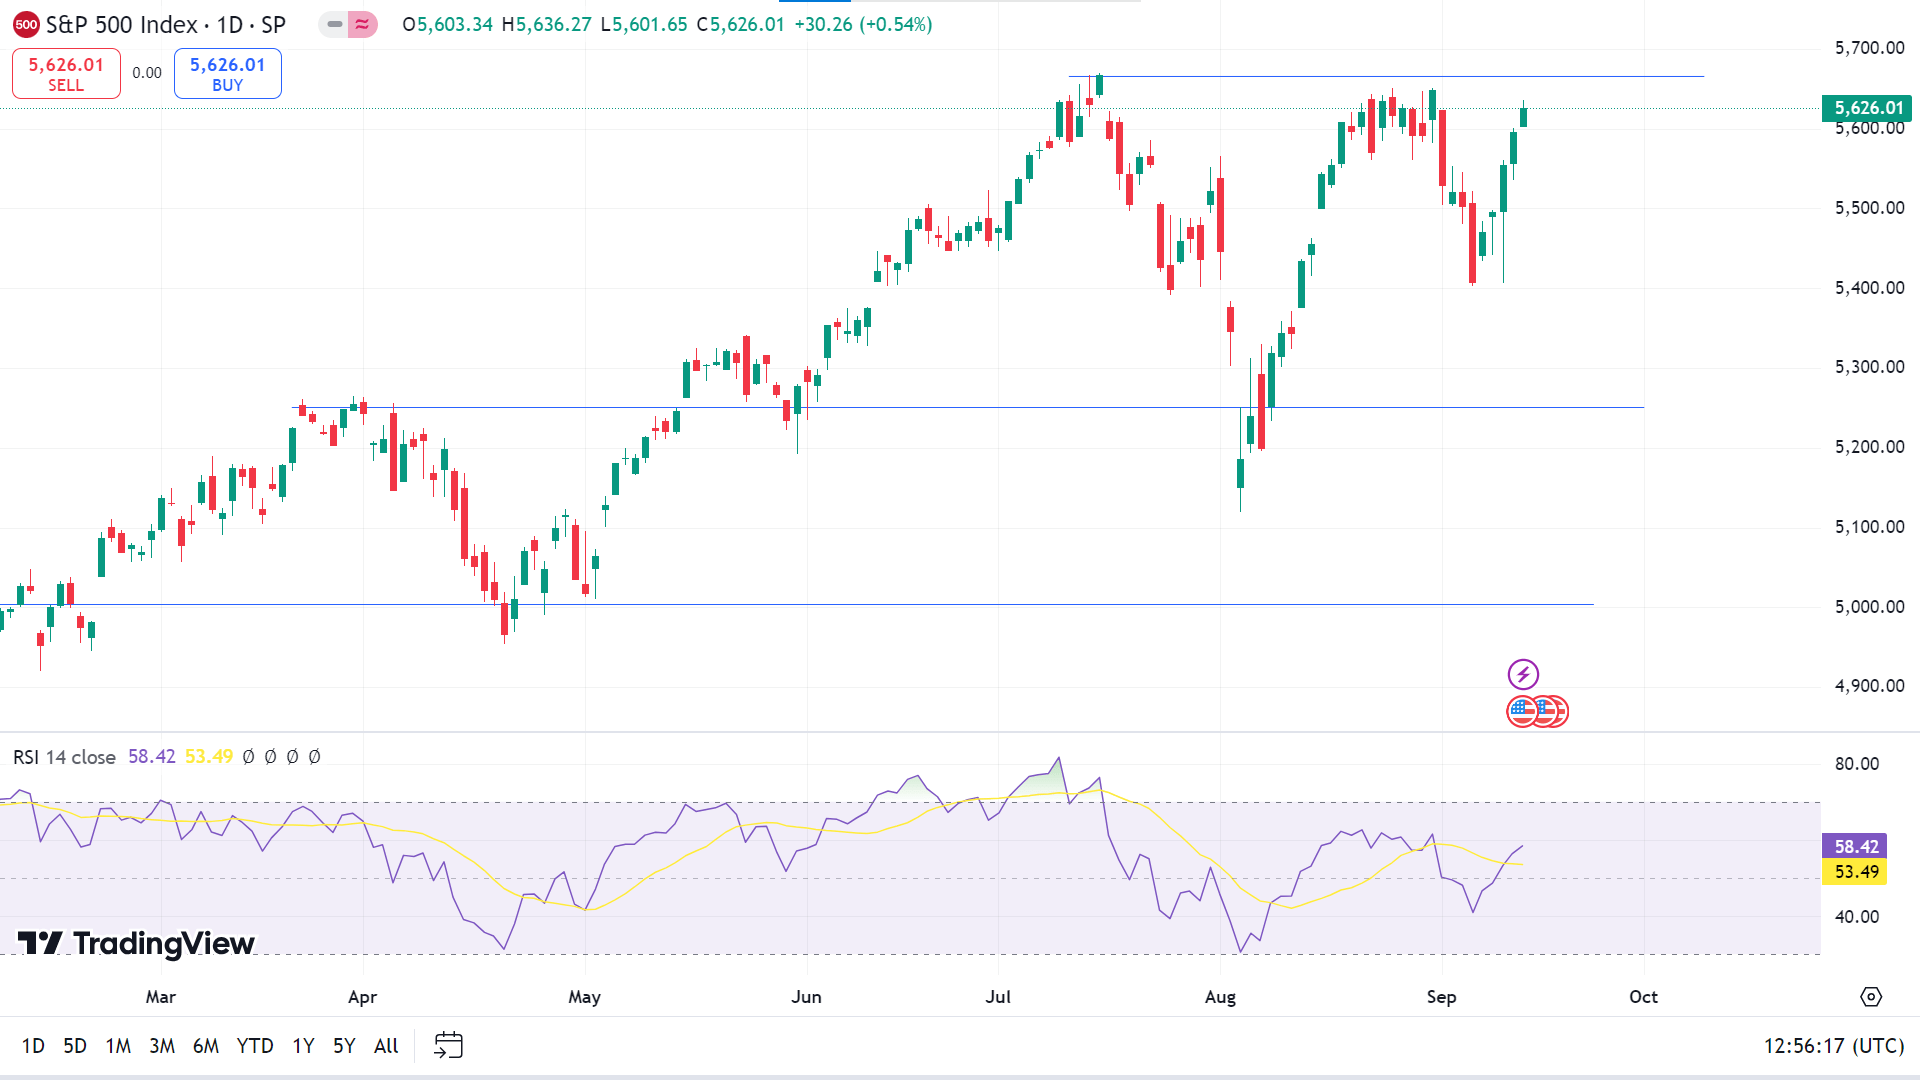
The price is moving on an uptrend, as the RSI indicator window suggests through the dynamic signal line edging above the midline of the indicator window. This indicates the index price can hit the previous resistance of 5,669.67, and any breakout can trigger the price toward the next resistance near 5,802.09.
Meanwhile, on the downside, if the dynamic RSI signal line starts sloping toward the midline, the index price can drop near the primary support of 5,251.20, followed by the next support near 5,013.63.
Gold (XAUUSD)
Fundamental Perspective
The yellow metal broke out of a range it had been stuck in since peaking on August 20, driven by mixed U.S. Producer Price Index (PPI) data for August. While the headline PPI slowed more than expected, the core PPI remained sticky. Markets, however, viewed the data as disinflationary, fueling Gold's momentum.
The rally continued as debate over the Federal Reserve's upcoming interest rate decision intensified. Earlier, high core Consumer Price Index (CPI) data released on Wednesday had lowered expectations of a 0.50% rate cut. However, an article by Wall Street Journal's Fed watcher Nick Timiraos, along with comments from former New York Fed President William Dudley, renewed speculation that a 0.50% cut might still be on the table.
This fueled a decline in U.S. Treasury yields, weakened the U.S. Dollar, and further boosted Gold prices. Lower interest rates benefit Gold by reducing the opportunity cost of holding the non-yielding asset, making it more attractive to investors.
Technical Perspective
The last weekly candle finished solid green, showing a decent bullish continuation opportunity for the coming days.
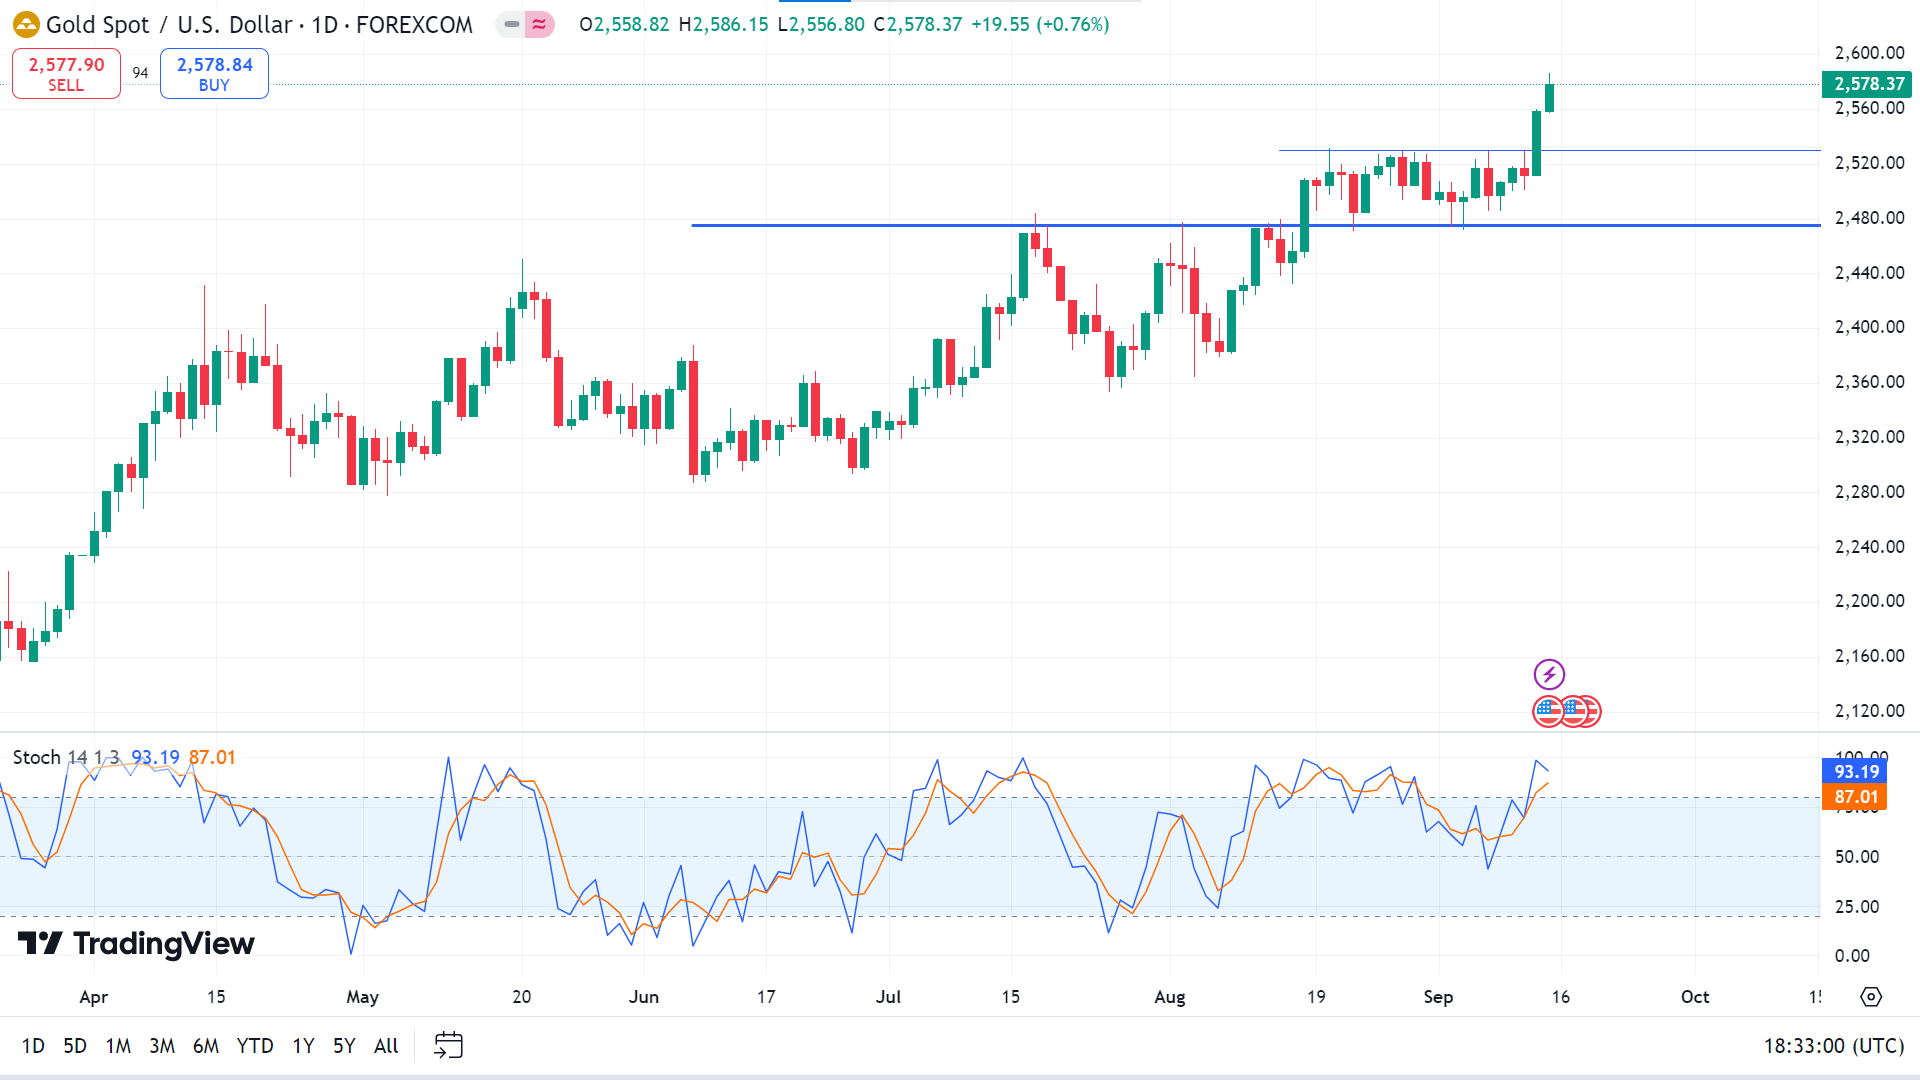
Meanwhile, the price is currently on an uptrend on the daily chart, as the dynamic lines on the indicator window move above the upper line on the Stochastic indicator window. Following the current context, the price may head toward the nearest resistance near 2,600.00, followed by the next resistance near 2,630.85.
On the other hand, the dynamic signal lines of the Stochastic indicator window reflect overbought, so a retracement is anticipated.
In that case, it will indicate that the price may decline toward the nearest support, near 2,530.00, followed by the next support, near 2,475.50.
Bitcoin (BTCUSD)
Fundamental Perspective
Bitcoin (BTC) has climbed 6% this week, with its upward trend likely to persist after successfully retesting the $56,000 support level on Wednesday. A push toward $60,000 appears possible in the coming days, driven by net inflows into U.S.-listed spot Bitcoin ETFs and a reduction in both BTC's exchange flow balance and supply on exchanges. However, the Federal Reserve's upcoming policy decision remains a key factor that could influence Bitcoin's performance alongside traditional markets.
Institutional demand supported Bitcoin's price this week. U.S. spot Bitcoin ETFs saw $140.7 million in net inflows across three days despite one day of outflows. This increase highlights a gradual rise in institutional interest. As a result, total assets under management (AUM) for these ETFs edged up from $48.33 billion to $49.55 billion.
On-chain metrics further support a bullish outlook for Bitcoin. Sentiments Exchange Flow Balance, which tracks BTC movement in and out of exchanges, dropped to -25,751 on Tuesday, indicating increased buying activity and reduced selling pressure. Similarly, the Supply on Exchanges index fell by 1.58%, from 1.89 million BTC to 1.86 million, as holders moved BTC off exchanges, signaling accumulation and reinforcing a positive outlook for Bitcoin.
Technical Perspective
The last weekly candle ended solid green, erasing losses from the previous weeks and leaving buyers optimistic for the next week.
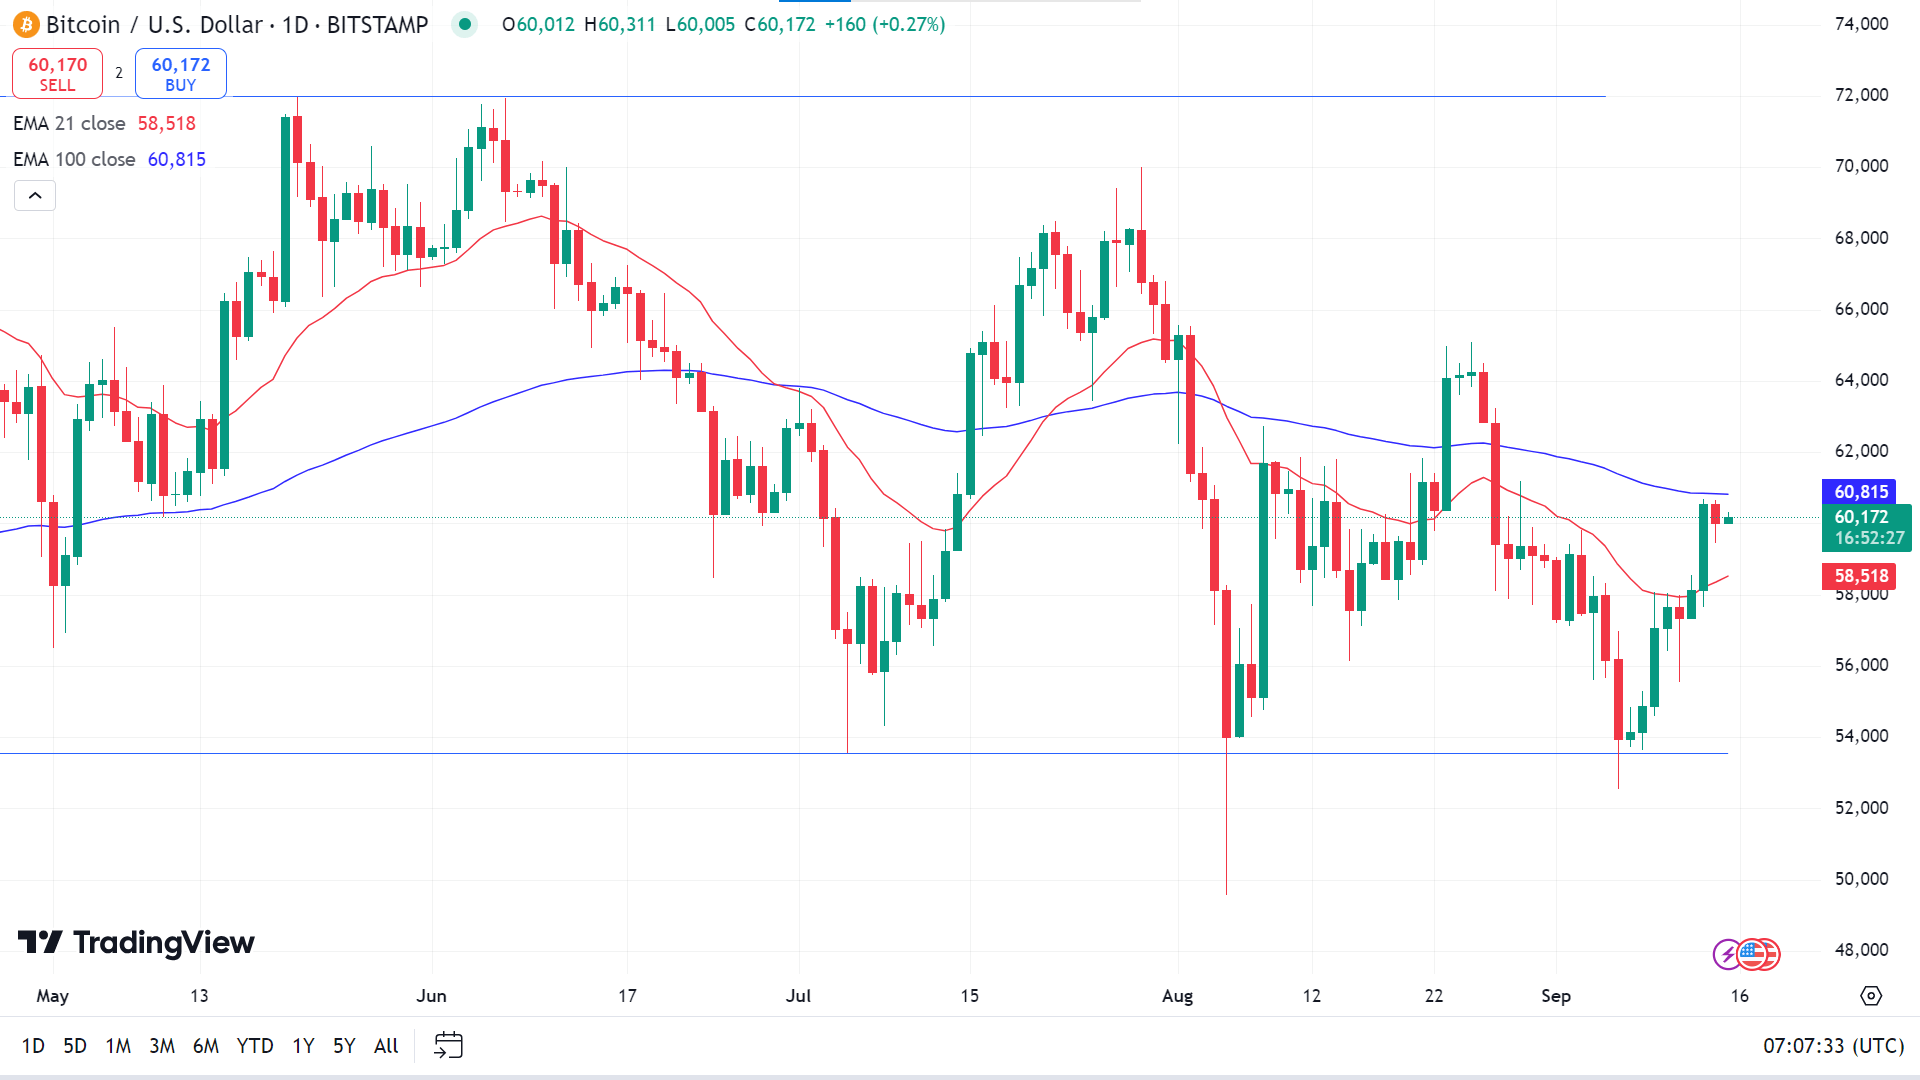
The price is floating between the EMA 100 and EMA 21 lines on the daily chart, reflecting a mixed signal for investors. In contrast, the EMA 21 line acts as a dynamic support, and the EMA 100 line acts as a dynamic resistance.
If the price gets above the EMA 100 line, it will indicate significant bullish pressure that may drive the price toward the primary resistance near 64,146, followed by the next resistance near 67,920.
Meanwhile, if the price declines below the EMA 21 line, it will reflect that the sellers are back on the asset, and the price may head toward the primary support near 56,482, followed by the next support near 53,550.
Ethereum (ETHUSD)
Fundamental Perspective
Ethereum (ETH) gained amid speculation that the SEC may have indirectly confirmed that the cryptocurrency is not classified as a security. This speculation arose following the SEC's settlement with eToro, which removed tokens identified as "investment contracts" but kept Bitcoin, Bitcoin Cash, and Ethereum available for trading. The exclusion of Ethereum from the delisted tokens led many to believe the SEC does not consider it a security.
However, despite the positive sentiment, Ethereum is seeing rising selling pressure. Hong Kong-based digital asset manager Metalpha contributed to this trend, depositing 6,999 ETH (valued at $16.4 million) to Binance, according to Lookonchain. Over the past six days, Metalpha has offloaded 62,588 ETH (worth $145.1 million), with an additional 23.5K ETH ($55 million) still in reserve, suggesting more selling could follow.
Additionally, net inflows to exchanges surged, with 91.4K ETH recorded in the last 24 hours, signaling heightened selling activity. Meanwhile, Ethereum ETFs saw modest outflows of $500,000, with Grayscale's ETHE marking two consecutive days of zero inflows for the first time since its launch. These factors suggest a cautious market outlook despite the SEC speculation.
Technical Perspective
The last weekly candle closed green but failed to recover significant loss, leaving sellers optimistic for the next week.
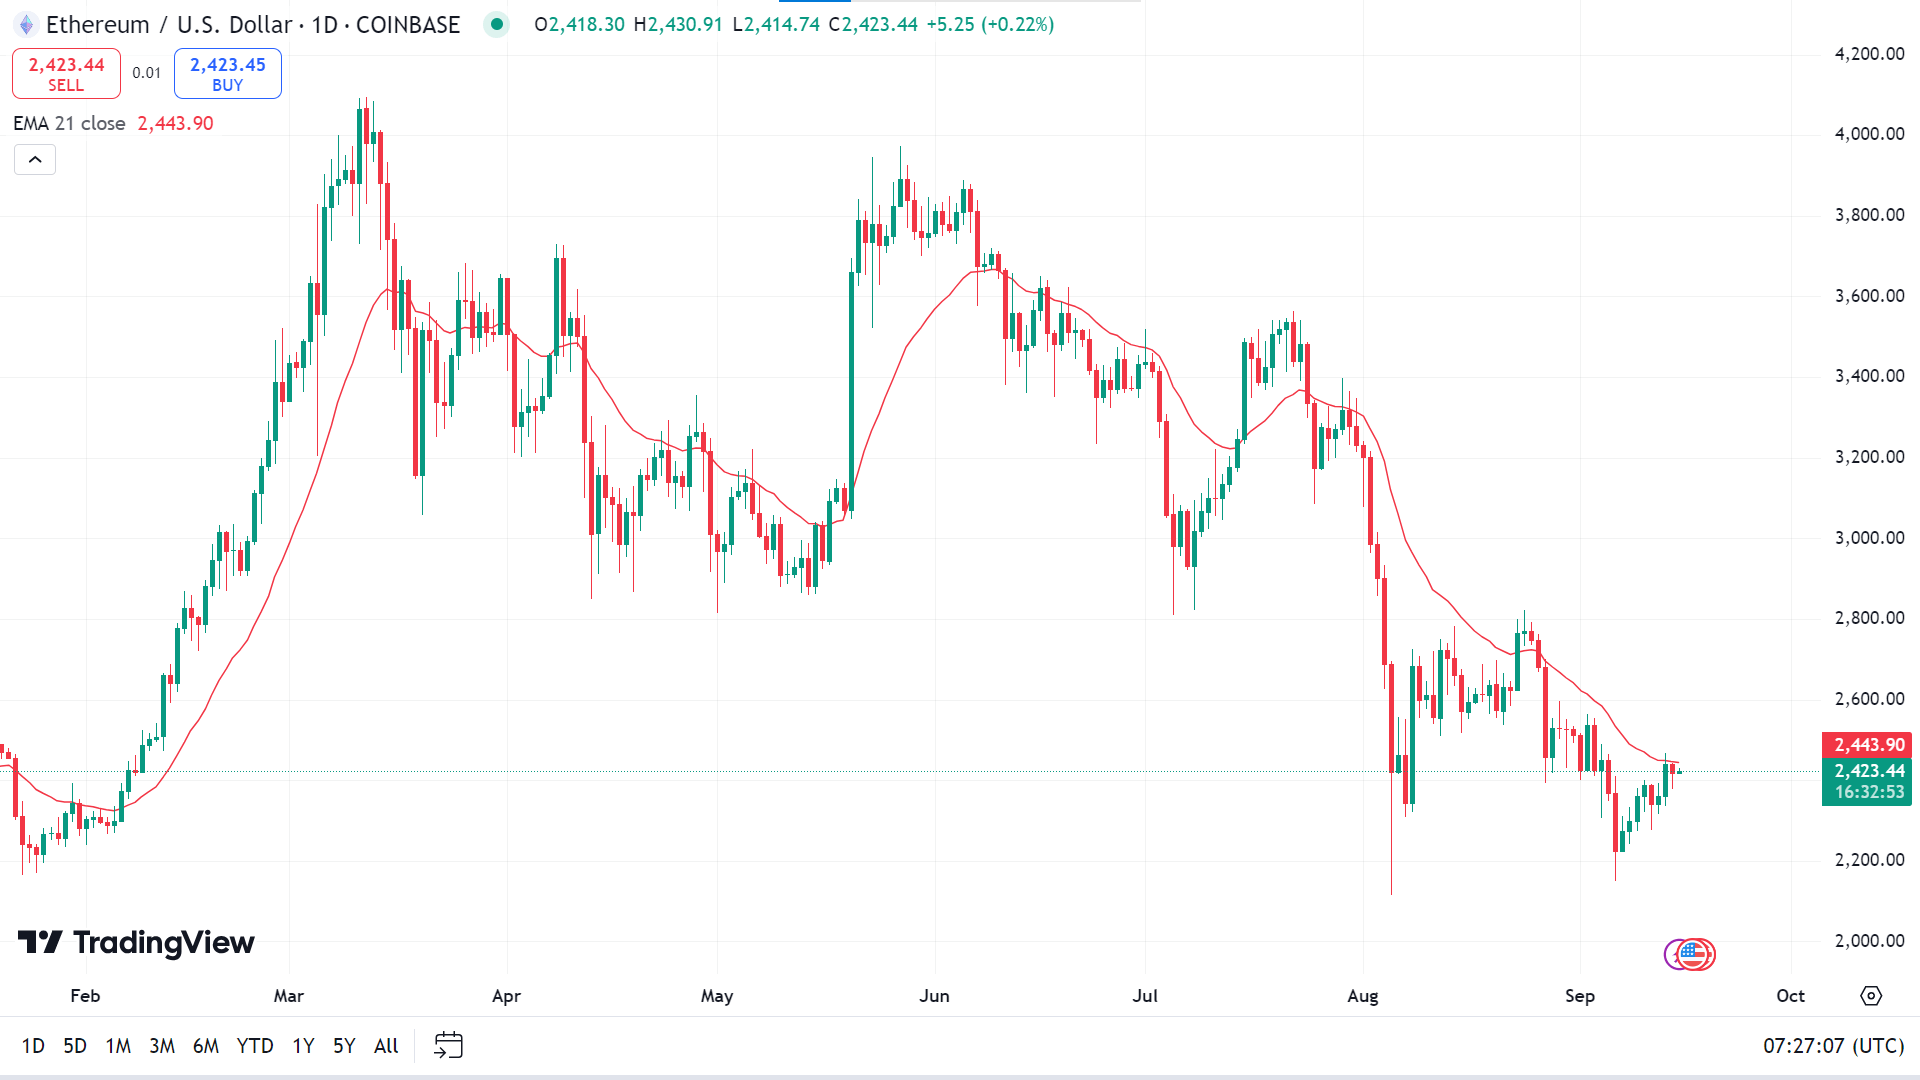
On the daily chart, the price floats along with the EMA 21 line. If the price exceeds the EMA 21 line, it can hit the primary resistance near 2,757.42, followed by the next resistance near 3,053.77.
Meanwhile, if the bearish pressure sustains and the price remains below the EMA 21 line, it can decline toward the primary support near 2,193.42, followed by the next support near 1,927.65.
Tesla Stock (TSLA)
Fundamental Perspective
Tesla, Inc. (NASDAQ), the world's largest electric vehicle (EV) producer, generated 84% of its revenue from EV sales as of Q2 2024. This heavy reliance on the EV market has made the company vulnerable to shifts in global demand. Over the past year, Tesla's stock has dropped 21%, influenced by rising interest rates, weakening consumer purchasing power, and intensified competition from China, all of which have strained the EV industry.
Despite these challenges, Tesla maintains key advantages. In 2023, it produced 1.85 million EVs, achieving significant economies of scale. Additionally, the company leverages 1.3 billion miles of autonomous driving data, enhancing its machine-learning capabilities. Tesla's energy storage division has also seen notable growth, with revenue doubling to $3 billion in Q2 2024. This growth helps cushion the impact of slower EV sales, positioning Tesla to manage short-term market fluctuations while maintaining a strong competitive edge.
Technical Perspective
The last weekly candle ended up solid green after an inverted hammer candle, suggesting buyers' domination on the asset price. This indicates the next candle might be another green one.
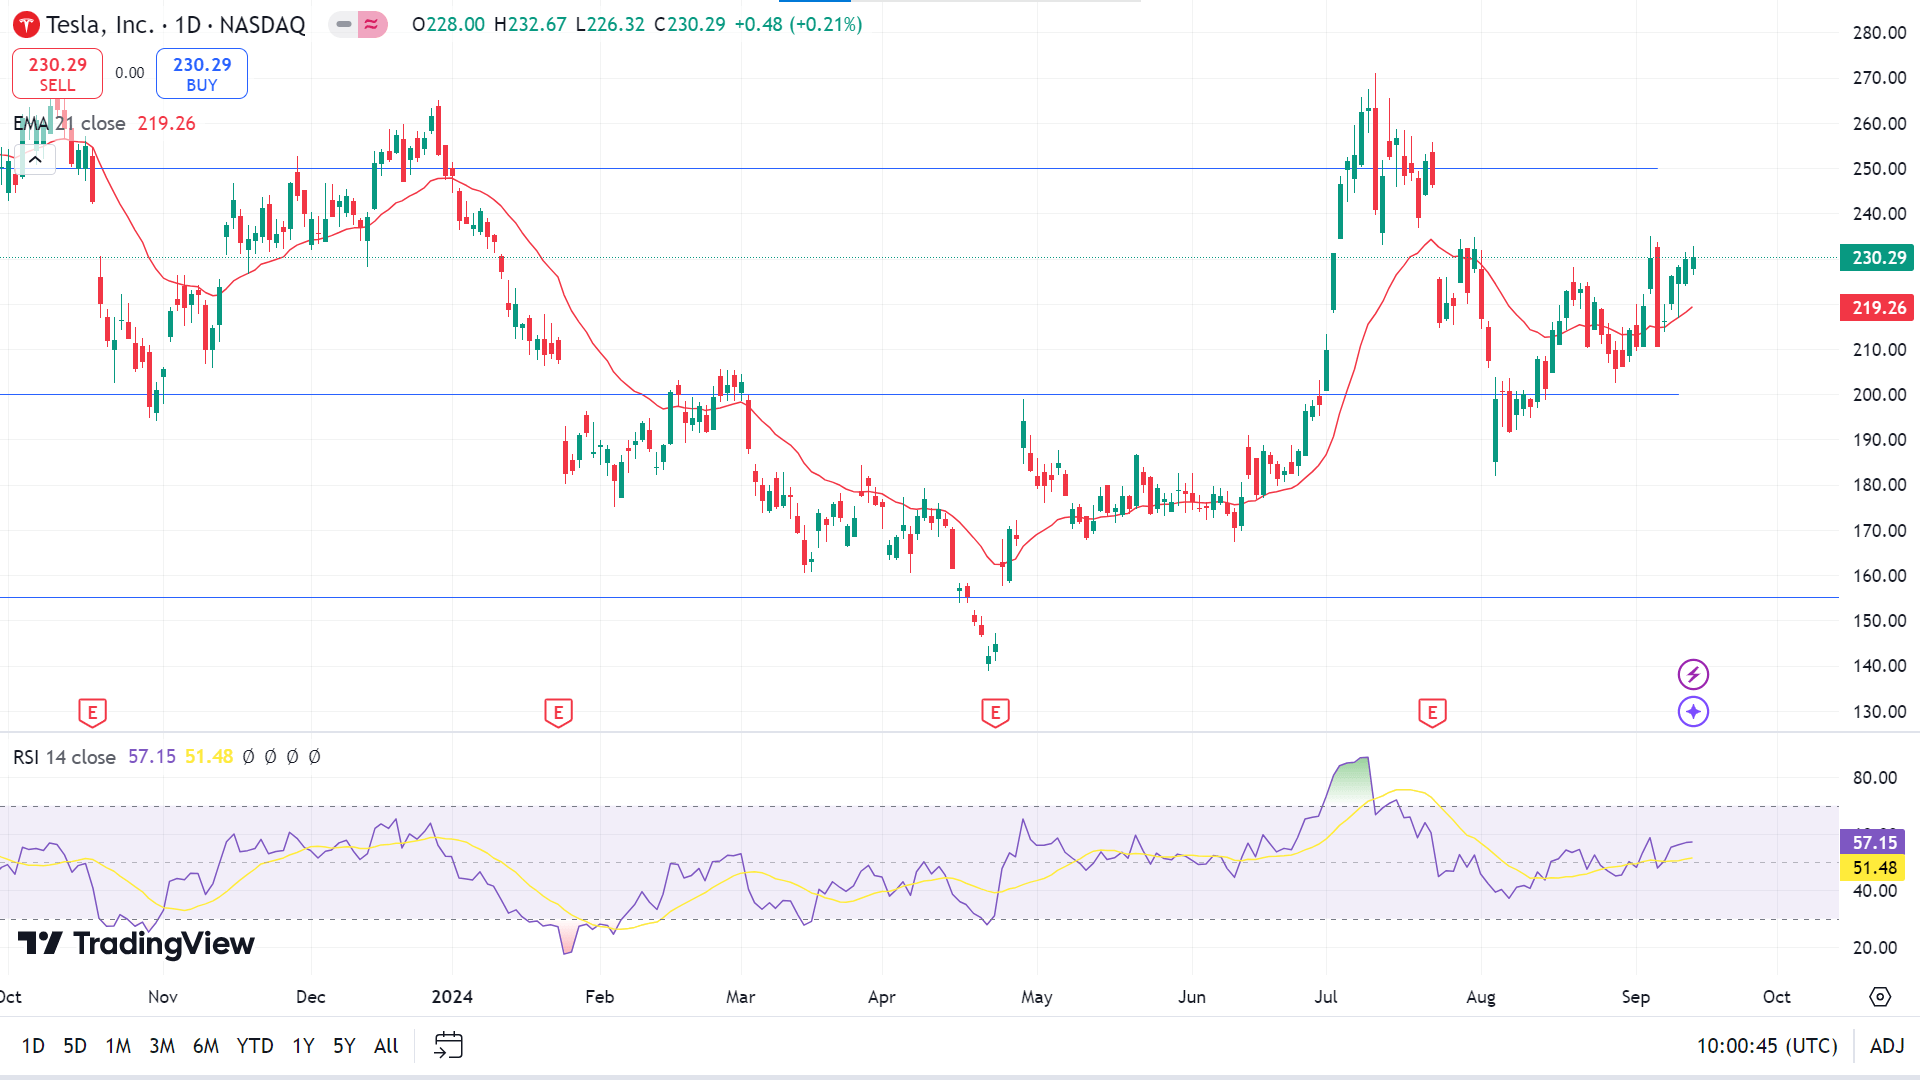
On the daily chart, the price moving above the EMA 21 line reflects bullish pressure on the asset price, while the RSI reading remains neutral, and the dynamic signal line is above the midline. So, if the bullish pressure sustains, the price might gain toward the primary resistance of 240.14, followed by the next resistance near 259.19.
On the downside, if the price declines below the EMA 21 line and the RSI dynamic line edges lower toward the lower line of the indicator window, the price can reach the primary support near 200.00, followed by the next support near 182.50.
Nvidia Stock (NVDA)
Fundamental Perspective
Nvidia's stock surged nearly 16% this week, marking one of its strongest recoveries of the year after a two-week slump that saw more than 20% of its market value wiped out. The recent decline was attributed to fading enthusiasm around AI and an earnings report that, while exceeding official estimates, failed to meet the high expectations of investors.
Despite this setback, analysts remain bullish on Nvidia, citing continued strong demand for its AI chips. Bernstein analysts reinforced their view, stating that Nvidia is “the best way to play AI,” and reaffirmed it as one of their top semiconductor picks.
Shares received an additional boost this week after CEO Jensen Huang spoke at a Goldman Sachs conference, highlighting the "incredible" demand for Nvidia's products and the vast market opportunities ahead. Concerns over a reported design flaw delaying the next-generation Blackwell system initially contributed to the sell-off. Still, analysts believe this delay will have minimal impact on sales, given the strong demand for Nvidia's chips.
The recent stock turbulence appears more connected to fluctuating market sentiment rather than any fundamental weakness in Nvidia's business, with investors taking advantage of the dip to buy shares.
Technical Perspective
The last weekly candle closed solid green, cutting losses from the previous weeks and leaving buyers optimistic for the next week.
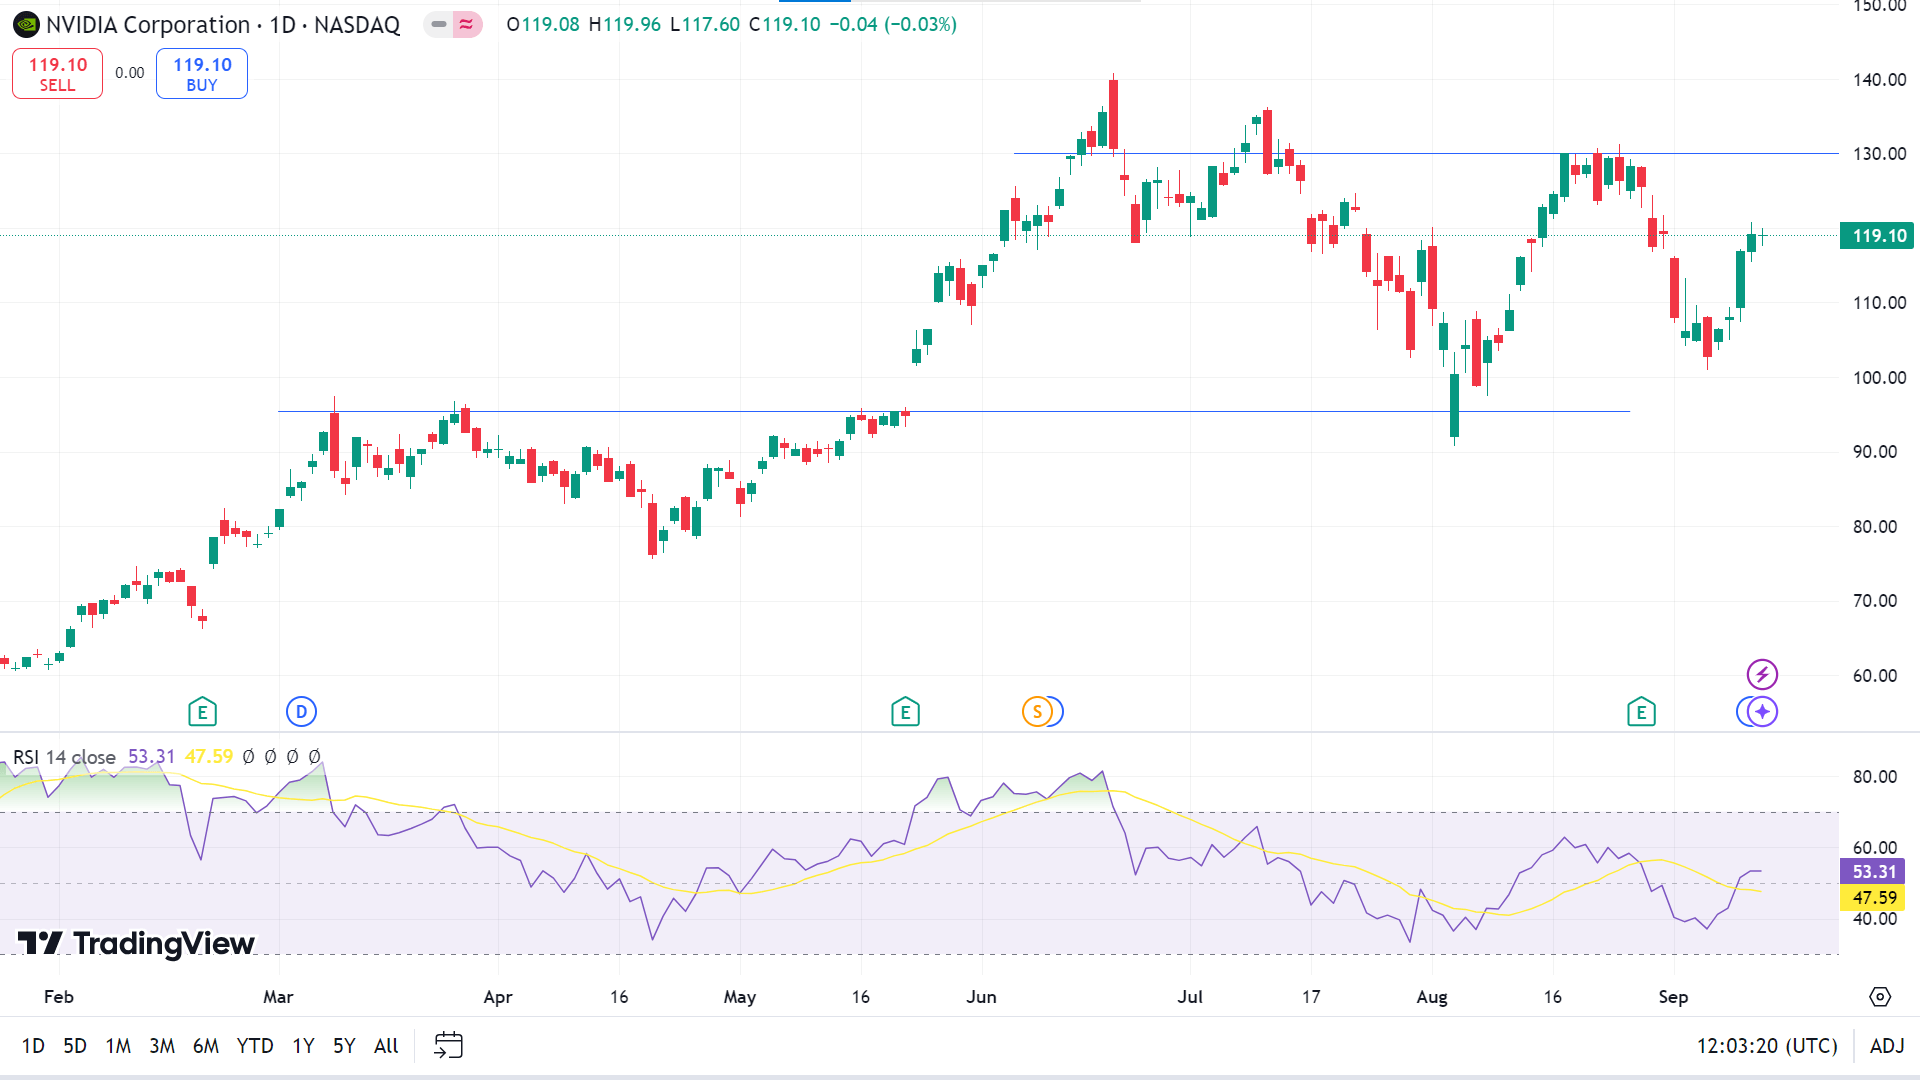
On the daily chart, the price is currently on an uptrend as the RSI indicator readings remain neutral, with the dynamic signal line above the midline of the indicator window. If the dynamic signal line of the RSI indicator window edges upward, the price can hit the primary resistance near 130.06, followed by the next resistance near 138.28.
Meanwhile, on the downside, if the RSI dynamic line edges toward the lower line of the indicator window, the price might reach the primary support near 108.33, followed by the next support near 101.80.
WTI Crude Oil (USOUSD)
Fundamental Perspective
A positive weekly close signaled three consecutive days of gains in WTI, forming a bullish "Three White Soldiers" pattern. Additionally, a bullish Hammer candlestick is developing on the weekly chart, indicating potential for a short-term recovery.
The rebound is fueled by growing hopes for a 50 basis point interest rate cut by the U.S. Federal Reserve at its upcoming meeting, along with expectations for significant mortgage rate reductions in China.
Lower interest rates tend to favor oil by reducing the cost of holding non-interest-bearing assets. In China, the largest global oil consumer, lower mortgage rates could help revitalize economic growth, increase demand for oil, and provide further support to prices. These factors combined are driving hopes for a continued recovery in WTI.
Technical Perspective
The last weekly candle closed with a small green body and a long lower wick, reflecting buyers' activities after many consecutive losing weeks, dimming hope for buyers for the next week.
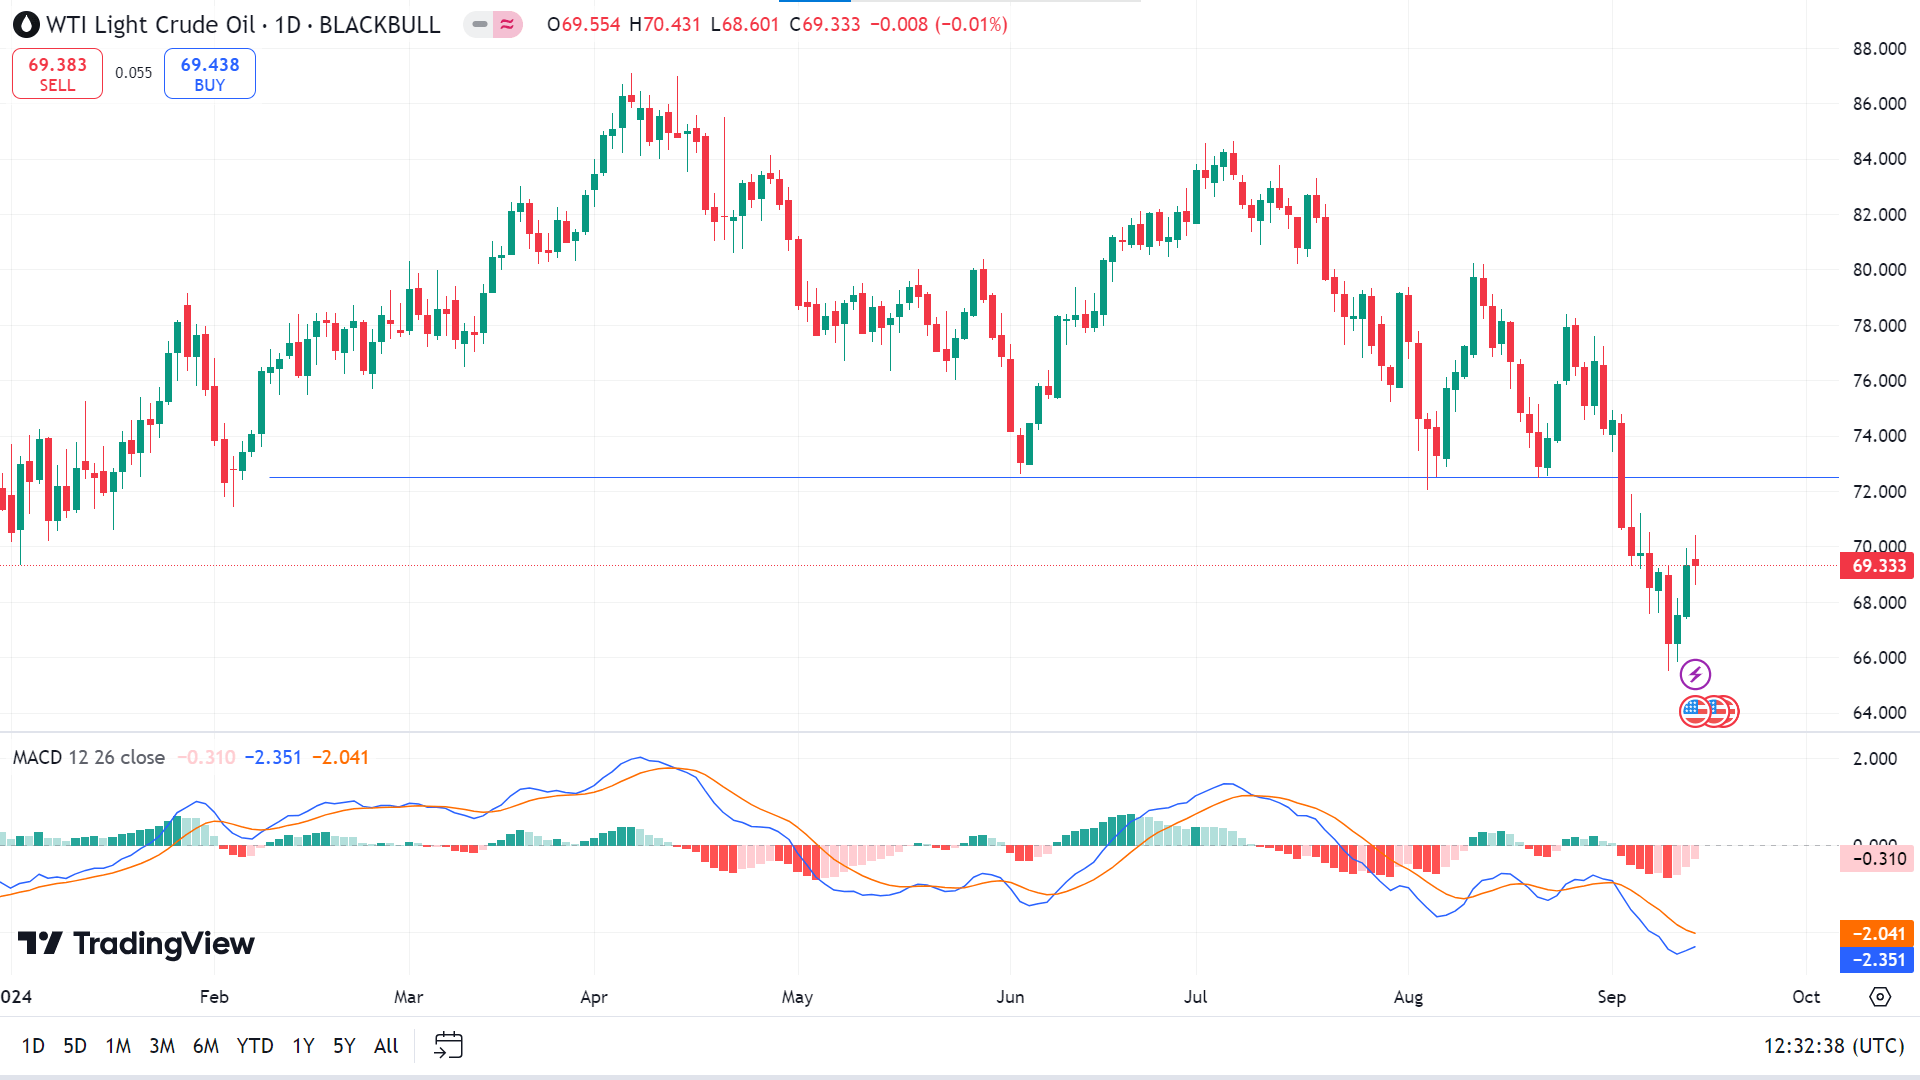
On the daily chart, the MACD indicator window confirms the bearish pressure on the asset price as the dynamic signal lines move below the midline of the indicator window and red histogram bars appear. So, the price might reach the primary support near 67.77, followed by the next support at 65.50.
Meanwhile, the red histogram bars of the MACD indicator window are fading, reflecting bears losing power, so any retracement from the current bearish trend can drive the price toward the primary resistance near 72.71, followed by the next resistance near 76.63.


