
欧元/美元(EURUSD)
基本面视角
随着交易周接近尾声,欧元/美元货币对处于相对稳定的位置,徘徊在交易者经常触及的1.0660水平附近。
美国采购经理指数(PMI)数据与预期有一定偏差,导致美元(USD)在周五交易时段小幅回撤。然而,这些损失仍被控制在盘中范围内。
同时,周五稍早公布的欧洲采购经理人指数(PMI)数据显示,欧元(EUR)在意外下跌后出现小幅回档。值得注意的是,PMI 的制造业部分为 43.4,低于预期的 44.0。在大西洋彼岸,美国 9 月制造业 PMI 超出预期,从 8 月的 47.9 升至 48.9。然而,服务业 PMI 成分回落至 50.2,低于市场预期,市场预期将升至 50.6。
技术视角
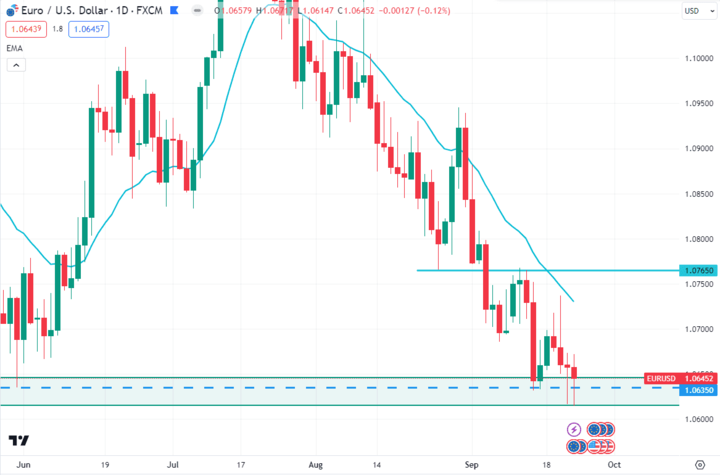
资料来源:tradingview.com
欧元兑美元目前交投于 1.0645 价格区域附近。在经历了冲动的看跌势头之后,价格在 1.0635 区域(2023 年 6 月的低点)附近找到了支撑。根据目前的价格走势背景,如果价格能够在 1.0635 支撑位上方收盘,那么欧元兑美元价格可能会向上回调至 1.0765 事件区域,然后在未来几天继续进一步下跌。
英镑/日圆(GBPJPY)
基本面视角
日本央行 (BoJ) 选择维持主要政策利率,维持现有的负利率制度 -0.1%。日本央行仍致力于实施稳健、宽松的货币政策措施,坚定决心将日本通膨率维持在 2% 以上。
目前,日本通膨徘徊在政策制定者目标范围的上限附近。然而,人们普遍预期日本通膨将在未来几个月大幅下降。因此,日本央行并不觉得有必要仓促扭转其负利率政策。央行倾向于维持这一立场,直到他们确信通膨将持续超过最低目标。
技术视角
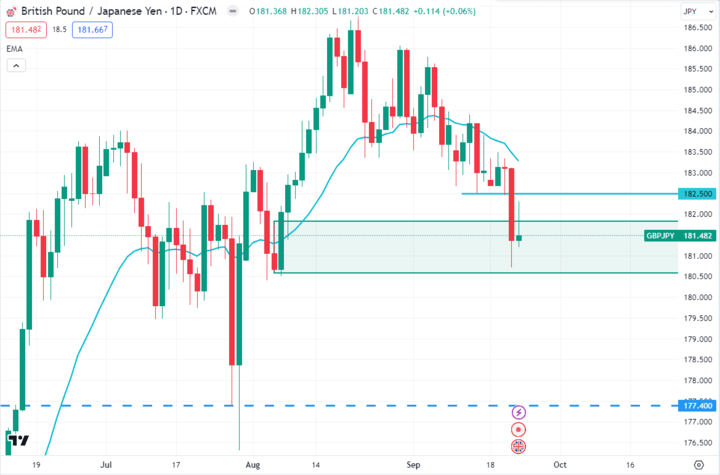
资料来源:tradingview.com
英镑兑日圆目前位于需求区域,即 180.60 - 181.80 区域。在跌破182.50支撑位后,空头将价格推低,但上周未能继续跌破需求区域。根据目前的情况,价格可能会回撤至182.500水平区域,那么如果我们发现任何冲动的日线看跌蜡烛收盘,我们可以在未来几天瞄准177.40支撑位。
纳斯达克指数(NAS100)
基本面视角
NAS100指数将维持一周走势。最近的数据显示,由于强劲的企业获利和强劲的经济数据,科技股指数一直走高。然而,对利率上升和全球供应链中断的担忧可能会带来一定程度的不确定性。
投资者应密切注意关键支撑位和阻力位,其中 16,000 美元是关键门槛。贸易谈判或央行决策的积极进展可能会提供上涨动力,而有关通膨或地缘政治紧张局势的负面消息可能会引发回调。 NAS100 未来一周的表现取决于经济指标和外部因素的微妙平衡,因此交易者必须保持敏捷并适应快速变化的市场状况。
技术视角
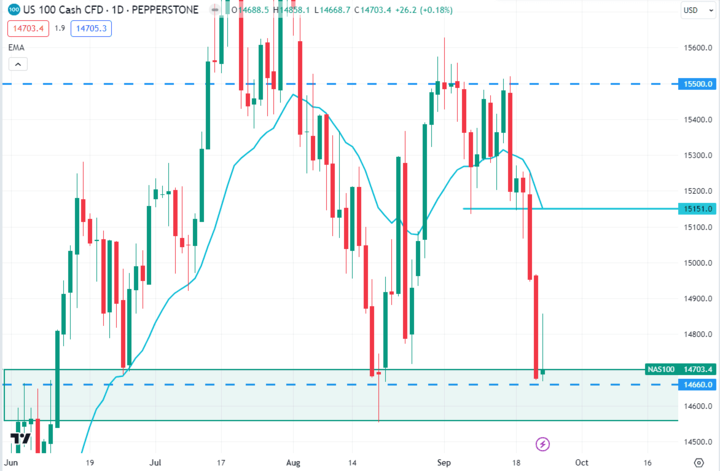
资料来源:tradingview.com
NAS100 目前的交易价格约为 14703.0 美元。经过上周的强劲看跌走势后,价格在 14,660.0 美元事件区域附近找到支撑。根据目前的价格走势,如果价格能够在 14660.0 美元支撑区域上方收盘,NAS100 可能会在未来几天向上回调至 15151.0 美元区域。
标普500指数(SPX500)
基本面视角
标准普尔 500 指数在混合讯号的背景下进入本周。最近的经济数据显示就业成长和企业获利具有弹性,增强了投资者的信心。然而,对潜在升息和通膨的担忧依然存在,这可能会削弱市场热情。
值得关注的关键水平包括 4,500 美元支撑位和 4,600 美元阻力位。货币政策方面的有利发展或积极的贸易消息可能会推动该指数走高,而与通膨或全球地缘政治事件相关的任何意外都可能引发短期回调。
SPX500 未来一周的表现将受到经济因素和外部事件之间微妙交互作用的影响。交易者在驾驭这个动态的市场格局时应保持警觉和适应能力。
技术视角
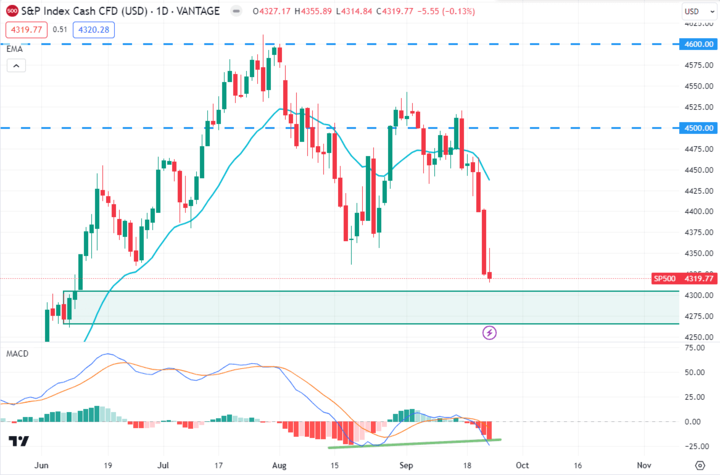
资料来源:tradingview.com
SPX500 目前在 4320.00 美元价格区域附近交易,并可能继续进一步下跌至 4305.00 美元 - 4265.00 美元需求区域。因此,如果价格继续进一步下跌至4305.00 美元- 4265.00 美元的需求区域,并随着D1 看涨蜡烛收盘而反弹,SPX500 多头可能会重新获得动力,并在未来几天再次将价格推向4500.00 美元的价格区域。
香港恒生指数(HK50)
基本面视角
2023年9月25日至9月29日,香港恒生指数(HK50)面临关键的一周,在乐观和不确定的背景下。最近的数据反映了香港经济的韧性,贸易数据强劲,零售销售复苏。然而,政治紧张局势和对全球供应链中断的担忧仍然存在,成为潜在的阻力。
需要监控的关键支撑位为 27,500 点,阻力位为 28,000 点。香港与中国关系的积极发展或国际贸易协定的进展可能会推动上升势头。相反,地缘政治紧张局势的任何升级或不可预见的经济挑战都可能引发市场波动。
HK50 未来一周的表现将受到经济指标和地缘政治因素之间微妙平衡的影响,交易者和投资者需要采取谨慎和灵活的态度。
技术视角
资料来源:tradingview.com
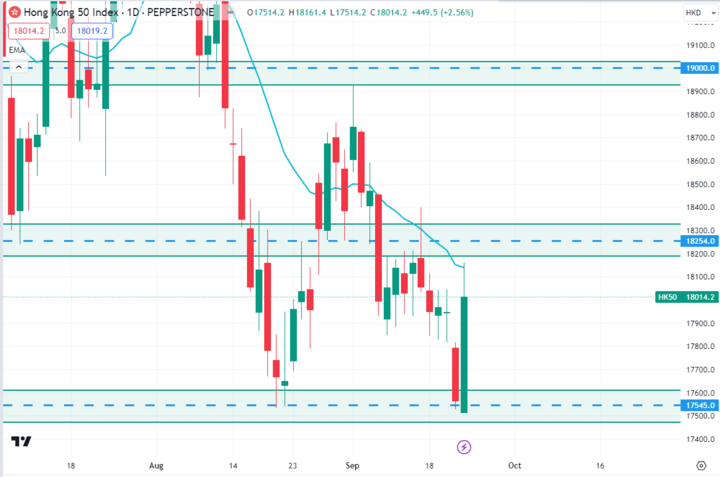
HK50 价格从 17545.0 美元的心理事件水平反弹,目前在 18014.0 美元的价格区域附近交易。根据目前的价格走势,价格可能会回升至 18254.0 美元阻力区域。因此,如果价格向 18254.0 美元的事件区域恢复走高,并以每日冲动的看跌蜡烛拒绝,空头可能会在未来几天将价格再次推向 17454.0 美元的区域。
比特币(BTCUSD)
基本面视角
比特币(BTC)即将迎来有趣的一周。最近的趋势表明,越来越多的机构采用数位资产,并持续转向数位资产作为通膨对冲工具。然而,监管发展是一个重要的变数,世界各国政府都在探索可能影响加密货币市场的政策。
需要观察的关键价格水准包括 45,000 美元的支撑位和 50,000 美元的阻力位。有关监管明确性或机构投资激增的正面消息可能会推动比特币走高。相反,任何不利的监管行动或不可预见的市场冲击都可能导致短期挫折。
比特币未来一周的表现可能会受到机构利益和监管动态的综合影响,这要求投资者在应对这一不断变化的情况时保持警惕和敏捷。
技术视角
资料来源:tradingview.com
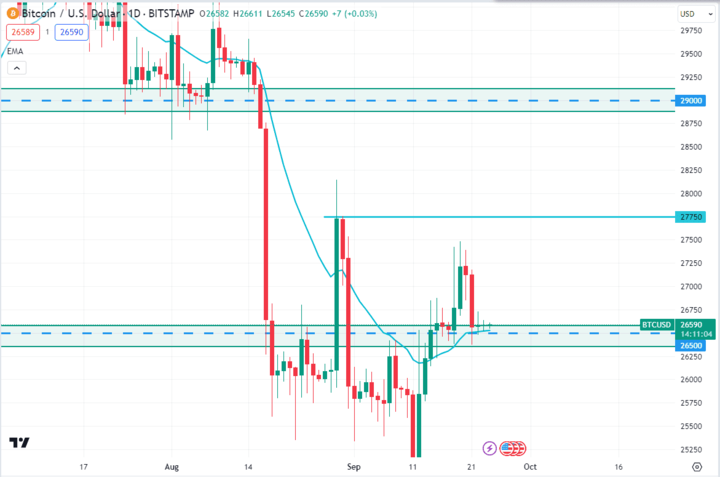
BTC 目前位于 26,597 美元的价格区域附近。在突破 26,500 美元阻力位后,价格回落至 20 EMA 的动态水平。根据目前的价格走势背景,如果价格能够以冲动的日线看涨蜡烛收于 20 EMA 动态水平之上,多头可能会继续其看涨势头,将 27,750 美元作为第一个目标。如果未来几天价格能够突破 27,750 美元的价格水平,第二个目标将是 29,000 美元的价格区域。
以太坊(ETHUSD)
基本面视角
以太坊在未来一周的表现将受到其不断发展的生态系统和技术发展的影响,因此交易者和投资者需要谨慎和知情的态度。以太坊(ETH)进入本周时既充满希望又谨慎。最近的发展表明,以太坊区块链越来越多地用于去中心化应用程序和智慧合约,增强了其长期潜力。然而,可扩展性问题和潜在的网络升级迫在眉睫,带来了不确定性。
值得关注的关键价格水准包括 3,000 美元的关键支撑位和 3,500 美元的阻力位。有关以太坊网络升级或 DeFi 和 NFT 采用增加的积极消息可能会推动 ETH 走高。相反,可扩展性挑战或市场波动可能导致短期价格波动。
技术视角
资料来源:tradingview.com
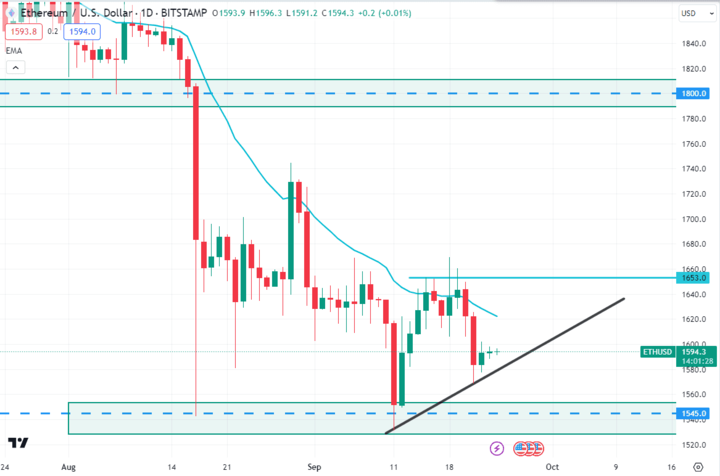
ETH 目前位于 1594.0 美元价格区域附近。上周,空头在拒绝 20 EMA 动态水平后推低价格,但未能继续跌破 1580.0 美元价格区域。根据目前的情况,如果多头进一步推高价格,并且每日看涨蜡烛收于 1656.0 美元价格水平之上,那么 ETH 可能会在未来几天继续其看涨势头,向 1800.0 美元的心理价格区域迈进。
特斯拉(TSLA)
基本面视角
特斯拉(TSLA)面临关键的一周,情况复杂。最近的数据凸显了特斯拉在电动车领域的领导地位及其向新市场的扩张。然而,供应链瓶颈和材料成本上涨给汽车制造商带来了挑战。
特斯拉未来一周的表现将取决于其克服营运障碍和利用创新的能力。在这个充满活力的市场中,投资者应保持警觉并适应。
技术视角
资料来源:tradingview.com
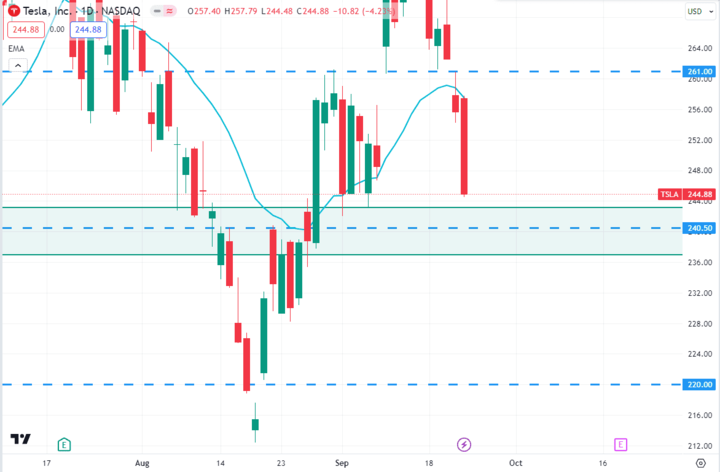
在跌破 261.00 美元的价格水准后,TSLA 目前的交易价格约为 244.88 美元。根据目前的价格走势,如果价格继续进一步下跌至 240.50 美元的支撑位,并以冲动看涨蜡烛反弹,多头可能会在未来几天将价格推向 261.00 美元的价格区域。相反,如果价格跌破 240.50 美元的支撑位并出现日线看跌蜡烛,空头可能会在未来几天继续进一步下跌至 220.00 美元的价格区域。
黄金(XAUUSD)
基本面视角
黄金(XAU/美元)本周可能会在混合力量的背景下开始。最近的数据显示,在全球经济不确定性和通膨担忧的情况下,贵金属作为避风港的吸引力。然而,潜在升息的预期仍然是一个重大变量,这可能会限制金价的上行潜力。
黄金未来一周的表现将受到其避险吸引力和利率动态之间微妙平衡的影响,需要交易者和投资者采取谨慎态度。
技术视角
资料来源:tradingview.com
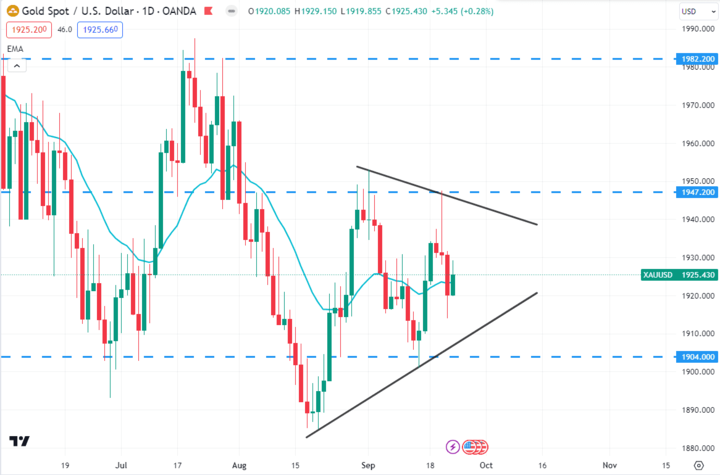
黄金在拒绝 1947.20 美元的事件水平后,目前交投于 1925.43 美元的价格区域附近。价格在日线图上形成了三角形形态,并按照其支撑位和阻力位进行交易。根据目前的价格走势,价格可能会继续往三角形形态的支撑位移动。因此,如果价格从三角形形态的支撑位反弹,并出现每日冲动看涨蜡烛,我们的第一个目标将是 1,947.20 美元的价格区域。此外,如果价格在未来几天能够突破 1947.20 美元的阻力位,我们的第二个目标将是 1982.20 美元的价格区域。
西德原油(USOUSD)
基本面视角
2023年9月25日至9月29日,原油(WTI)面临关键的一周,其特征是各种因素的复杂相互作用。最近的数据突显出,由于主要产油地区的供应中断和地缘政治紧张局势,全球石油市场紧张。然而,对经济成长放缓和向再生能源转型的担忧给需求蒙上了阴影。
需要关注的关键水平包括 70 美元的支撑位和 75 美元的阻力位。有关供应中断或地缘政治冲突的正面消息可能会推高油价。相反,强劲的经济成长或加速采用清洁能源的迹象可能会导致短期下降。未来一周石油的表现取决于供应限制和需求不确定性之间的微妙平衡,需要交易商和投资者保持警惕。
技术视角
资料来源:tradingview.com
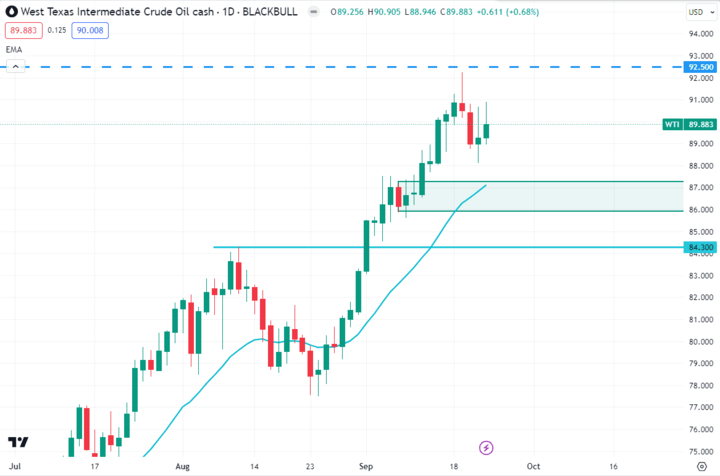
油价突破 84.30 美元关键水平,目前在 89.88 美元价格区域附近交易。根据目前的价格走势背景,价格可能会回撤至 20 EMA 的动态水平,该水平目前位于需求区域附近。因此,如果价格回撤至 20 EMA 的动态水平并以日线看涨蜡烛的形式反弹,多头可能会在未来几天继续进一步走高至 92.50 美元的心理价格区域。
*免责声明:本文内容仅供学习,不代表VSTAR官方立场,也不能作为投资建议。