


Momentum investing entails monitoring the recent upward or downward trend of the Shopify stock. When investors consider the term "long," they are essentially "buying high with the expectation of selling even higher." Capitalizing on price trends is crucial to this strategy; once a stock establishes a trajectory, it will probably persist in that course.
As an indicator of momentum, short-term price activity reflects the current level of interest in the stock as well as the buyer or seller dominance that was prevalent at the time. Additionally, identifying the highest-performing companies in a particular sector is facilitated by comparing a security to its industry.
Shopify Stock (SHOP) Leads the Industry
SHOP experienced a 5.93% surge in its share price during the previous week, surpassing the 0.13% growth in the industry average. SHOP is also advantageous from a longer-term standpoint, as its monthly price fluctuates by 7.3%, which exceeds the industry's 4% performance.
When longer-term metrics are taken into account, Shopify has exhibited significant growth, as evidenced by its 43.12% increase in the previous quarter and its remarkable 119.55% growth over the past year. On the contrary, the S&P 500 experienced a change of 24.22% and 9.99% during the corresponding time periods.
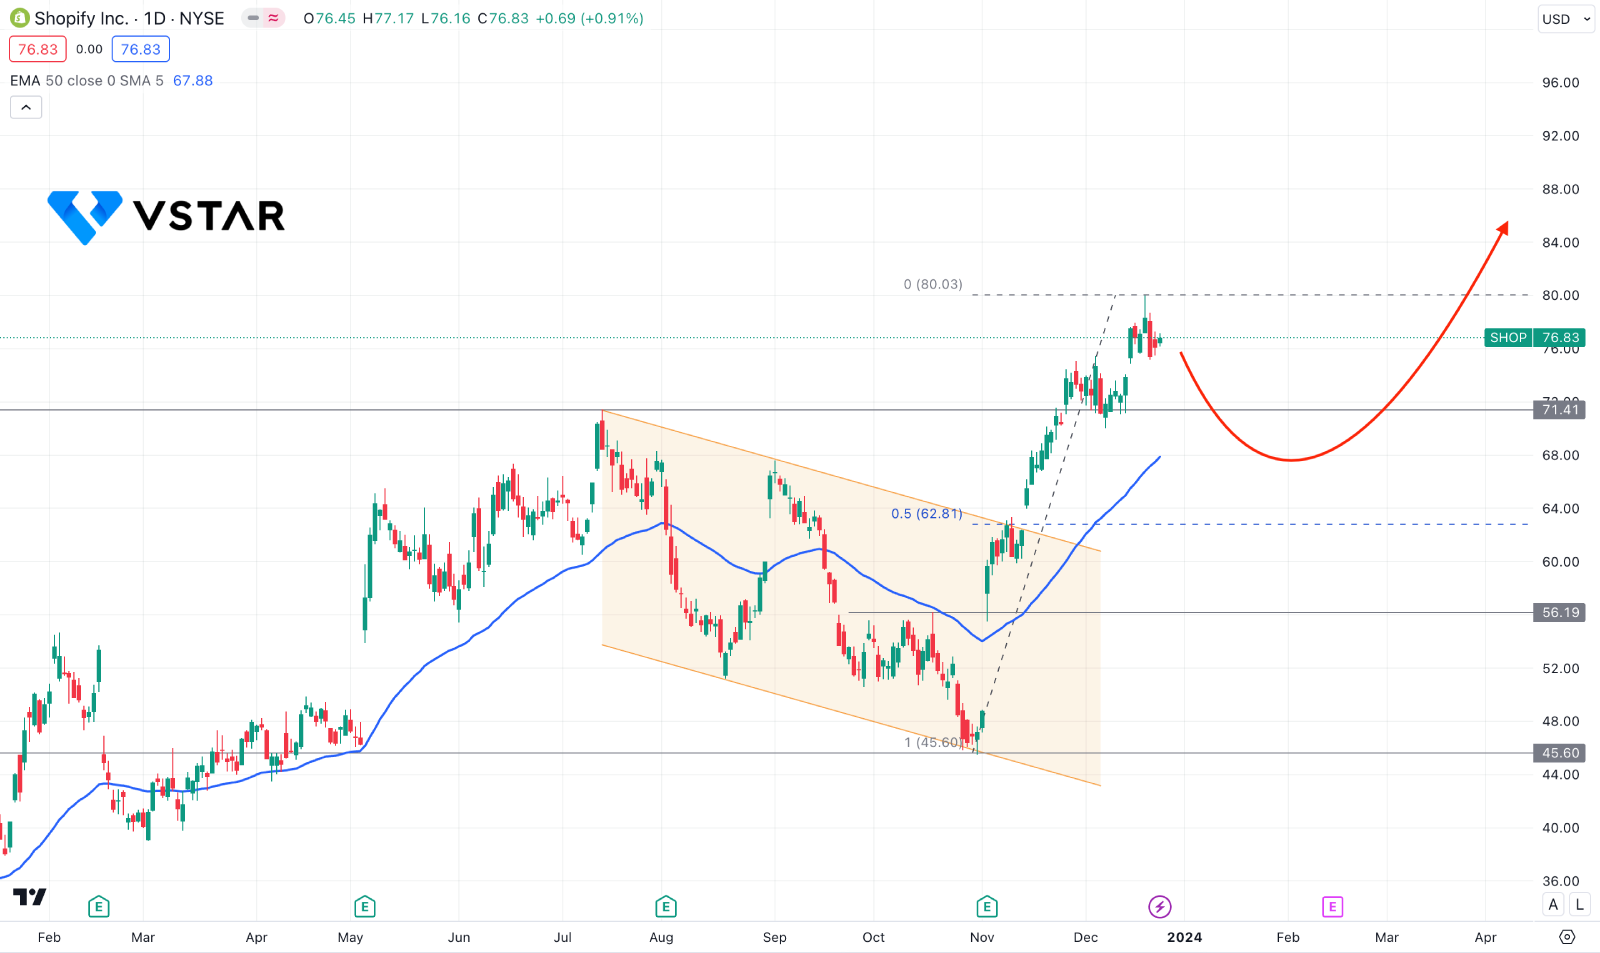
SHOP Stock Technical Analysis
In the daily chart of SHOP stock price, the overall market pressure is bullish, supported by an ongoing trend continuation from the descending channel breakout.

The upward continuation pushed the price at the overextended area above the 71.41 resistance level, which could be a short-term bearish opportunity, In that case, a selling pressure with a daily close below the 71.00 level could be a temporary short opportunity, targeting the 56.19 Fibonacci Retracement level.
However, any bullish rejection from the 63.00 to 48.00 discounted zone and a daily candle above the 20 DMA could be a decent long opportunity. In that case, bulls might make a new high above 80.03.


