


In U.S. trading on Thursday, Silver and gold prices increased marginally, expanding on this week's gains fueled by more moderate U.S. inflation data. The immediate technical prospects for silver in particular have improved with some chart-based purchasing interest in silver.
The Global Uncertainty Is Positive For Silver Bulls
The risk appetite of the market has escalated this week after the U.S. inflation figures, which may signify the culmination of the interest-rate-hike cycle. Furthermore, international intervention in the Israel-Hamas conflict has been minimal, resulting in the persistence of tensions.
Recent events include the meeting between Chinese President Xi Jinping and U.S. President Joe Biden at the APEC Summit. Both leaders recognised the crucial nature of collaboration, with Biden striving to mitigate tensions with China while upholding a resolute position. Moreover, Xi pursued export markets and foreign investment to mitigate the economic challenges facing China.
In order to avert a government shutdown in the US on Friday, Congress approved a stopgap funding measure that will fund the government through early 2024. With the assent of President Biden pending the bill, legislators can now make preparations for discussions regarding yearly appropriations.
US Continuing Jobless Claim Reached Multi-year High
The multi-year high in the jobless claim indicates that it is becoming more difficult for unemployed individuals to obtain new employment. The number of recurrent unemployment claims increased for the eighth consecutive week and reached 1.87 million in the week ending November 4.
Moreover, initial unemployed claims peaked at 231,000 for the week ending November 11, the highest level since August.
Besides, October's factory output declined further than anticipated, primarily due to a strike-related lull in activity at automakers and parts suppliers.
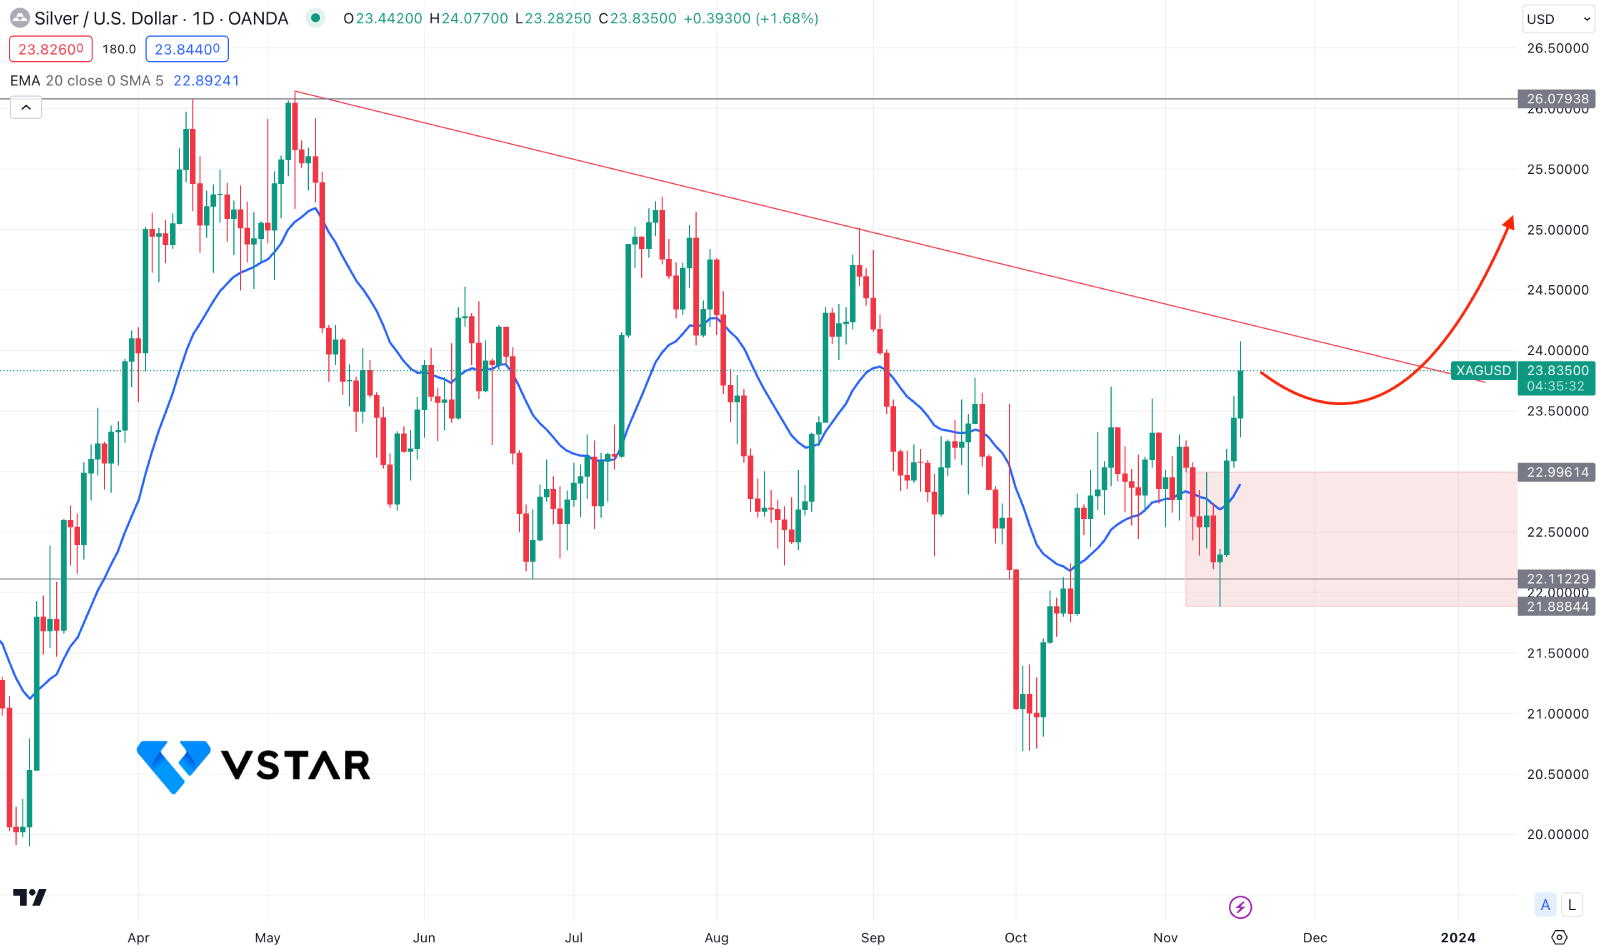
Silver (XAGUSD) Technical Analysis
In the daily chart of XAGUSD, the overall market momentum is corrective, where the sell-side liquidity sweep with an immediate rebound above the 22.11 support level indicates a strong buyers' presence in the market.

In the recent chart, the buying pressure has been seen from the dynamic 20-day EMA as a bullish daily candle is above this crucial dynamic level. However, the price is yet to test the long-awaited trend line resistance, where a bullish break could validate the bullish continuation.
Baked on the daily market outlook, a downside correction towards the 22.96- 21.88 demand zone could offer a long opportunity after a valid bullish rejection. Moreover, an immediate buying pressure with a stable market above the trendline resistance could open a long opportunity, targeting the 26.00 resistance.
On the bearish side, a sell-side pressure with a daily candle below the 21.50 psychological level could open a short opportunity, targeting the 20.00 low.


