Synopsys Inc. is an American electronic design automation company that offers some of the world's most advanced tools relating to silicon chip design, verifications, software security and IP integration. Usually, they supply their tools to the semiconductor design and manufacturing industries. Some of the products include tools for debugging environments and logic synthesis.
Recently, Synopsys Inc. released the financial report for their second quarter fiscal for 2023. The press release explained their first-quarter financial highlights and the projected financial growth for the rest of the year. They provided their financial targets for the third quarter of 2023; by October 2023, they expect their revenue to be between $5790 M and $5830 M.
Is Synopsys Inc. stock really worth investing in? In the last six to twelve months, Synopsys Inc. has performed well in that various analysts rate their stocks as a strong buy because of the following reasons:
● They have a rating of 96 which puts them near the top of the technology sector. Their score of 96 suggests that it ranks higher than 96 % of stocks in the industry.
● Their financial projections for the remaining quarters in 2023 show substantial revenue and share growth.
● There are projections that their earnings in the next few years should increase by over 80 %, which will lead to good cash flow and higher share prices.
Forecasts show that Synopsys should grow in earnings by 16.7 % and in revenue by 11.8 % yearly. Their Earnings Per Share (EPS) should increase by 16.3 %. Also, the return on equity should be 26.3 % in three years.
Synopsys Inc’s Overview

Source: Unsplash
In 1986, Synopsys Inc. got founded by Aart De Gus, David Gregory and Bill Grieger. The three founders initially established it in the Research Triangle Park in North Carolina as Optical Solutions and then changed it to the name Synopsys in 1987. The headquarters of the company is in Sunnyvale, California, U.S.A.
In 2006, Synopsys Inc. built a supercomputer using Linux servers and hardware to develop and run EDA applications with intense computational requirements. This computer made it to number 242 in the top 500 list. As of 2018, they partnered with PLANDU (People’s Liberation Army National Defence University) to train people in field programmable gate array design.
In 2022, they joined Intel’s US Military Aerospace and Government Alliance (USMAG), where they secure EDA tools and design services. In May 2023, they developed their first AI Synopysis.ai. It is a ‘suite of AI-driven solutions for the design, verification, testing and manufacturing of the most advanced digital and analog chips’.
With over 19,000 employees as of 2022, the company has the following segments: the engineering, legal, administrative, security, and marketing department, amongst others. The current CEO of Synopsys Inc. is Aart De Geus, who is also a co-founder of the company. He studied at Southern Methodist University, and in 2002, he received a recognition award for being among the 10 Most Influential Executives. In that same year, he was also given the award for CEO of the year by the Electronic Business Magazine. In 2007, he received the IEEE Robert N. Noyce medal for contributing to the technology and business development of Electronic Design Automation.
Synopsys Inc's Business Model and Products/Services
Source: Unsplash
Synopsis Inc. is a world-leading technology solutions provider. They provide electronics and electronic systems, and they supply EDA software that engineers use to design chips. You may be wondering how this company makes its money. Now, Synopsys Inc. makes money through the sale and licensing of various software and intellectual property solutions and professional services.
Synopsys operates a website at www.synopsys.com, through which customers look through the company’s services and solutions. They typically distribute their software products and documentation to customers electronically but also provide physical media if requested by the customer. Synopsys partners with various companies like Samsung, Intel Custom Foundry, Global Foundries and UMC, amongst many others.
Synopsys Inc's Financials, Growth, and Valuation Metrics

Source: Unsplash
In May 2023, Synopsys Inc. announced its financial result for the second quarter fiscal year 2023. They stated that for their second quarter, they had a total revenue of $1.395 billion, GAAP (generally accepted accounting principles) earnings per diluted share of $1.76 and non-GAAP earnings per diluted share of $2.54. In comparison with their second fiscal year of 2022, wherein they had a total revenue of $1.28 billion, GAAP earnings of $1.89 and non-GAAP earnings of $2.50.
At the beginning of June 2023, Synopsys Inc. had a market capitalization of $63.86 billion, giving their market cap a 46.64 % increase in one year. Between 2017 and 2022, Synopsys Inc.'s market cap grew from $10.75 billion to $50.16 billion. The quarter which ended in April 2023, registered that Synopsys Inc.'s net income was $0.921 billion, an 8.72 % decline from the last year. The net income for 2022 was $0.99 billion, which was a 29.98 % increase from 2021. They also had a profit margin of 17.41%.
The company’s annual revenue for 2019 was $3,361 million, and that of 2020 was $3.685 billion, a 9.66 % increase from 2019. In 2021, the annual revenue was $4.204 billion, a 14.8 % increase from 2020 and in 2022, it was $5.08 billion, a 20.87 % increase from 2021. In the twelve months that ended on April 30, 2023, the revenue totalled $5.288 billion, which was an 11.2 % increase year-over-year. Synopsys Inc.'s revenue for the quarter that ended on April 30, 2023, was $1.395 billion, a 9.04 % increase year-over-year.
In 2021, they had an operating cash flow of $1.397 billion, a 67.78 % increase from the previous year. In the quarter that ended on April 30, 2023, their cash from operations was $792.79. Synopsys Inc.'s key financial ratio and metrics as of April 30, 2023, are:
● Current ratio: 1.15
● Debt/equity ratio: 0.0
● Price to earnings rate: 70.75
● PS ratio: 10.7
Recent forecasts show that Synopsys will grow in earnings and revenue by 16.7 % and 11.8 % per annum, respectively. Currently, Synopsys stock, in comparison with its most prominent peers, is significantly overvalued.
SNPS Stock Performance
Source: Unsplash
Synopsys Inc. went public in February 1992 and began trading on the NASDAQ exchange as SNPS in the American Stock Exchange in New York City. As of June 28th, 2023, SNPS stock is worth $427.53, a 0.18 % increase from the previous trading day. Synopsys Inc. stock trades in U.S. dollars and follows the trading hours from 9:30 am to 4:00 pm. The stock also has pre-market and after-market trading sessions that extend from 4:00 to 9:30 a.m. and from 4:00 to 8:00 p.m., respectively.
Since its inception, Synopsys Inc., has had two stock splits. The most recent stock split occurred on the 24th of September in 2003. It was a two-for-one split, meaning for each share of SNPS owned pre-split, the shareholder now owned two shares. Their first stock split happened on September 11, 1995, and was also a two-for-one split. As of June 2023, NASDAQ: SNPS has not started paying its shareholders dividends.
Currently, Synopsys stock is a strong buy with 79 %, 14% buy, 7 % hold, and 0 % sell, which means that this is a good time for investors to buy their SNPS stock. Synopsys stock's implied volatility (IV) is 23.1, which is in the 2% percentile rank.
Three main things drive the price of SNPS stock; they include their earnings, news and dividend worth and valuation.
● Earnings
Knowledge about the company’s earnings is essential when deciding whether or not to buy any company's stock. It gives investors an idea of how much the company can generate in terms of earnings over some time. This is the major metric that traders and investors use to check how volatile the stock is.
● News and Dividend Worth
News about the company on its performances at different stages in the year can affect the price of its stock. How much a company's dividend is worth is also a significant value in deciding whether or not to invest in their shares. An increase in its rating can lead to a rise in its stock price, while a decline in the rating can lead to a reduction in the stock price.
● Valuation
How well-valued a company is in its industry can affect the change in the price of the stock. If there is a current drop in the valuation, it will have an effect on the stock of that particular company.
From the 12-month price targets for Synopsys in the last three months, the average price target for Synopsys Inc. is $458.15 (high: $505.00 and low $410.00). This puts the average price target at a 7.10 % change from the last price of $427.77. Predictions from analysts show that by the end of 2023, Synopsys stock will be worth $473.73, and by 2028, it will have increased and be worth $1947.43.
Challenges and Opportunities

Source: Unsplash
Synopsis Inc. being a top-tier company and a lease in the industry is ranked number 10 out of 84029 competitors. In terms of market capitalization, revenue, total assets, and even stock prices, very few companies do better than Synopsis Inc.. Some of the company’s major competitors in their industry include Cadence design system, Infosys, Happiest Minds, Globant, UST. Some of their major competitors in terms of stock price include Palantir Technologies, Adobe Inc, Marathon Digital Holdings, Salesforce Inc., Zoom Video, Digital Turbine, and Unity Software. In comparison with its competitors, SNPS has 4.1 out of 5 based on over 3400 reviews.
Some other risks or challenges of Synopsys include; impact of chip industry cycles, pace of tech changes, high customer concentration, economic downturn and growth stock volatility risks. Synopsis Inc.'s risk distribution is: 30 % tech and innovation, 22 % macro and political, 19 % finance and corporate, 15 % legal and regulatory, 7 % production and 7 % ability to sell.
Demand from autonomous vehicles and 5G continues to rise as Synopsys is now global leader in EDA and IP solutions with clients like Qualcomm, NVIDIA and SMIC. The forecasts for Synopsys Inc have a median target of 450.00, with a high estimate of 505.00 and a low estimate of 410.00. The median estimate represents a +2.84% increase from the last price of 437.57.
Traders who want growth and increase in their portfolio would want to consider looking into Synopsys before trading their shares. Synopsys' earnings over the next few years are expected to increase by 83%, indicating a highly optimistic future ahead. This should enable higher cash flow which will feed into a higher share value.
In Comparison with Zoom Video which focuses on user communication, Synopsys Inc. uses very advanced tools in silicon chip design, verifications, and software security. This gives them a wider reach in the technology market in the world at large.
When compared with Adobe Inc., which focuses on the computer softwares and video/ picture editing, Synopsys Inc. deals in the security of these softwares and their verifications. This allows Synopsys to work with some of the same users of Adobe Inc.
Trading Strategies for SNPS Stock
Trading SNPS stock profitably requires that you have an idea of what the historic price movement has been. This will also help you pinpoint or determine what to expect from the market. So let’s briefly consider SNPS key support and resistance levels.
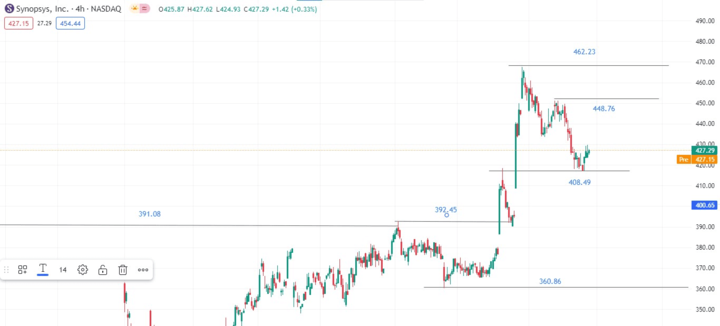
SNPS Key Support and Resistance Levels
Source: TradingView
A look at SNPS stock’s TradingView chart shows that the stock is currently in a bullish movement. A long-time high around the 391.08 level was taken out and a new high of 392.45 was briefly set before a price dip to the 360.86 level. Price then went on another bullish run to set a new high around the 408.49 level before dipping back to the 392.45 level. The former resistance point (392.45) served as support for the subsequent bullish run that set the new 462.23 high.
After that, price dipped back to the 408.49 level, using it as a support before rebounding upwards again. SNPS stock price is currently hovering around the 427.29 level with the closest resistance at 448.76. If price gathers enough momentum to break this resistance then the 462.23 resistance level will be the next target.
Profit Strategies For SNPS Stock
When it comes to trading SNPS stock, most traders and investors prefer to use technical analysis. This is unsurprising after all, there are several benefits to employing this trading approach for SNPS stock. Some technical analysis approaches you can employ to trade SNPS stock include the following:
Moving Averages: Moving averages are very useful indicators for identifying potential trade entry or exit points. Usually, traders use a combination of two different moving averages (50 and 200) to create a confluence and identify buy and sell points.
From the chart below, when the 50 MA line crossed above the 200 MA, price started a bullish movement. This movement signals an entry point for people looking for a buy position and a zone to close trades for those who have been bearish all along.
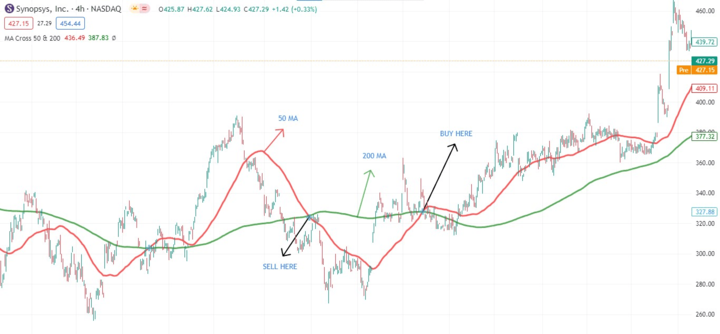
Source: TradingView
Momentum Indicators: This includes using indicators like Relative Strength Index (RSI) or Moving Average Convergence Divergence (MACD). For RSI (the indicator in the chart below), when the volume crossed above the 70-mark, that was an indication that price is overbought, and so price began a retracement. On the other hand, when the volume dipped below the 30-mark, it signaled that price was oversold, and a reversal took place subsequently.
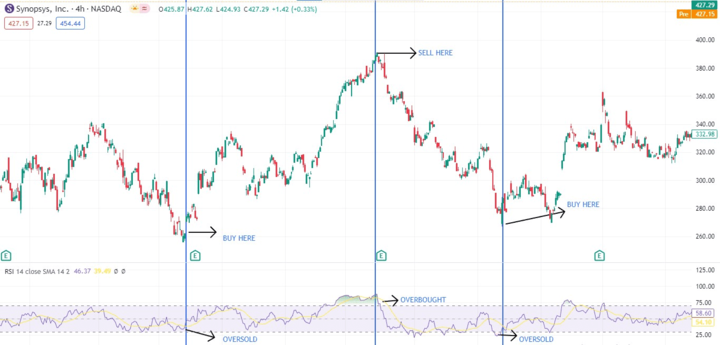
Source: TradingView
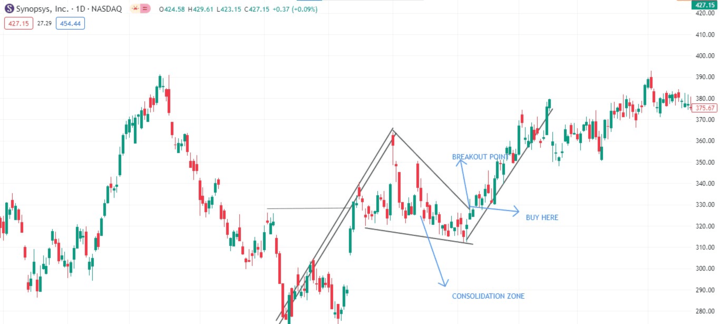
Chart Patterns: You can also leverage tell-tale chart patterns when trading SNPS stock to maximize your profits. These chart patterns provide valuable information on when to enter and exit trading positions.
A classic example is the falling flag setup in the chart below. Here, price consolidates downwards briefly during an uptrend before breaking out of the consolidation and continuing the uptrend.
Source: TradingView
Trade SNPS Stock CFD at VSTAR
Trading Synopsys stock CFDs with VSTAR has a lot of advantages for traders and investors. VSTAR is a secure trading platform that is available globally, it has a user-friendly interface which can be used easily by both beginners and experienced traders. VSTAR helps beginner traders as the minimum amount you need to begin a trade using the app or website is $50.
To trade Synopsys Inc. stocks CFDs with VSTAR:
-Download the VSTAR app and register for an account.
-Add funds to your account using one of the payment methods supported and recognized by VSTAR, such as Visa, Mastercard, Tether, Skrill, Neteller, SticPay, or Perfect Money. The minimum deposit you can make is only $50.
-Choose an option you want to trade and open a buy or sell position depending on your market view. You can decide to set up a stop loss to take profit orders and help you manage risk and reward.
-Identify what trading strategy you plan to use
-Monitor your trade and close it when you want to lock in your profit or loss. You can also catch real-time trading opportunities by using the market feature.
-You want to know the best part, you can withdraw your funds whenever you wish by using the same payment method you used to make your initial deposit.


Conclusion
Synopsys stock is a good investment strategy for new and developed traders. It’s a great portfolio addition and a great investment opportunity that should be looked into. In this article, investors and traders get an extensive study into the Synopsys Inc. brand and their stock. It discusses the overview, financial growth, and Risk factors. It also contains the stock performances and Key metrics that investors and traders should know before buying the stock.
The article also talks about the advantages of trading a CFD and how to trade using VSTAR. To learn more about CFD trading or start trading Synopsys Inc. CFDs with VSTAR, visit www.vstar.com or download the VSTAR app today!