


The surge in activity surrounding meme coins has increased trading volumes on the Solana blockchain, an alternative to Ethereum that offers superior capital efficiency.
Solana's Activity Surpassed Ethereum
In the past week, activity on decentralized exchanges based on Solana has been greater than on their Ethereum counterparts.
As a result of this frenzy, Solana has surpassed Ethereum as the dominant smart contract blockchain in terms of trading volume.
Trading volume on Solana-based decentralized exchanges increased by 67% in seven days, reaching $21.3 billion. In contrast, Ethereum-based exchanges experienced a comparatively moderate 3% growth in volume, amounting to $19.4 billion during the same time frame.
Solana is home to seventeen decentralized exchanges, of which control 88% of the total volume, while Ethereum is home to forty-six DEXs led by Uniswap.
Why has Solana's Activity Increased?
It would appear that speculative interest in meme coinage such as dogwifwhat, bonk, book of the meme, and self-propelled Solana to prominence. According to the most recent data, Solana tokens have dominated the DEX Screener's top trending list for the past twenty-four hours.
On March 13, 2,300 meme coins were created in a single hour due to the intense speculative fervor, and the supply of stablecoins on Solana reached a multiyear peak of $2.80 billion.
As cited by Reflexivity Research, the increase in Solana's volume is ascribed to many factors. These factors encompass the proliferation of points programs and airdrops, exemplified by the Solana DEX Jupiter.
The DEX volume-to-total value locked (TVL) ratio is emphasized in a recent report commissioned by the Solana Foundation as evidence of Solana's superior performance compared to Ethereum. Solana has commenced to significantly outpace Ethereum in terms of this ratio, which signifies that its ecosystem operates with a greater degree of efficacy.
Solana (SOLUSD) Technical Analysis
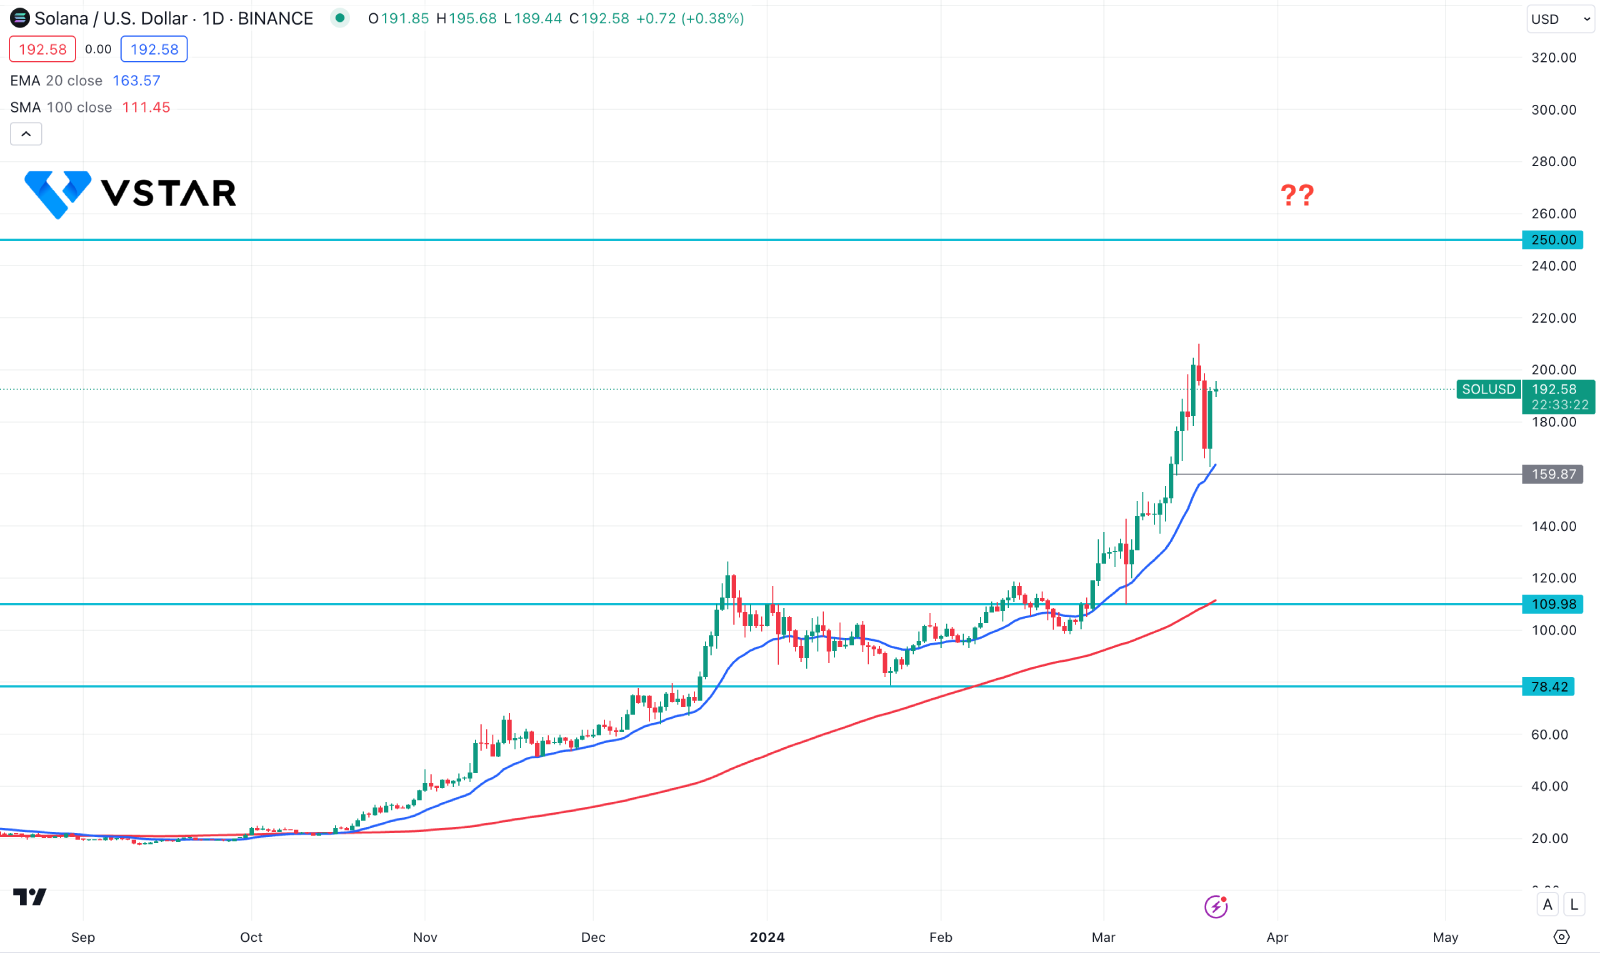
In the daily chart of SOL price, the overall market pressure is bullish as the dynamic 20-day EMA shows bullish pressure from the near-term support area.
Moreover, the ongoing buying pressure has come with a range breakout from the 109.98 to 78.42 zone, which signals a confluence bullish factor. The dynamic 100-day Simple Moving Average is also below the current price and working as a major support line.
Based on the daily outlook, a bullish continuation is potent in this pair, where the main aim is to test the 250.00 psychological line. However, a downside correction is possible, where a bearish daily candle below the 159.00 level could extend the downside correction toward the 120.00 area before forming another bullish signal.


