


A new trading week has started with downside pressure on major tech stocks. Also, the US equity followed the trend by moving further down. In particular, the 10-year treasury yield has lost 5% of its value for the first time in 16 years. However, a rebound was seen within the US trading session, which limited the loss for the crucial index.
The current selling pressure came after the 2.4% loss in a week for the S&P 500. The current price hovers at the critical trading range of 4180 to 4200 area. Therefore, further downside pressure should come with a massive selling pressure below this level before reaching the 4000 area.
Currently, the 12-month P/E ratio is at 17.7 level, which is above the 10-year average of 17.50 but below the 5-year average of 18.70.
Investors Await Crucial Economic Events
Several large-cap companies like Intel (NASDAQ: INTC), Exxon Mobil (NYSE: XOM), General Motors (NYSE: GM), and others are set to release earnings reports this week. Currently, the earnings are expected to come 1.2% higher in Q3 for S&P 500 stocks.
Besides, the tension in the Middle East could be another event to look at as Lebanon joined the conflict in the Southern area.
On the data front, the key event for this week will be the US Gross Domestic Product (GDP), which is expected to show a 4.2% increase in Q3. Also, the personal consumption expenditure (PCE) could provide a clue about the inflation gauge.
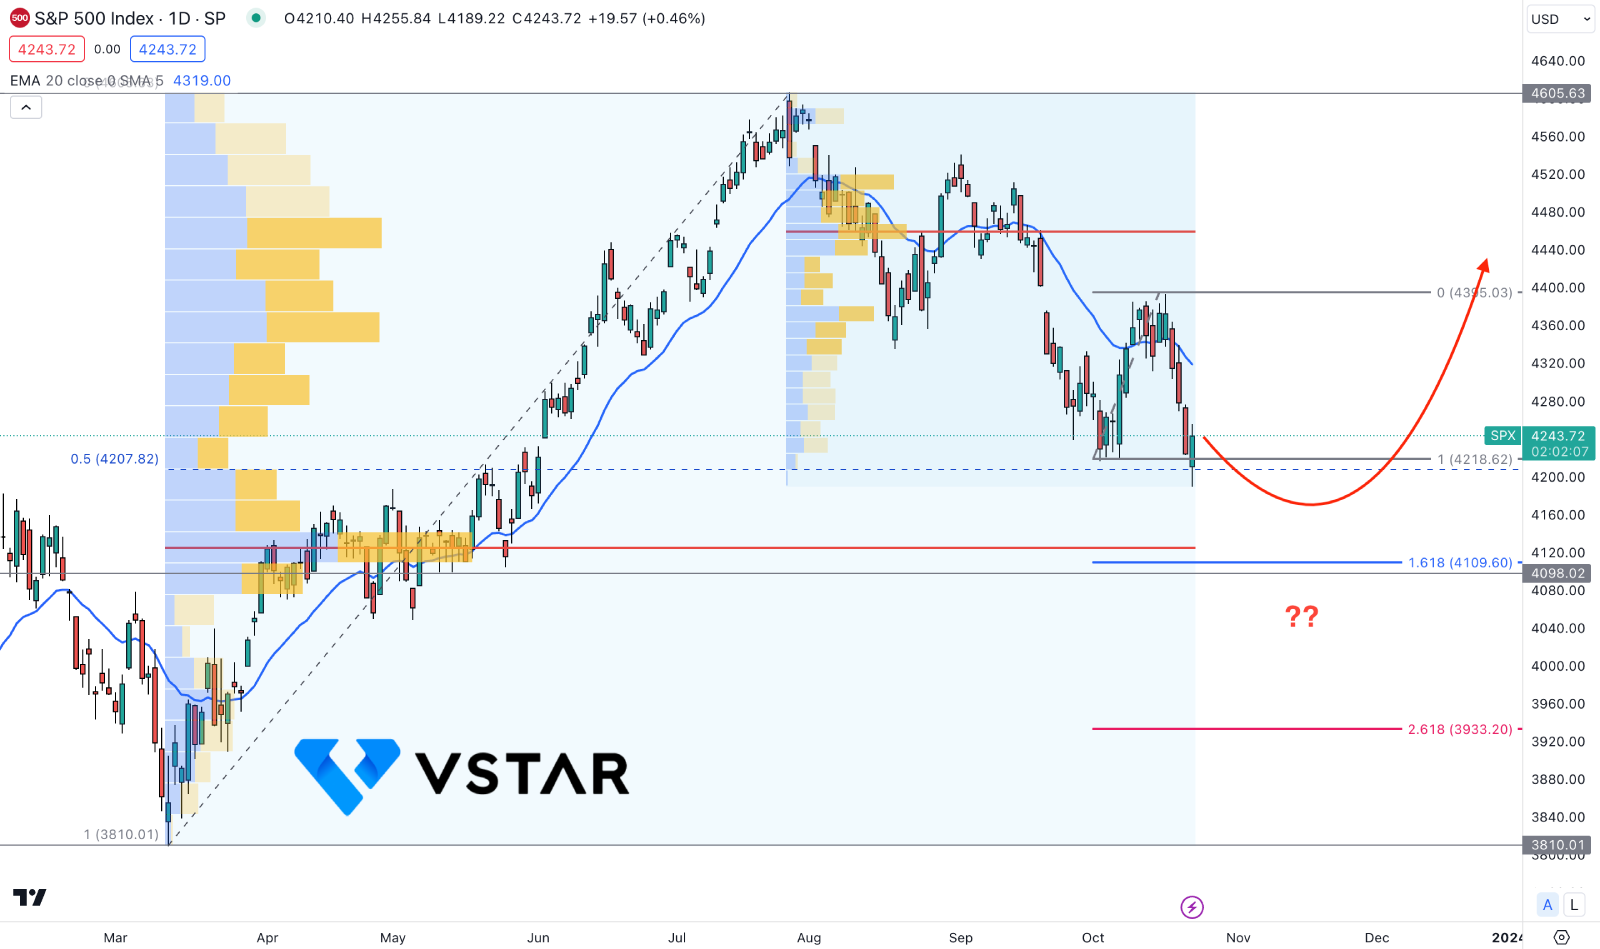
S&P 500 (SPX500) Technical Analysis

In the daily chart of the SP500, the current price is trading at the 50% Fibonacci Retracement level from the 3810- 4605 area. Therefore, a bearish pressure below the 4218 level could extend the downside momentum at the critical discounted zone, from where a bullish reversal could happen.
On the volume structure, the largest volume level since the March 2023 low is at the 4125 level, which is just above the 4109 level, which is a crucial Fibonacci Extension level in the October 2023 swing.
On the bullish side, an extended downside pressure towards the 4100 to 4000 congestion area could offer a long opportunity after a valid bullish reversal. However, an immediate buying pressure with a D1 close above the 20-day EMA could offer an alternative buying opportunity.
On the bearish side, a deeper correction towards the 4000 level is needed before aiming for the 3810 support level.


