


On Tuesday, the tech-heavy Nasdaq and the benchmark S&P 500 posted their largest daily percentage gains over six months. It was bolstered by consumer price data that was weaker than anticipated, which increased optimism that U.S. interest rates may have reached their apex.
The CME Group's Fedwatch tool indicates that money market traders have entirely factored in the Fed's probability of maintaining rates unchanged in December. In addition, they anticipate the first rate cut of the cycle to commence in May 2024.
Producer Price Index (PPI) Came As A Blessing To Stocks
As measured by the PPI, the pipeline inflationary pressures are extremely weak, with headline producer prices declining 0.5% MoM versus the consensus estimate of +0.1.
This indicates that the annual producer price inflation rate has decelerated from 2.2% to 1.3%, while the core rate is now 2.4% instead of 2.7%. The fact is that wage growth appears to be decelerating with rising productivity growth. It is a strong sign that inflation will begin to consistently observe 2% YoY readings in the second quarter of 2024. This would enable the Federal Reserve to implement interest rate cuts in response to any eventual economic weakness.
In other news, the unemployment claim is the crucial data to look at, where the current projection is 221K, which is higher than the 217K in the previous report. The better-than-expected report might shake the stock market on the downside, but a stable price direction might come from FOMC Members' speeches.
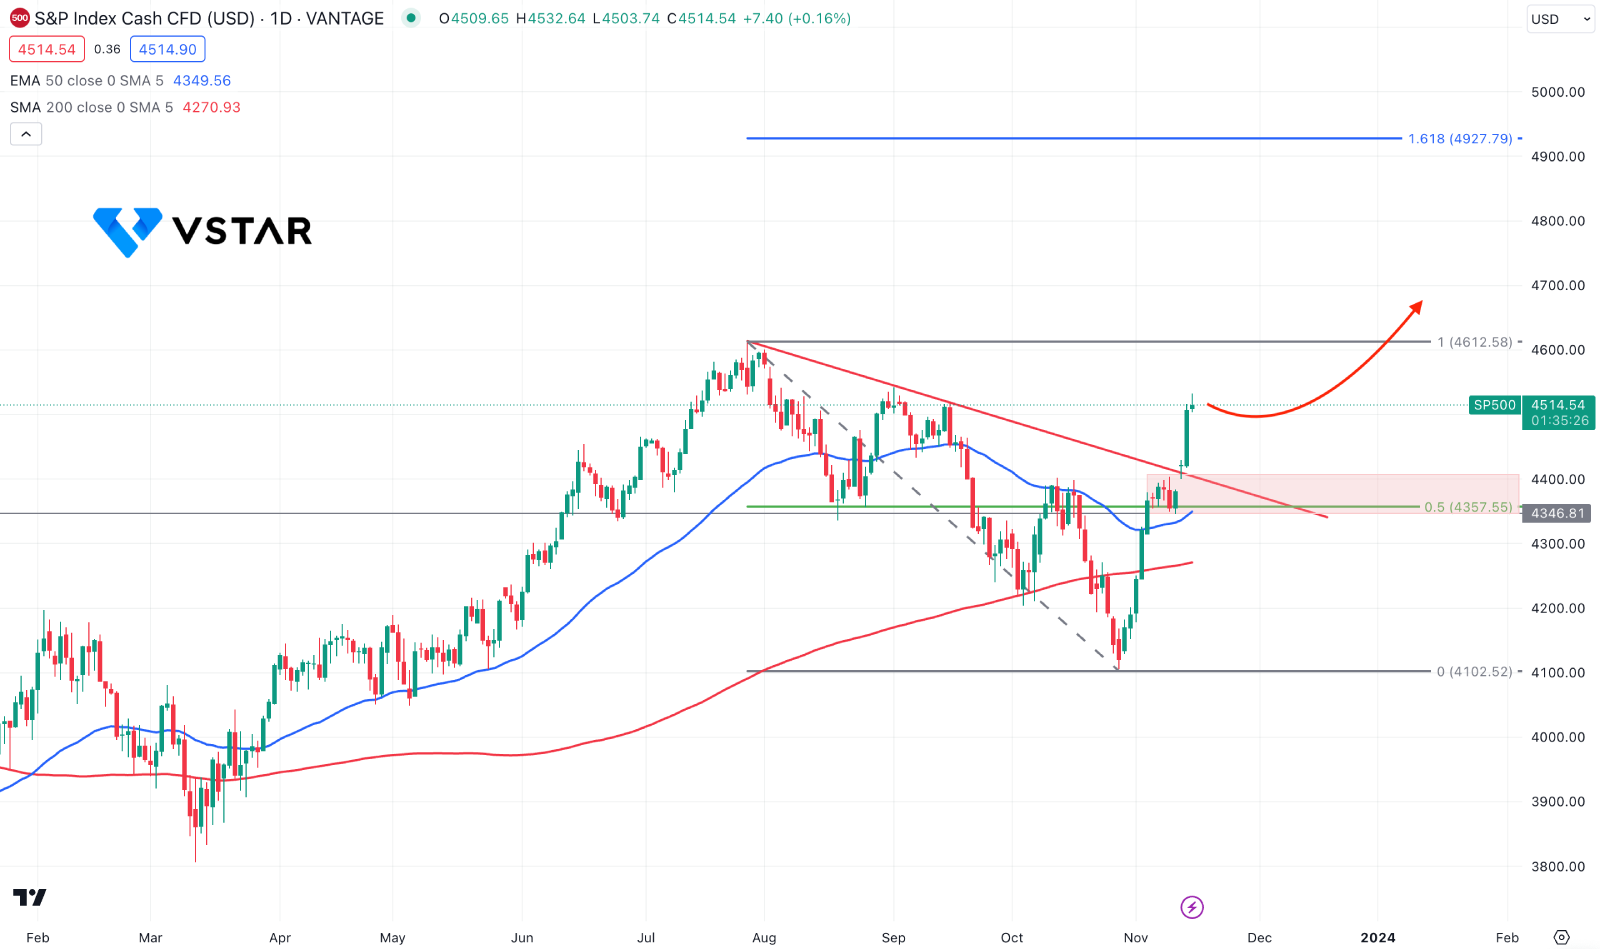
S&P 500 (SPX500) Technical Analysis
In the daily chart of the SP 500, a bullish trendline breakout came with confluence support from the 50-day EMA. Moreover, the dynamic 200-day SMA is below the critical 4346.81 static level with an upward slope.

If we draw the Fibonacci level from the 4612.58 high to the 4102.52 low, it shows the 4927.79 level as the 161.8% Extension level. As the recent price remains stable above the 4400.00- 4346.00 demand zone, we may expect the SP500 price to reach the 4927.00 level in the coming days.
On the other hand, a deeper correction is possible towards the dynamic 200-day SMA, but a break below the 4200.00 psychological level could be a short opportunity, where the main aim is to test the 4000.00 level.


