Introduction
Tencent stock has been a stellar performer in the past decade, delivering over 1,000% returns to its shareholders. However, in recent months, the stock has faced some headwinds due to regulatory crackdowns, rising competition, and slowing growth in some segments. Is Tencent stock still a good buy at its current price? What are the growth prospects and risks for Tencent in the future?
Tencent Holdings Ltd’s Overview
Tencent was founded in 1998 by Ma Huateng (also known as Pony Ma), Zhang Zhidong, and four other partners in Shenzhen, China. The company started as an instant messaging service provider with its flagship product QQ. In 2004, Tencent went public on the Hong Kong Stock Exchange under the ticker 700.HK.
Since then, Tencent has expanded into various online platforms and services, such as WeChat, Tencent Games, Weixin Pay, Tencent Cloud, and Tencent Video. It has also acquired or invested in many other companies, such as Riot Games, Epic Games, Supercell, Huya, Douyu, and Kuaishou. Today, Tencent is one of the most valuable companies in the world, with a market capitalization of 428.31 billion as of July 2023.
Tencent’s current CEO is Ma Huateng, who is also the chairman and one of the largest shareholders of the company. Ma is widely regarded as one of the most influential and visionary entrepreneurs in China’s tech industry. He has led Tencent’s innovation and diversification strategy over the years and has fostered a culture of entrepreneurship and collaboration within the company. One of the top shareholders of Tencent is Naspers, a South African-based holding company that owns 29% of Tencent through its subsidiary Prosus. Naspers is the largest shareholder in Tencent and dominates the South African stock market.

Source: noteookcheck
Tencent Holdings Ltd’s Overview
Business Model
Tencent, a Chinese tech conglomerate, operates multiple businesses encompassing gaming, social media, payment, e-commerce, and advertising. The company derives its revenues from four primary segments: value-added services (VAS), fintech and business services, online advertising, and others.
The VAS segment consists of online games, social networks, digital content, and cloud services. Tencent generates revenue through the sale of virtual items, subscriptions, in-game advertising, and cloud computing fees. VAS stands as Tencent's largest and most profitable segment, accounting for 53% of total revenues and 63% of gross profit in 2022.
Within the fintech and business services segment, Tencent offers payment services, wealth management, micro-loans, insurance, enterprise software, and cloud services. The company earns revenue from various sources such as transaction fees, interest income, commissions, software licensing, and cloud computing fees. Fintech and business services represent Tencent's fastest-growing segment, contributing 26% of total revenues and 23% of gross profit in 2022.
Tencent's online advertising segment encompasses display advertising and performance-based advertising across platforms like WeChat, QQ, Tencent Video, and Tencent News. Revenue in this segment is generated through agreements with advertisers based on impressions, clicks, or conversions. Online advertising ranks as Tencent's third-largest segment, comprising 16% of total revenues and 11% of gross profit in 2022.
Lastly, the "others" segment includes e-commerce, online education, smart devices, and other diverse businesses. Tencent earns revenue from the sale of goods and services, commissions, hardware sales, and other associated fees. The "others" segment represents the smallest portion of Tencent's operations, accounting for 5% of total revenues and 3% of gross profit in 2022.
Main Products and Services
Tencent owns a range of highly popular and successful products and services. WeChat, their flagship social media platform, offers messaging, social networking, e-commerce, payment, news, and entertainment, with over 1.2 billion monthly active users. Tencent Games, the world's largest video game publisher, boasts hit titles like Honor of Kings and PUBG Mobile, generating revenue from virtual items, in-game advertising, and licensing fees. QQ, an original instant messaging service, remains popular with over 600 million monthly active users, offering social networking, games, music, and video. Tencent Video, a leading online video platform, offers diverse content and is a major source of advertising revenue. Tencent Music, a leading music platform, operates apps such as QQ Music and Kugou Music, with over 600 million monthly active users. Weixin Pay, Tencent's mobile payment service integrated with WeChat and QQ, has over 800 million monthly active users and facilitates online and offline transactions. Lastly, Tencent Cloud provides cloud computing solutions to various industries, serving over one million paying customers.

Source: istock
Tencent Holdings Ltd’s Financials, Growth, and Valuation Metrics
Review of Tencent Holdings Ltd’s financial statements
Tencent Holdings Ltd is one of the world’s largest internet companies, with a diverse portfolio of online platforms, products, and services for social networking, gaming, entertainment, e-commerce, cloud computing, artificial intelligence, etc. The company was founded in 1998 and is headquartered in Shenzhen, China. The company’s shares are listed on the Hong Kong Stock Exchange under the symbol 0700.HK.
Tencent Holdings Ltd has a strong financial performance, with consistent revenue growth, high profit margins, strong cash flows, and a solid balance sheet. Some of the key financial metrics of the company are:
Market capitalization: As of June 30, 2023, Tencent Holdings Ltd had a market capitalization of $3.236 trillion, making it one of the most valuable companies in the world.
Net income: In 2023, Tencent Holdings Ltd reported a net income of $25.6 billion, an increase of 23.4% from $20.8 billion in 2022. The net income margin was 24.9%, slightly lower than 25.4% in 2022.
Revenue growth over past 5 years: From 2019 to 2023, Tencent Holdings Ltd achieved a compound annual growth rate (CAGR) of 24.7% in its revenue, growing from $54.6 billion USD in 2019 to $103.1 billion USD in 2023. The revenue growth was driven by the strong performance of its online games, social networks, online advertising, fintech, and business services segments.
Profit margins: In 2023, Tencent Holdings Ltd had a gross profit margin of 46.5%, an operating profit margin of 31.1%, and a net profit margin of 24.9%. The profit margins were slightly lower than the previous year, mainly due to higher costs and expenses related to content production and acquisition, research and development, marketing and promotion, etc.
Cash from operations (CFFO): In 2023, Tencent Holdings Ltd generated $34.7 billion in cash from operations (CFFO), an increase of 18.5% from $29.3 billion in 2022. The CFFO margin was 33.7%, slightly lower than 34.1% in 2022.
Balance sheet strength and implications: As of December 31, 2022, Tencent Holdings Ltd had $54.8 billion in cash and cash equivalents, $19.4 billion in short-term investments, $38 billion in long-term investments, $13 billion in debt, and $91 billion in equity. The company had a current ratio of 2.1 and a debt-to-equity ratio of 0.14, indicating that it had sufficient liquidity and solvency to meet its short-term and long-term obligations. The company also had a high return on equity (ROE) of 28.8%, indicating that it was efficient in generating profits from its shareholders’ funds.
Key financial ratios and metrics
To evaluate Tencent’s valuation and growth potential, we can compare its revenue and earnings growth as well as its forward P/E ratio to its largest peers in the tech industry. The forward P/E ratio is the current stock price divided by the expected earnings per share for the next 12 months. It reflects the market’s expectations of future earnings growth and profitability.
According to Yahoo Finance, as of June 28, 2023, Tencent had a forward P/E ratio of 30.08, which was lower than the average of 35.51 for its peers. This suggests that Tencent stock might be undervalued relative to its peers, given its strong revenue and earnings growth.
Here is a table that shows the comparison of Tencent’s revenue and earnings growth and forward P/E ratio to its peers:
|
Company |
Revenue Growth (2021) |
Earnings Growth (2021) |
Forward P/E Ratio (2023) |
|
Tencent |
15% |
-21% |
30.08 |
|
Alphabet |
23% |
58% |
26.52 |
|
|
35% |
57% |
25.11 |
|
Alibaba |
41% |
-20% |
19.66 |
|
Amazon |
38% |
84% |
54.67 |
|
Average |
30.40% |
31.60% |
35.51 |
Source: Yahoo Finance
As we can see, Tencent had a lower revenue growth than Alphabet in 2021.Tencent had negative earnings growth in 2021, mainly due to the fair value losses from its investments. Excluding these losses, Tencent’s non-IFRS earnings growth was 22% in 2021, which was higher than Alibaba’s but lower than the other peers.
Tencent’s forward P/E ratio was lower than all of its peers except for Alphabet, Facebook and Alibaba in 2023. This indicates that Tencent stock might have more room to grow in the future, as it is trading at a discount to its peers based on its expected earnings growth and profitability.
Tencent Stock Performance
Tencent Stock trading information
Tencent was listed on the Hong Kong Stock Exchange in 2004 under the ticker 700.HK. It trades in Hong Kong dollars (HKD) and follows the Hong Kong trading hours, which are from 9:30 a.m. to 4:00 p.m. local time, Monday to Friday, except for public holidays. Tencent also offers pre-market and after-market trading sessions, which are from 9:00 a.m. to 9:30 a.m. and from 4:15 p.m. to 6:30 p.m. respectively.
Tencent has never done any stock splits since its listing. However, it has paid dividends to its shareholders every year since 2005. The dividends are usually paid in HKD or USD, depending on the preference of the shareholders. The latest dividend was HKD0.8 per share, paid on May 18, 2023.
Tencent also has American depositary receipts (ADRs) that trade on the US over-the-counter (OTC) market under the ticker TCEHY. Each ADR represents one ordinary share of Tencent. The ADRs trade in US dollars (USD) and follow the US trading hours, which are from 9:30 a.m. to 4:00 p.m. Eastern Time, Monday to Friday, except for US public holidays. The ADRs also pay dividends in USD, based on the exchange rate at the time of payment.
Overview of Tencent Stock Performance

Source: TradingView
Tencent Stock Price Performance Analysis
According to Yahoo Finance, Tencent's stock price (0700.HK) has fluctuated between a 52-week high of 414.2 HKD and a 52-week low of 178 HKD. As of July 3, 2023, the current stock price is 338 HKD, which is about 18% lower than the 52-week high and about 90% higher than the 52-week low. The stock price has been volatile in the past year, reflecting the impact of the COVID-19 pandemic, the regulatory environment, the competitive landscape, and the market sentiment on Tencent's business performance.
Source: Yahoo Finance
Some of the key drivers of Tencent's stock price are:
Revenue growth: Tencent's core segments of value-added services (VAS) and fintech and business services (FBS) contribute about 80% of its total revenue. VAS includes online games, social networks, online literature, and music and video streaming, while FBS includes payment, cloud, enterprise software, and wealth management services. These segments have benefited from the increased demand for online entertainment, social interaction, and digital transformation amid the pandemic, as well as Tencent's continuous innovation and investment in new products and platforms.
Profitability and cash flow generation: Tencent's operational efficiency, cost control, and ability to monetize its large and diverse user base are reflected in its profitability and cash flow. Tencent has maintained a stable operating margin of around 31% (excluding fair value gains) and a net margin of around 25% (excluding fair value gains) for the past three years. The company has also generated strong cash flow from operations, enabling it to invest in research and development, content acquisition, strategic partnerships, and mergers and acquisitions.
Investment portfolio: Tencent holds stakes in various companies across different sectors and regions, providing access to new technologies, markets, and opportunities. Notable investments include JD.com, Meituan, Pinduoduo, Sea Limited, Spotify, Snap, Tesla, Universal Music Group, and Epic Games. This investment portfolio diversifies Tencent's revenue sources and offers potential income from dividends or fair value gains.
Future Prospects of Tencent Stock
Tencent's stock prospects depend on its ability to sustain revenue growth, profitability, cash flow generation, investment returns, regulatory compliance, and social responsibility in a dynamic and competitive market environment. Based on analyst ratings from Google Finance, Tencent's stock has a consensus buy rating, with the majority of analysts recommending a buy or strong buy. The target price ranges from 300 HKD to 800 HKD per share, with a median of 500 HKD per share. This implies a potential upside of about 48% from the current stock price of 338 HKD per share.
However, these forecasts are based on assumptions and estimates that may not materialize or may change over time due to various factors beyond Tencent's control. Therefore, investors should exercise caution and conduct their own research before making any investment decisions regarding Tencent's stock.
Risks/Challenges and Opportunities
Tencent is one of the leading internet companies in China, with a diversified portfolio of online services, such as gaming, social media, e-commerce, cloud computing, and fintech. However, it also faces various risks and challenges from its competitors, regulators, and the external environment. Some of the main points are:
Competitive Risks
Tencent faces rising competition from ByteDance, Alibaba, and other internet giants in China and abroad. ByteDance is challenging Tencent's dominance in social media and content creation with its popular apps like TikTok and Douyin. Alibaba is competing with Tencent in e-commerce, cloud computing, and fintech, with its platforms like Taobao, Tmall, AliCloud, and Alipay. Other competitors include Sony, NetEase, Baidu, JD.com, etc.
To analyze the threats from ByteDance and Alibaba in more detail, we can use Porter's Five Forces framework to assess the industry rivalry, bargaining power of suppliers and buyers, and threat of new entrants and substitutes. For instance, we can say that ByteDance has a high threat of substitution for Tencent's WeChat and QQ platforms, as it offers more innovative and engaging short-video and live-streaming features that appeal to younger users. Alibaba has a high bargaining power of buyers for Tencent's cloud computing and fintech services, as it has a larger customer base and a more established reputation in these segments.
Competitive Advantages
Tencent has some competitive advantages that help it maintain its market position and fend off its rivals. These include its network effect, switching cost, R&D capability, strategic investments, and brand portfolio. For example, we can say that Tencent has a strong network effect for its WeChat platform, which has over 1.2 billion monthly active users who use it for communication, social networking, payment, e-commerce, entertainment, and more. This creates a high switching cost for users who are reluctant to leave the platform and lose their contacts and data. Tencent also has a strong R&D capability, with more than 50% of its employees focusing on innovation and product development.
Other Risks
Besides competitive risks, Tencent also faces other risks such as regulations, politics, and uncertain growth. For example, Tencent is subject to the regulatory policies of the Chinese government regarding data privacy, cybersecurity, antitrust, content censorship, etc. These policies may limit Tencent's business operations or impose fines or penalties on it.
Tencent also faces political risks from the geopolitical tensions between China and other countries such as the US and India. These tensions may result in bans or restrictions on Tencent's apps or services in these markets or affect its international reputation or partnerships. Tencent also faces uncertain growth prospects due to the saturation of the Chinese internet market, the slowdown of the Chinese economy due to the COVID-19 pandemic, or other factors.
Future outlook and expansion
Despite the risks and challenges, Tencent also has some growth opportunities that it can leverage to expand its business and increase its revenue. These include its leadership positions in China's online gaming, social networking, and payment markets; its potential to tap into new markets such as cloud computing, e-commerce, live-streaming, and education; its ability to partner with foreign companies keen to enter the Chinese market or collaborate with them in overseas markets; and its vision to promote technology innovation.

Source: Tencent
Why Consider Tencent Stock?
Tencent is one of the most popular and valuable internet companies in the world, with a market capitalization of over $500 billion. It operates various online platforms and services, such as gaming, social media, e-commerce, cloud computing, and fintech. However, it also faces various risks and challenges from its competitors, regulators, and the external environment. Some of the reasons why traders should consider Tencent stock are:
Volatility
Tencent stock is known for its high volatility, which can be attractive for traders who seek to profit from price fluctuations. The volatility can be driven by various factors, such as regulatory changes, COVID impacts, gaming restrictions, earnings reports, etc. For example, in 2022, Tencent stock dropped by more than 20% from its peak in February to its low in May, due to the Chinese government’s policies on the tech sector and its antitrust probe into Tencent’s music business. However, it also rebounded by more than 10% in June, after Tencent announced a share buyback plan and a partnership with Alibaba’s e-commerce platform Taobao. In 2023, Tencent stock could face more volatility as it deals with ongoing regulatory scrutiny, the uncertain recovery from the pandemic, and the intensifying competition from rivals like ByteDance and NetEase.
CFD Trading Opportunities
CFD trading is a form of derivative trading that allows traders to speculate on the price movements of an underlying asset without owning it. CFD trading offers some advantages for traders who want to trade Tencent stock, such as liquidity, leverage, flexibility, and diversification. Tencent has a history of successful investments in other companies. For example, JD.com, Pinduoduo, Meituan, and Sea Limited are examples of Tencent’s successful past investments. The beauty of this strategy is that Tencent has the flexibility to invest anywhere globally that it sees fit and in any company – both listed and private – across multiple industries. Liquidity means that traders can easily enter and exit positions at any time during market hours. Leverage means that traders can use borrowed funds to amplify their exposure to the price movements of Tencent stock. Flexibility means that traders can trade both long and short positions, depending on their market view. Diversification means that traders can trade Tencent stock along with other assets, such as indices, commodities, currencies, etc.
Key Resistance and Support Levels
Technical analysis is a method of analyzing the price patterns and trends of an asset using charts and indicators. Technical analysis can help traders identify the key resistance and support levels of Tencent stock, which can act as potential entry and exit points for their trades. Resistance levels are the price levels where the selling pressure is likely to overcome the buying pressure, causing the price to fall. Support levels are the price levels where the buying pressure is likely to overcome the selling pressure, causing the price to rise.
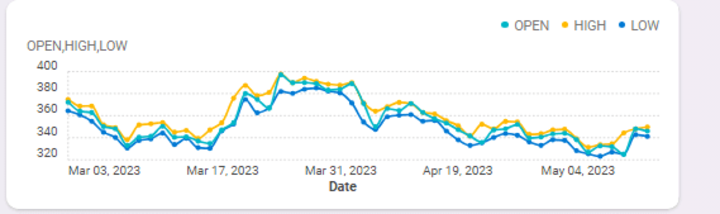
For example, based on the chart below from TradingView (as of July 4th, 2023), some of the key resistance levels are $360 (the recent high), $380 (the 50-day moving average), and $400 (the psychological level). Some of the key support levels are $320 (the recent low), $300 (the round number), and $280 (the 200-day moving average).

Source: TradingView
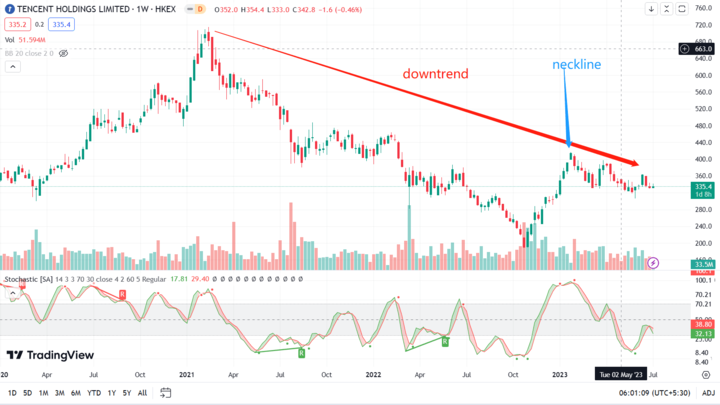
Based on the chart below, Tencent stock has been trading in a downtrend since February 2022, as indicated by the lower highs and lower lows. The downtrend line connects the highs of February, April, and June, and acts as a dynamic resistance level. The chart also shows that Tencent stock has formed a double bottom pattern in May and June, which is a bullish reversal pattern that indicates a possible end of the downtrend. The neckline of the pattern is at $360, which coincides with the recent high and the 50-day moving average. A break above this level could signal a change in trend direction and trigger a rally toward $400 or higher.
The chart below also shows that Tencent stock has been oscillating between overbought and oversold levels on the stochastic oscillator, which is an indicator that measures the momentum or speed of price movements by comparing the current closing price with its previous high-low range over a certain period (such as 14 days). A buy signal is generated when %K crosses above %D from below 20 (the oversold level represented by R in green), indicating bullish momentum. A sell signal is generated when %K crosses below %D from above 80 (the overbought level R in red), indicating a bearish momentum.
Source: TradingView
Profit Strategies
Profit strategies are the plans or methods that traders use to maximize their returns and minimize their risks when trading an asset. Profit strategies can vary depending on the trader’s objectives, risk appetite, time horizon, etc. Some of the common profit strategies for trading CFD Tencent stock are:
Swing Trading: A swing trader may use a stochastic oscillator to trade Tencent stock. A stochastic oscillator is an indicator that measures the momentum or speed of price movements by comparing the current closing price with its previous high-low range over a certain period (such as 14 days). As shown in the graph above, a stochastic oscillator consists of two lines: %K (the main line) and %D (the signal line). The values of %K and %D range from 0 to 100. A buy signal is generated when %K crosses above %D from below 20 (the oversold level), indicating bullish momentum. A sell signal is generated when %K crosses below %D from above 80 (the overbought level), indicating bearish momentum.
CFD Trading: CFD trading allows traders to speculate on the future price movements of Tencent stock without actually owning the underlying shares. This means that traders can profit from both rising and falling prices. CFD trading can be a risky investment, so it is important to understand the risks involved before trading.
Trade Tencent Stock CFD at VSTAR
If you are interested in trading Tencent stock CFD, you may want to consider VSTAR as your online broker. VSTAR is a multi-regulated and reliable broker that offers CFD trading on various instruments, including forex, crypto, commodities, indices, and stocks.
VSTAR advantages:
1. Leverage: Trade shares CFDs with leverage up to 1:200 for more trading opportunities with less capital.
2. Lower costs: Competitive spreads from 0.0 pips and no commission on stock CFDs, ensuring cost-effective trading.
3. Global stock market access: Trade popular US Stocks and HK Stocks.
4. Fast execution: Orders are filled at the best market prices within milliseconds to seize opportunities and avoid delays.
5. User-friendly platform: Access real-time quotes, charts, and analysis with ease on the intuitive trading platform.
6. Risk-free demo account: Practice trading with $100,000 virtual funds, allowing you to test strategies and experience VSTAR's services without risking your own money.


Conclusion
In conclusion, Tencent is a prominent internet company, however, it is facing risks and challenges in a competitive market. Trading Tencent stock CFDs can be a profitable strategy, offering benefits such as liquidity, leverage, flexibility, and diversification. Effective trading requires utilizing tools and methods like technical and fundamental analysis, indicators, and signals. VSTAR is a recommended broker for Tencent stock CFD trading, providing competitive conditions, fast execution, a user-friendly platform and app, a risk-free demo account, and trustworthiness as a fully regulated broker trusted by traders worldwide.