


With an astounding 113 million paying users, Tencent Music Entertainment Group generated over $500 million in music subscription revenues per quarter. Monday, Tencent Music Entertainment Group executives disclosed that strong subscriber growth exceeded initial projections, resulting in a 28% increase in first-quarter profits to CNY1.53 billion ($212 million).
Tencent Music Surpassed Paying Subscribers
By implementing marketing strategies that coincided with the celebrations of the Chinese New Year, TME acquired an unprecedented number of net new subscribers during the quarter. The revenue generated from music subscriptions increased by approximately 40%, amounting to CNY3.62 billion ($501 million).
As of March, Tencent Music had amassed 113.5 million paying subscribers, roughly half the number accumulated by its global competitor Spotify. Notwithstanding this, overall revenues decreased by 3.4% compared to the preceding year, culminating in CNY6.77 billion ($937 million).
Tencent Music Revenue Segment Analysis
Revenues from social entertainment services have declined since TME terminated a popular live-streaming service due to concerns that it could be exploited for wagering purposes. From CNY3.5 billion during the same period last year to CNY1.76 billion ($244 million), revenue from social entertainment services fell by nearly 50%.
Enhanced competition has also played a role in the consistent decrease of monthly active users, which fell by 28% to 97 million in the initial quarter of this year compared to last year.
Nonetheless, a 43% increase in revenue from the online music division counterbalanced the effects of a decline in revenues from the social entertainment division, culminating in CNY 5.01 billion ($693 million). This expansion's principal drivers were income from music subscriptions and advertising services.
Tencent Music is the operator of WeSing, a social karaoke application, QQ Music, Kugou, and Kuwo.
TME Stock Forecast Technical Analysis
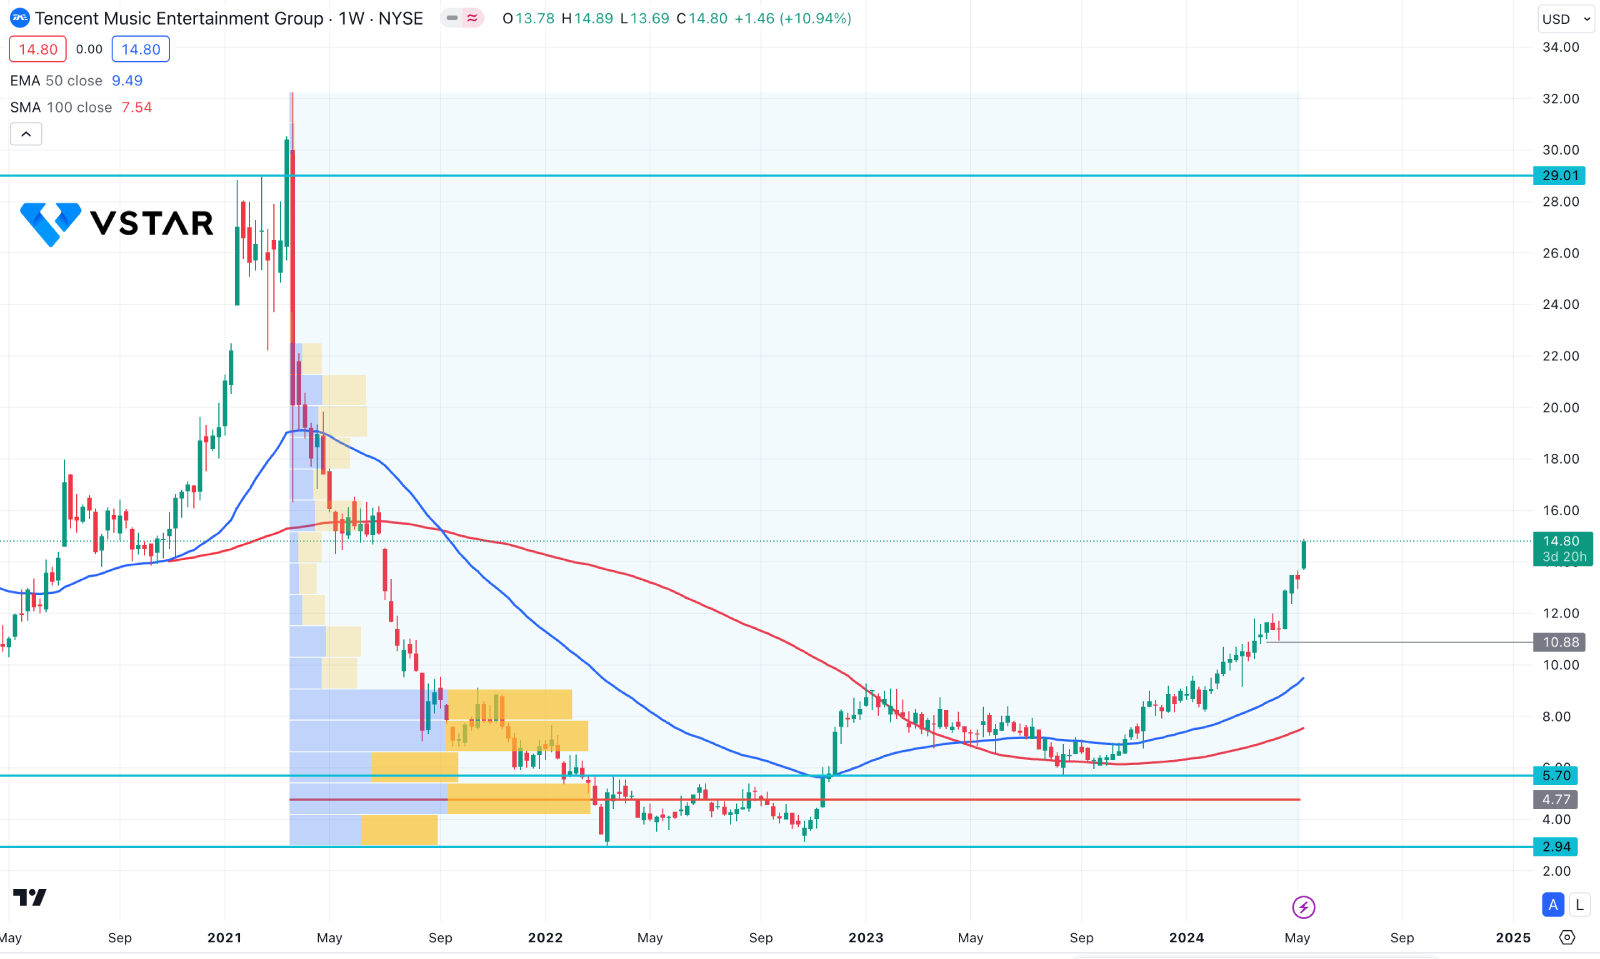
In the weekly chart of TME stock price, the recent price shows a bullish impulsive pressure after forming a valid bottom at the 2.94 level. Moreover, the price formed bullish accumulation and manipulation phases before forming another wave above the 10.00 psychological line.
In the main chart, a bullish crossover is seen between dynamic 50 and 100 Moving Average lines, suggesting a bullish continuation signal. Moreover, the most high volume level since February 2021 is at 4.77 level, which is also below the current price.
Based on the weekly price forecast, the ongoing buying pressure is solid above the 10.00 psychological line, which might extend the upward pressure towards the 24.00 level.
On the other hand, any immediate bearish pressure with a weekly candlestick below the 10.88 level might initiate a downside correction toward the 100 SMA line before forming another bull run.


