


UAL Stock lost 10.66% value in a day when the U.S. aviation regulator extended the indefinite grounding of Boeing 737 MAX 9 aircraft. Part of the pressure on UAL came from a downbeat earnings forecast from Delta, estimating an EPS of between $6 and $7 in fiscal 2024.
United Airlines Was Forced To Cancel Flights
The FAA revealed plans to increase surveillance of Boeing in response to the incident. These plans include conducting audits of the Boeing 737 MAX 9 production line and its suppliers. An autonomous organization can also undertake specific safety certification obligations previously delegated to Boeing. The FAA maintained the grounding of 171 aircraft featuring a comparable configuration, emphasizing the imperative to ensure the safety of American travellers.
To ascertain whether the safety measures are adequate to resume MAX 9 flights, the FAA clarified that forty of the impacted aircraft must be reinspected following a comprehensive evaluation. During the ongoing crisis, Alaska Airlines and United Airlines, the two carriers that operate the aircraft in question, were forced to cancel many flights, amounting to hundreds.
During preliminary inspections, Alaska and United identified unsecured components on several grounded aircraft, which doubted the quality control procedure.
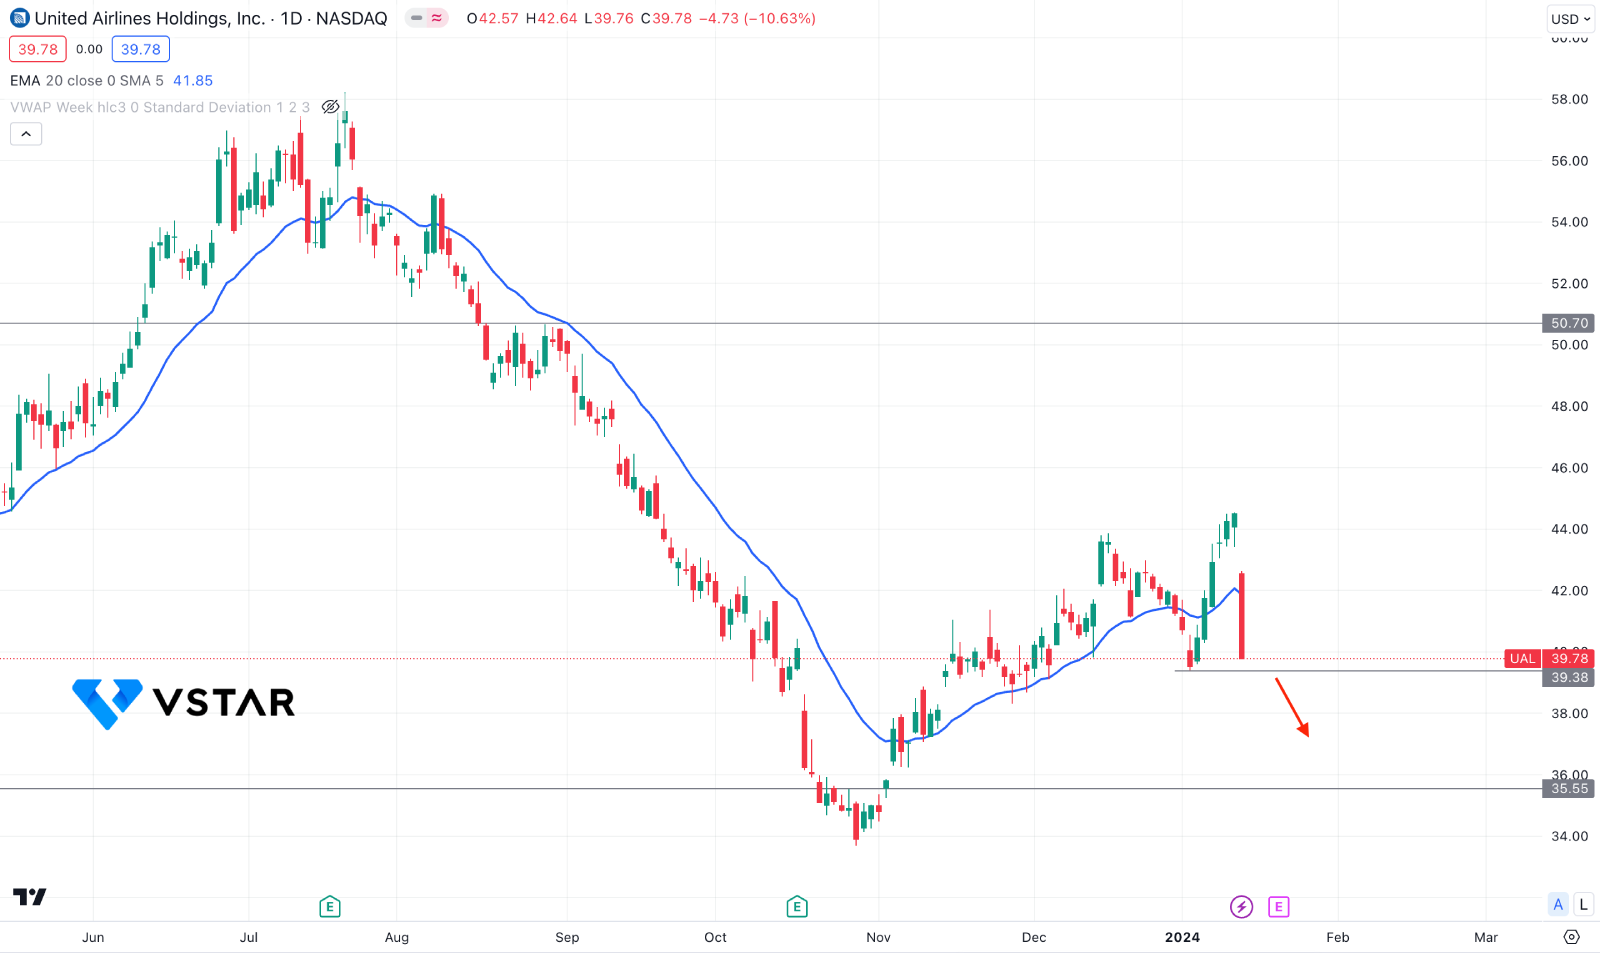
United Airlines Stock (UAL) Technical Analysis
In the daily chart of UAL stock price, a corrective price action is visible, which is within a strong bearish leg. After forming a bottom at the 33.71 level, the price went higher but formed a CHoCH at the 43.86 Sweep level. However, a bearish signal did not come from the sweep, as the 39.38 low is still protected.

In the recent chart, the dynamic 20-day EMA is above the price, with a strong bearish daily candle formation below it. Moreover, the RSI turned down and moved below the 50.00 line, while the MACD histogram turned red after three consecutive bullish lines.
Based on the market outlook of UAL stock, a bearish continuation might come after violating the 39.38 near-term support level. The primary short opportunity might come after having a daily candle below the 39.38 level, aiming for the 35.55 level.
On the bullish side, a failure to hold the price below the 39.00 level with a bullish reversal candlestick formation in the daily chart could be a long signal, targeting the 50.00 level.


