


Crude oil prices are influenced by a myriad of factors, one of which is the level of U.S. crude oil inventories. The weekly reports from the Energy Information Administration (EIA) and the American Petroleum Institute (API) provide crucial data that market participants use to gauge the supply-demand dynamics in the oil market. In this analysis, we will delve into the recent inventory data and explore how it impacts crude oil prices, considering specific numerical values and trends.
1. US Crude Oil Inventory Data
1.1. EIA's Weekly Inventory Reports
The EIA's weekly inventory reports are highly anticipated by the energy market. They provide information on the stockpiles of crude oil and refined products in the United States. These reports are a reflection of the nation's petroleum demand and production capacity.
1.2. API's Inventory Reports
The API, in conjunction with the EIA, also publishes weekly inventory data. This data includes figures for U.S. crude oil, petrol, and distillate stocks. It serves as an additional source of information to assess the state of the oil market.
2. Impact of Inventory Data on Crude Oil Prices
2.1. Inventory vs. Expectations
One key aspect of analyzing inventory data is comparing the actual figures to market expectations. Let's consider the most recent data:
EIA's Forecast: -2.200 million barrels
API's Actual: +1.586 million barrels
In this instance, the API data reported an unexpected increase in crude oil inventories. This divergence from the forecast can significantly affect crude oil prices.
2.2. Implications of Inventory Changes
When crude oil inventories deviate from expectations, it sends clear signals to the market:
2.2.1. Inventory Increase > Expected: Bearish for Prices
If the actual increase in crude inventories is greater than anticipated (as seen in the API data), it implies weaker demand or oversupply. Market participants often react by selling crude oil futures, pressuring prices downward.
2.2.2. Inventory Decrease < Expected: Bullish for Prices
Conversely, if the decline in inventories is less than expected, it suggests robust demand or supply constraints. This scenario tends to drive up crude oil prices as traders anticipate potential shortages.
2.2.3. Inventory Increase < Expected: Bullish for Prices
When the increase in crude inventories is less than expected, it indicates stronger demand or reduced supply. This bullish sentiment prompts buyers to enter the market, leading to price increases.
2.2.4. Inventory Decrease > Expected: Bearish for Prices
Lastly, if the decline in inventories exceeds expectations, it may signify overzealous buying or a temporary supply disruption. This can lead to bearish sentiment, causing a decline in crude oil prices.
3. Analyzing Recent Inventory Data
3.1. Past Week Data
In the week ending September 15, 2023, several key indicators were reported:
Crude oil refinery inputs averaged 16.3 million barrels per day, down 496,000 barrels per day from the previous week.
Refineries operated at 91.9% capacity.
Gasoline production increased to 9.7 million barrels per day.
Distillate fuel production decreased to 4.8 million barrels per day.
Crude oil imports averaged 6.5 million barrels per day, a 1.1 million-barrel decrease from the previous week.
Total motor gasoline imports averaged 511,000 barrels per day.
Distillate fuel imports averaged 83,000 barrels per day.
3.2. Inventory Changes
U.S. commercial crude oil inventories decreased by 2.1 million barrels from the previous week.
Total motor gasoline inventories decreased by 0.8 million barrels.
Distillate fuel inventories decreased by 2.9 million barrels.
Propane/propylene inventories increased by 1.6 million barrels.
Total commercial petroleum inventories increased by 3.0 million barrels.
3.3. Demand Trends
Total products supplied over the last four weeks averaged 20.9 million barrels a day, up 6.8% from the same period last year.
Motor gasoline product supplied averaged 8.8 million barrels a day, up 2.8% from the same period last year.
Distillate fuel product supplied averaged 3.8 million barrels a day over the past four weeks, up 11.5% from the same period last year.
Crude Oil Prices
The price for West Texas Intermediate (WTI) crude oil was $90.83 per barrel on September 15, 2023, showing a notable increase from the previous week's price. This trend is in line with the bullish sentiment often associated with declining inventories.
The technical perspective on the weekly moves of WTI Crude Oil can be comprehended as follows:
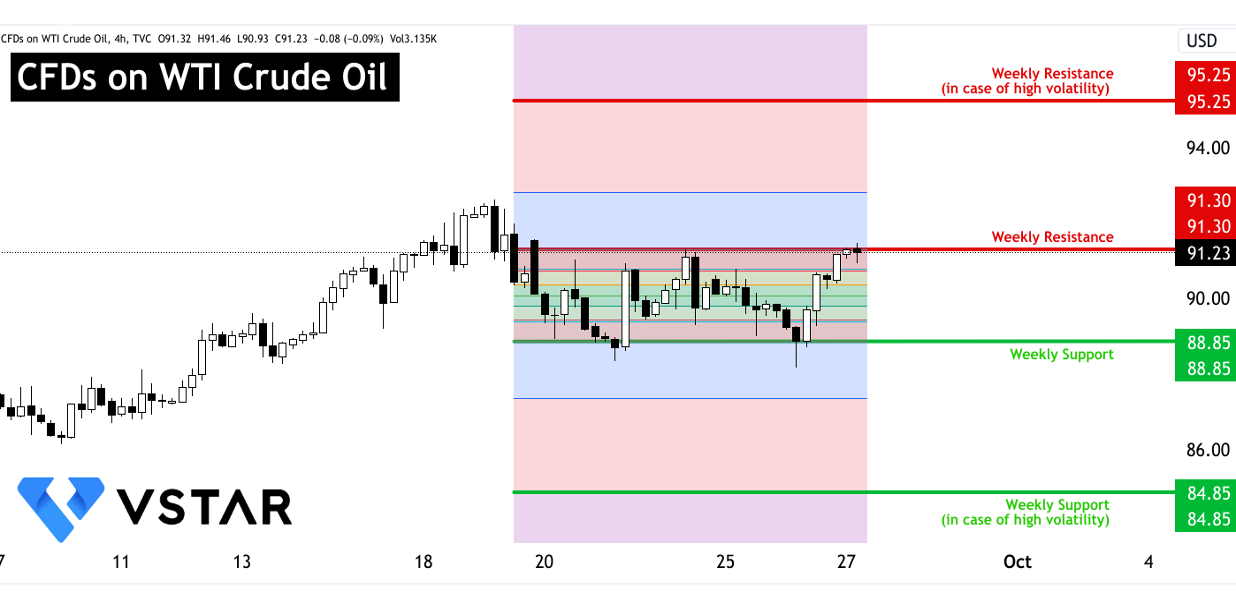
Data source: tradingview.com
In conclusion, inventory data plays a crucial role in influencing crude oil prices. The recent data, as exemplified by the API report, can have a significant impact on market sentiment. When inventory levels deviate from expectations, it can trigger bullish or bearish reactions depending on the direction and magnitude of the change.
In the current scenario, the unexpected increase in crude oil inventories reported by the API contrasts with the EIA's forecast, potentially creating uncertainty and influencing crude oil prices. Market participants must carefully monitor inventory trends, production capacity, and demand indicators to make informed decisions in the ever-fluctuating crude oil market.


