


In anticipation of the approaching holiday season, trading activity is anticipated to decline during the last week of 2023. Nevertheless, the economic calendar continues to be jam-packed with significant events. Statements issued by central bank officials after a sequence of monetary policy meetings will garner significant attention.
Furthermore, the Bank of Japan is gearing up to conduct its meeting the following week, all the while the US awaits the disclosure of the pivotal Personal Consumption Expenditure (PCE) report.
USDX Bears Could Initiate From High Impact Releases
The US Dollar Index (USDX) recommenced its bearish trend, culminating in its most modest weekly close since July after the Fed's December meeting. Certain members of the Federal Open Market Committee (FOMC) showed a possibility of rate cuts, which pushed the US Dollar lower and increased US yields. A rally ensued on Wall Street in response to the Federal Reserve's strategic shift, known as a "pivot," which ultimately led to a record closing high for the Dow Jones.
Additional significant central bank decisions, including those of the ECB and the BOE, played a role in the depreciation of the US Dollar. Although these banks adopted a hawkish posture and decided to maintain unchanged interest rates, they did not indicate a significant change in direction.
However, this divergence in monetary policy may be temporary due to the continued robustness of the United States economy. Market observers predict the Federal Reserve will initiate interest rate cuts the following year after other central banks.
US housing data will be the primary topic of discussion the following week: Building Permits and Housing Starts are slated for Tuesday, and Existing Home Sales are due on Wednesday. In addition to the weekly jobless claims and the Philadelphia Fed manufacturing index, the third quarter GDP will be revised on Thursday.
Friday is anticipated to be the most significant day of the week due to the issuance of the Core Personal Consumption Expenditure Price Index.
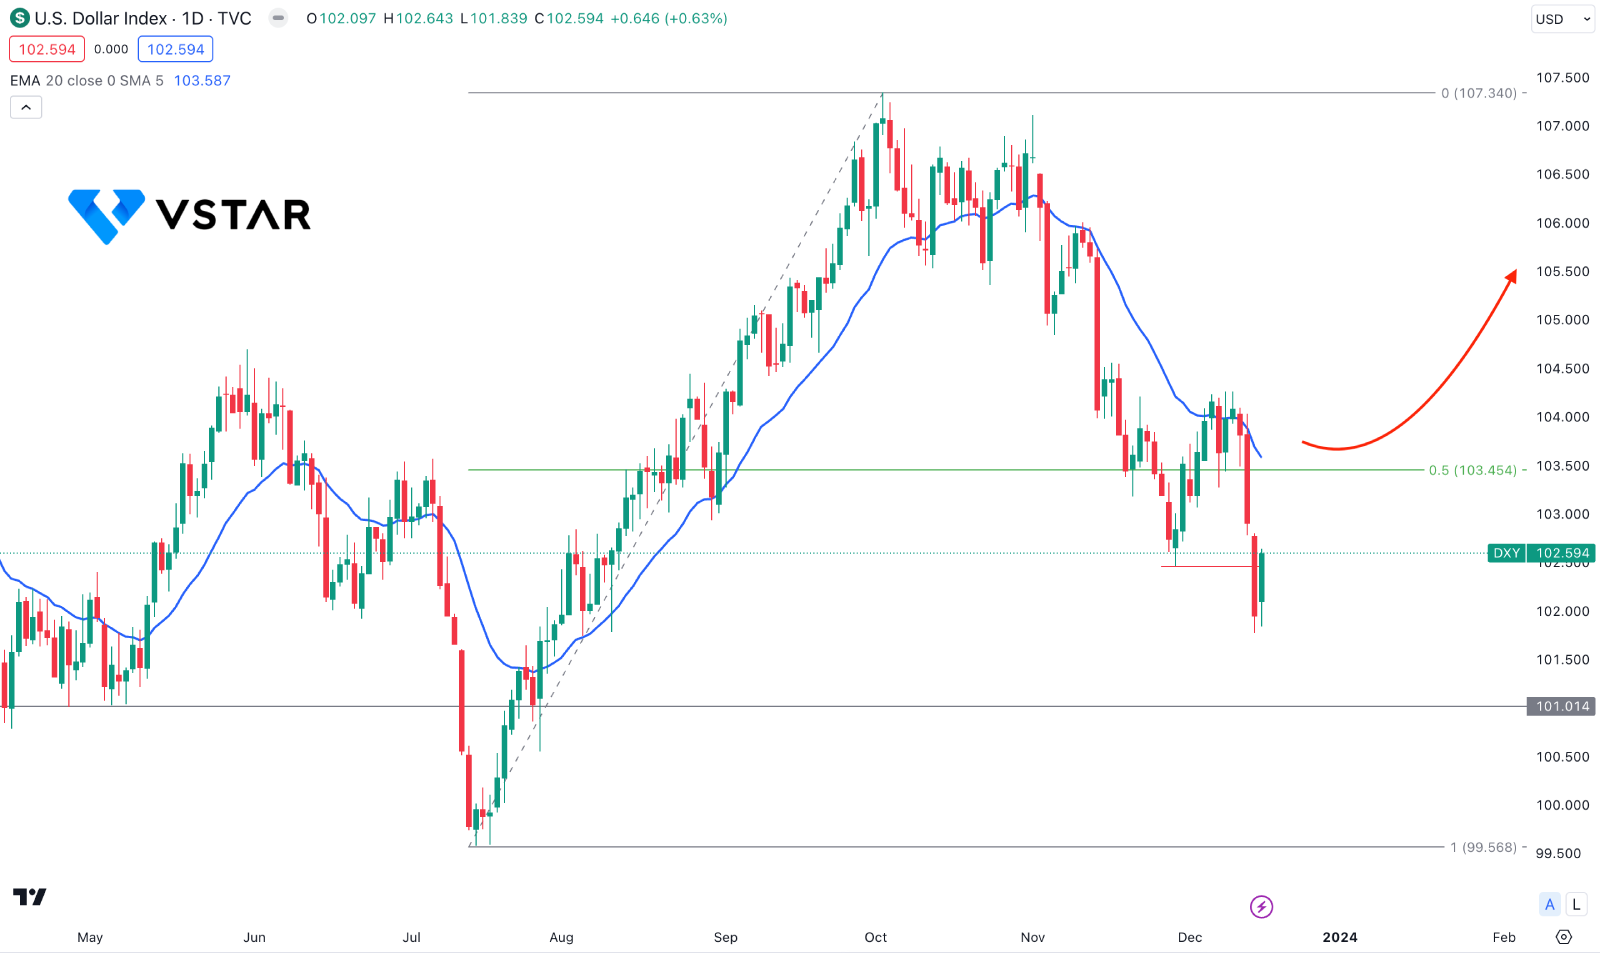
US Dollar Index (USDX) Daily Chart
In the daily chart of USDX, the current price trades at the discounted zone from the 99.56 low to the 107.34 area. As long as the price trades below the 103.45 Fibonacci level, we may consider any buying opportunity as potent.

The most recent chart shows a bearish pressure from the dynamic 20-day EMA level, which works as a bearish continuation opportunity for this instrument. However, a minor bullish correction is pending as a mean reversion to the 20 EMA.
Based on the daily outlook, an immediate selling pressure and a bullish rejection from the 101.00 to 99.55 zone could be a long opportunity, targeting the 107.00 level. Moreover, a bullish break with a daily close above the 103.50 level could offer an immediate long opportunity.
The alternative approach is to find the price below the 99.50 level before anticipating a bearish pressure towards the 94.76 support level.


