


The US dollar index maintained its position near its all-time lows since mid-January. Ahead of pivotal US inflation data anticipated later this week, investors refrained from dramatic action.
Powell On Rate Decision
The dollar declined by more than one percent last week in response to remarks made by Fed Chair Powell during his congressional testimony. Prior to contemplating rate adjustments, Powell underscored the imperative for the central bank to acquire more assurance that inflation will attain a sustainable trajectory toward the 2% objective.
Furthermore, data disclosed on Friday indicated that although February's payroll figures exceeded initial projections. Furthermore, wage growth halted considerably more than anticipated, and the unemployment rate rose unexpectedly.
The market currently prices in the prospect of a rate cut by the Federal Reserve in June but does not anticipate any reductions in March or May.
Nonfarm Payroll Update
Nonfarm payrolls in the United States increased by 275,000 in February, exceeding expectations of 200,000. Nevertheless, the payroll figures for January were subsequently reduced from the initially reported 353,000 to 229,000. In February, the unemployment rate rose by 0.2%, peaking at 3.9%, the highest level in two years. This signifies a deterioration in the labor market compared to the anticipated stability of 3.7%.
In February, average hourly earnings increased 4.3% annually, compared to 4.4% in January, which was consistent with expectations.
Chicago Fed President Goolsbee's pessimistic remarks compounded Friday's adverse sentiments. He says, "As inflation declines, the Fed will progressively move towards less restrictive policies over the year."
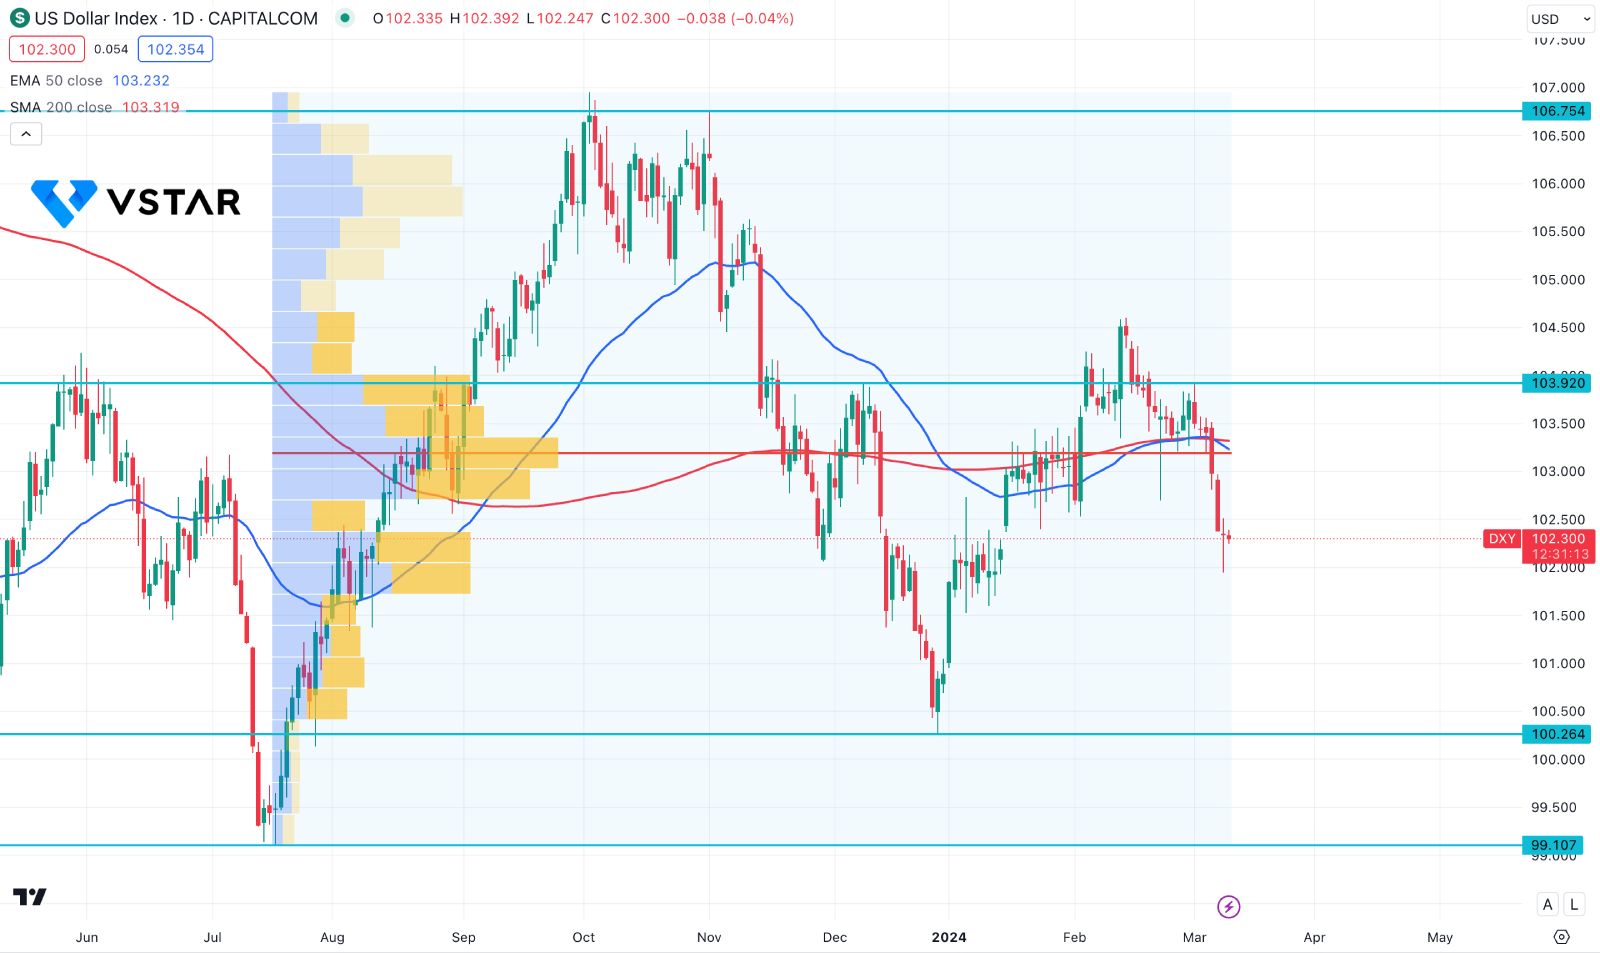
US Dollar Index (USDX) Technical Analysis

In the daily chart of DXY, the ongoing selling pressure is potent, and it came with a solid buy-side liquidity sweep.
Since the beginning of 2024, the upward surge from the 100.26 bottom came with a solid counter-impulsive pressure and formed a daily candle above the 103.92 static level. However, the price went sideways after making the new high and failed to hold the momentum.
As the recent price showed volatility above the existing swing high and formed a bearish daily close below the dynamic 50-day EMA, the market momentum shifted from bullish to bearish. Moreover, the recent 200-day SMA is above the 50 EMA, which signals a confluence selling opportunity.
Based on this outlook, the downside momentum is potent in this instrument as long as the price trades below the 103.10 high volume level. However, a bullish reversal is possible if the daily candle close above the 103.50 level with a consolidation.


