


The Canadian Dollar provided a corrective price action against the US Dollar for a prolonged time. Also, the near-term price action suggests indecision, which might result in a stable trend formation after a valid breakout.
The Fed & BoC Aimed At Rate Cut
The Canadian dollar eliminated some gains against the U.S. dollar on Friday due to rising long-term financing costs and data indicating that the expansion of wholesale trade fell short of analyst expectations.
The unexpected increase in producer prices in the US during January strengthened the notion that the Federal Reserve will postpone the commencement of its interest rate cut until the middle of the year.
A rate cut may benefit the Canadian economy, particularly in light of the substantial debt incurred by households throughout the pandemic.
In December, the Canadian wholesale trade witnessed a moderate increase of 0.3% compared to November, which failed to meet the 0.8% growth forecast put forth by economists.
The Bank of Canada has identified previous increases in interest rates as a factor in the deceleration of the economy despite ongoing concerns regarding underlying inflation.
Data To Look At
On Tuesday, economists expect to see the publication of Canada's consumer price index report for January, which is expected to reveal a marginal deceleration in inflation from 3.4% in December to 3.3% annually.
The upcoming FOMC meeting minutes and the S&P Global PMI could be crucial for the US Dollar. These events could illustrate the upcoming easing cycle, as they might show valuable insight into the current US economic outlook.
The ongoing war in the Middle East could directly affect the Crude oil price, where the current sentiment is towards the buyers' side. As a result, any further signal of the bullish Crude Oil might work as a confluence bearish factor for USDCAD.
USDCAD Technical Analysis

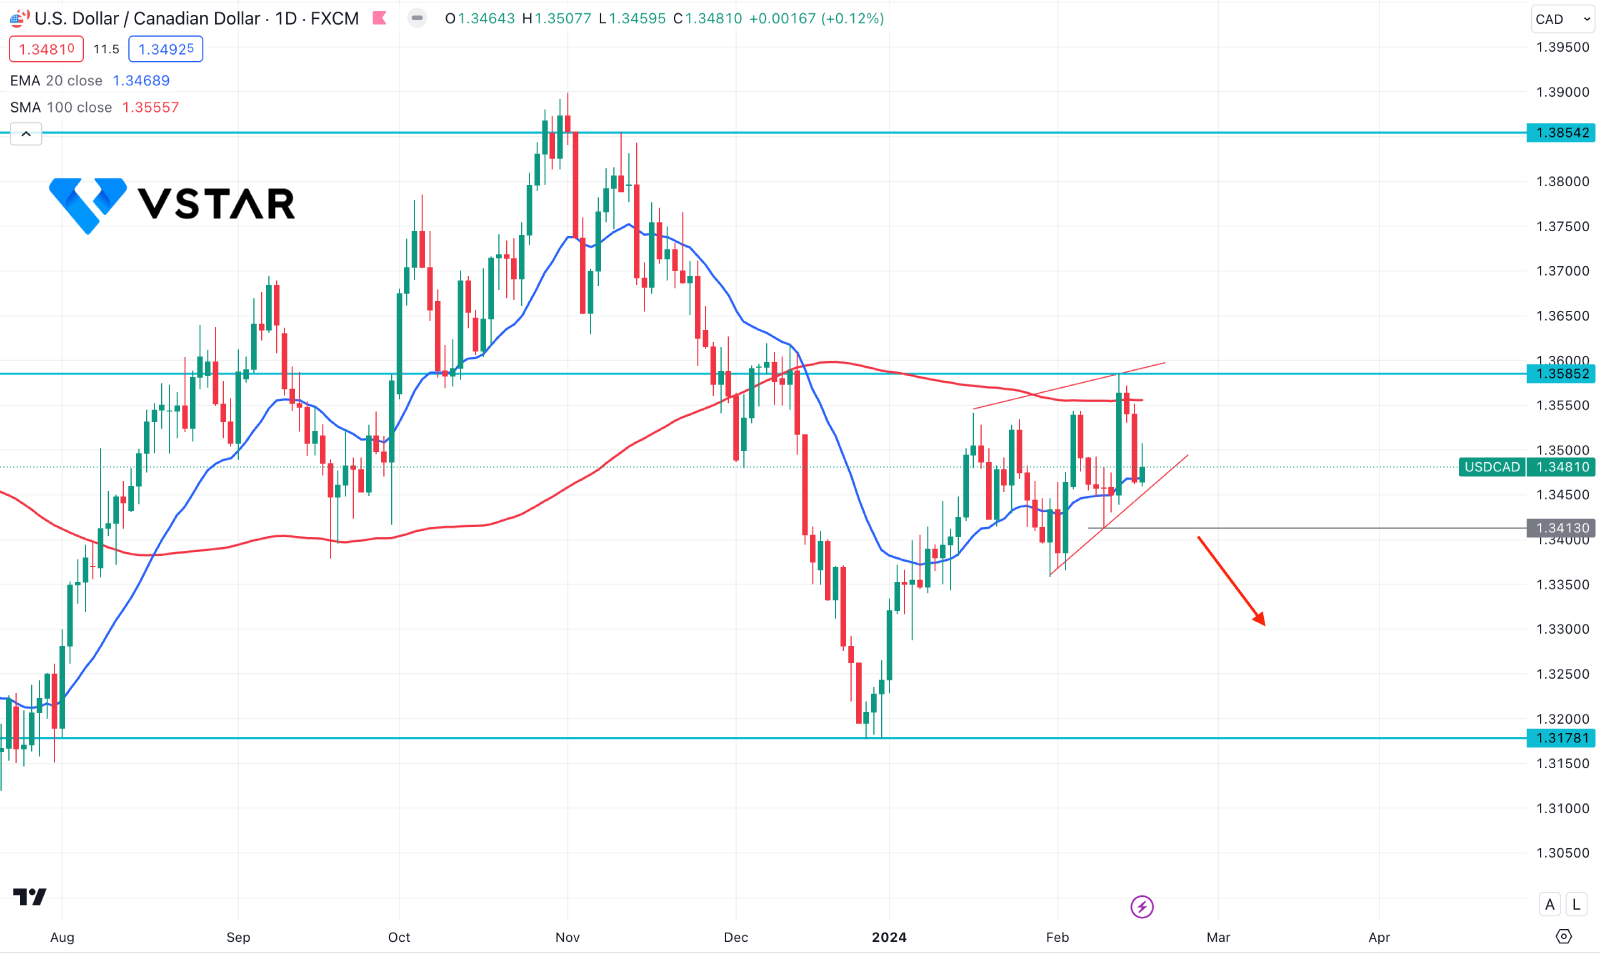
In the daily chart of USDCAD price, the recent price trades sideways within a rising wedge pattern, where the dynamic 100-day SMA is a major resistance. Moreover, the weekly candle suggests indecision as recent candles closed with a sideways momentum with a Doji formation.
In the coming days, investors should closely monitor how the price reacts to the near-term support of 20 EMA. A valid downside pressure with a daily candle below the static 1.3413 level could open a short opportunity, targeting the 1.3178 support level.
On the other hand, a bullish range extension is possible from the wedge support, which might offer a long opportunity from the 1.3460 to 1.3400 zone with a valid bullish signal. In that case, the 1.3585 level would be a major resistance, which would be the primary target before reaching the 1.3800 level.


