


The USD/JPY is witnessing additional declines on Monday, as the Japanese Yen (JPY) gains more than a full percentage point against the US Dollar. Having declined from the 150.00 level, the pair is positioned to fall towards the 148.50 psychological area.
JPY Bulls Are Active Before The Inflation Data
As hypothetical positions for the US Dollar decline globally, the Yen's recovery from multi-year lows is being bolstered. Sustaining the momentum of the Japanese yen poses a challenge for investors before releasing Japanese inflation figures later this week.
It is anticipated that the forthcoming Japan National Consumer Price Index (CPI) inflation report on Friday could reveal a moderate improvement in the yearly core CPI, which rises from 2.8% to 3.0%.
As a result of the Bank of Japan's (BoJ) recent extremely dovish posture, the Yen has depreciated against other major currencies. The Bank of Japan (BoJ), relying on unconventional policy measures to avert a relapse into long-term deflation, would be saved by a positive inflation figure.
US Dollar Index (USDX) Outlook
The market is closely examining the US inflation data from last week, and it is looking forward to learning more from the Federal Open Market Committee (FOMC) minutes of its November meeting, which are expected to be released on Wednesday.
Due to increasing downward pressure on the US Dollar Index (USDX) with lower October CPI data, the USDJPY showed bearish pressure during the past week. The 10-year yield peaked at 5.02% in late October but fell to its lowest since late September. Similarly, the rates for two and five years fell to their lowest levels since September, at 4.80% and 4.35%, respectively.
These rates recovered to 4.90%, 4.47%, and 4.46% on Monday, which would put pressure on the precious metal and safe haven Yen. Any fresh evidence of the economy overheating or inflation picking up speed could encourage hawkish speculation from the Fed, which would eliminate existing losses on the USDJPY pair.
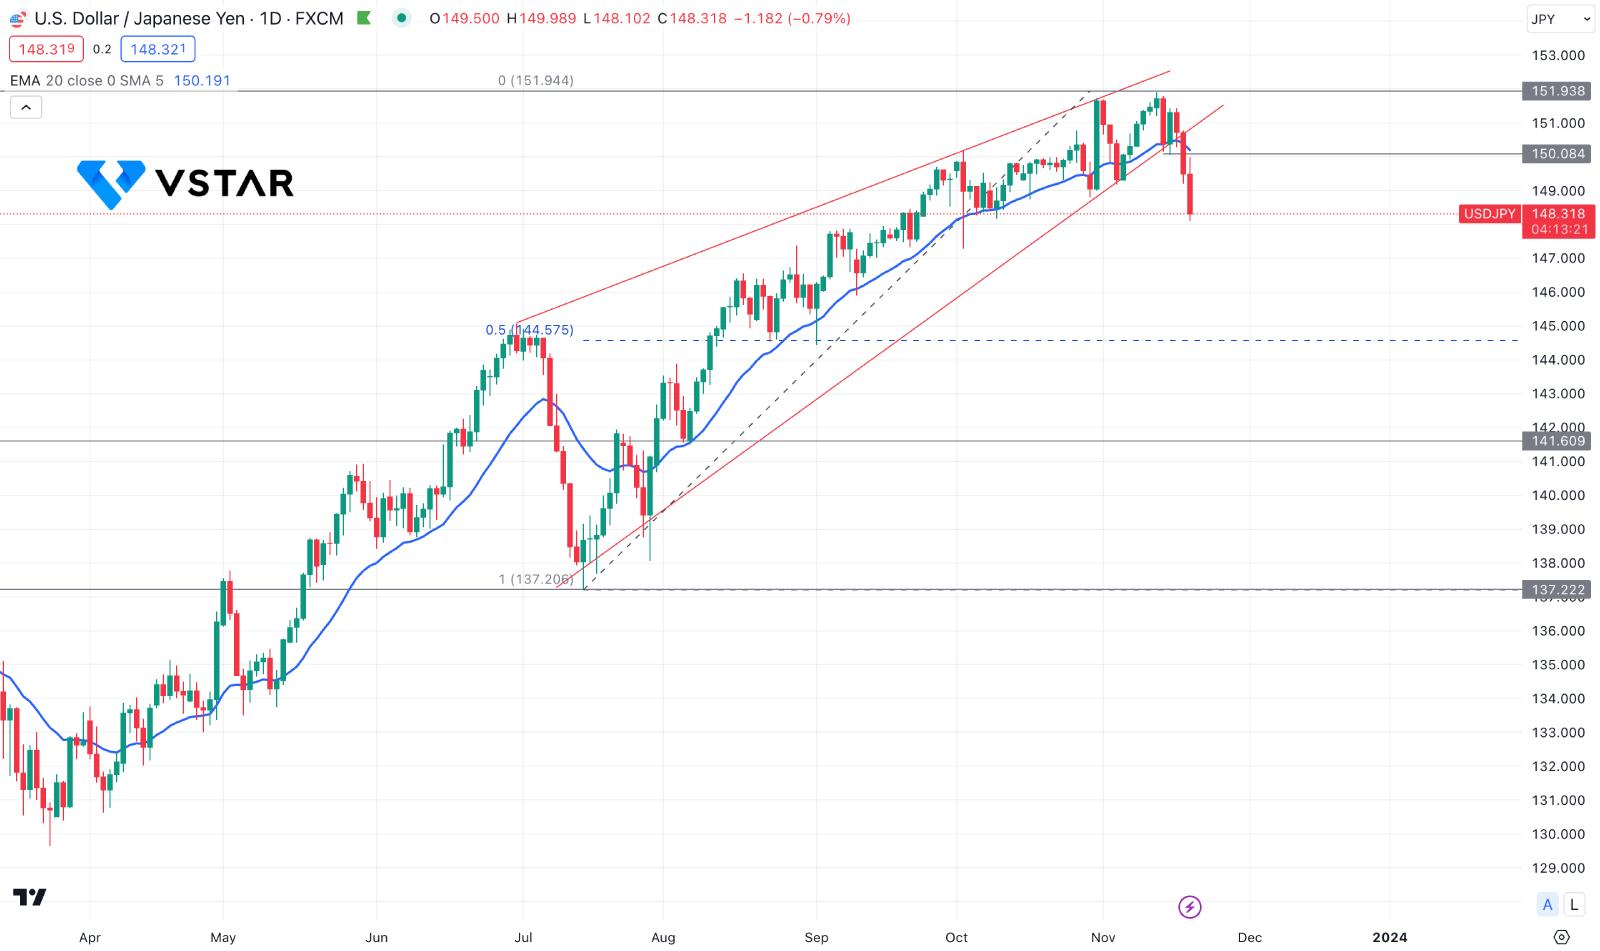
USDJPY Technical Analysis
The USDJPY price shows a rising wedge breakout and a double top formation at the 151.93 resistance level. Moreover, a bearish two-bar candlestick rejection on the weekly chart is a confluence resistance at the top.

Anticipating a bearish pressure would be challenging as the broader market direction is still bullish. Moreover, the dynamic 20-week Exponential Moving Average works as near-term support at the 146.91 level, which could be an immediate barrier to sellers.
In the daily chart, the selling pressure is potent as a bearish daily candle is present below the 20 EMA. In that case, the next support level is at the 144.57 level, the 50% Fibonacci Retracement level from the wedge from top to bottom.
On the bullish side, an immediate rebound with a daily close above the 20 DMA could be a long opportunity, targeting the 153.00 level. Moreover, an extensive downside correction is possible, where a bullish rebound from the 147.24 to 146.00 area could be another long opportunity, depending on the price action.


