


After a brief downturn, the USDJPY pair rebounded, potentially putting to the test the foreign exchange intervention threats from the Ministry of Finance (MoF) and Bank of Japan (BoJ), in addition to the 155 resistance level.
Why Is USDJPY Moving Higher?
The likelihood of the current buying pressure came as Treasury yields recommenced their ascent, propelled by strong data and a proactive approach from the Federal Reserve. In stark contrast to market expectations of prolonged low rates, the Philadelphia Fed reported a substantive increase. New York Fed President John Williams alluded to the possibility of rate increases if economic indicators so demanded.
While this is consistent with fundamental monetary policy principles, it contrasts sharply with the 75 basis point rate cut forecast by the Federal Reserve for the current year. At this time, the critical inquiry is whether the yield differential between Japanese Government Bonds (JGBs) and Treasury bonds will expand to a degree that would enable a breach of the substantial barrier at 155.00/20.
Should the strongly positive correlation between the USDJPY and the 2-year Treasury-JGB yield spread surpass the peak of 4.73% observed in 2024, it would increase the probability of significant optionality testing at 155.
Economic Releases To Look At
Prevalent attention is not directed towards forthcoming data releases until April 25th and 26th, when the Personal Consumption Expenditures (PCE) and GDP data are released, respectively.
Nevertheless, market participants will closely monitor Friday's release of Japan's core Consumer Price Index (CPI), which is anticipated to decline from 2.8% in February to 2.6%. However, the prevailing attention will continue to be directed towards fluctuations in Treasury yields and the possibility of foreign exchange market intervention.
USDJPY Forecast Technical Analysis
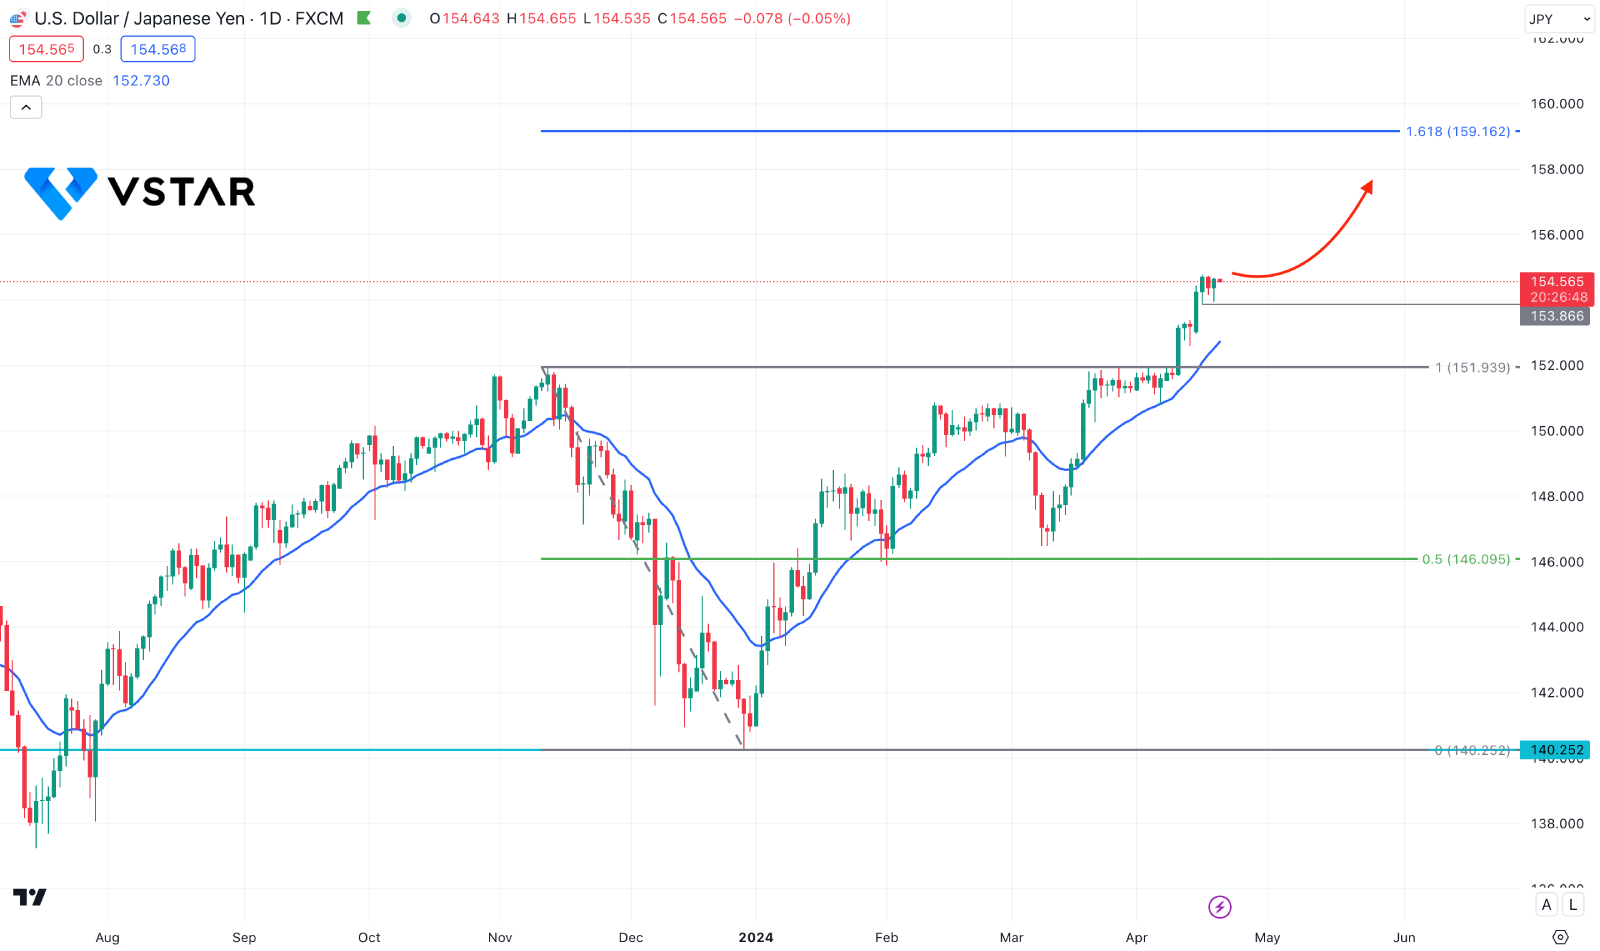
In the daily chart of USDJPY, a bullish rally base rally formation is seen, where the current price hovers within a bullish impulsive wave. Primarily a bullish continuation is highly possible, where any re-accumulation and manipulation could be a long signal.
The dynamic 20-day Exponential Moving Average is below the current price and is working as an immediate support. Moreover, the 14-day Relative Strength Index moved below the 50.00 line, while the ADX showed a rebound from the 20.00 area.
Based on this outlook, an intraday bullish reversal from the current consolidation could be a long signal, targeting the 159.16 Fibonacci Extension level. However, a considerable downside correction might happen towards the 152.00 level after having a valid bearish daily candle below the 153.86 low.


