


Crude oil prices moved 2% higher on Tuesday, driven by the expectation of supply cuts by OPEC+, Kazakh oil production cuts, and a weakening U.S. dollar.
OPEC+ Meeting Projection
The OPEC+ meeting could be an online ministerial meeting to discuss 2024 production targets. Although challenging, the meeting’s output might maintain the existing agreement for another month instead of implementing more profound production cuts. As of now, disagreements of last week caused a market decline when the original meeting date was postponed.
According to Analyst Phil Flynn, the current deal could be unchanged. Possible compromises include Angola and Nigeria accepting reduced production targets temporarily. On the other hand, Saudi Arabia desires lower production quotas from OPEC+ countries, particularly the United Arab Emirates.
The current oil price is supported by the weakening U.S. dollar, the U.S. crude inventory decline, and the 56% daily output cut from Kazakhstan's major fields. Additionally, the ongoing cease-fire deal between Israeli forces and Hamas contributed to market stability beyond the initial deadline.
WTI Crude Oil Technical Analysis
In the daily chart of Crude Oil, the current price trades below the dynamic 20 EMA resistance, but the recent price action suggests an indecisive momentum.
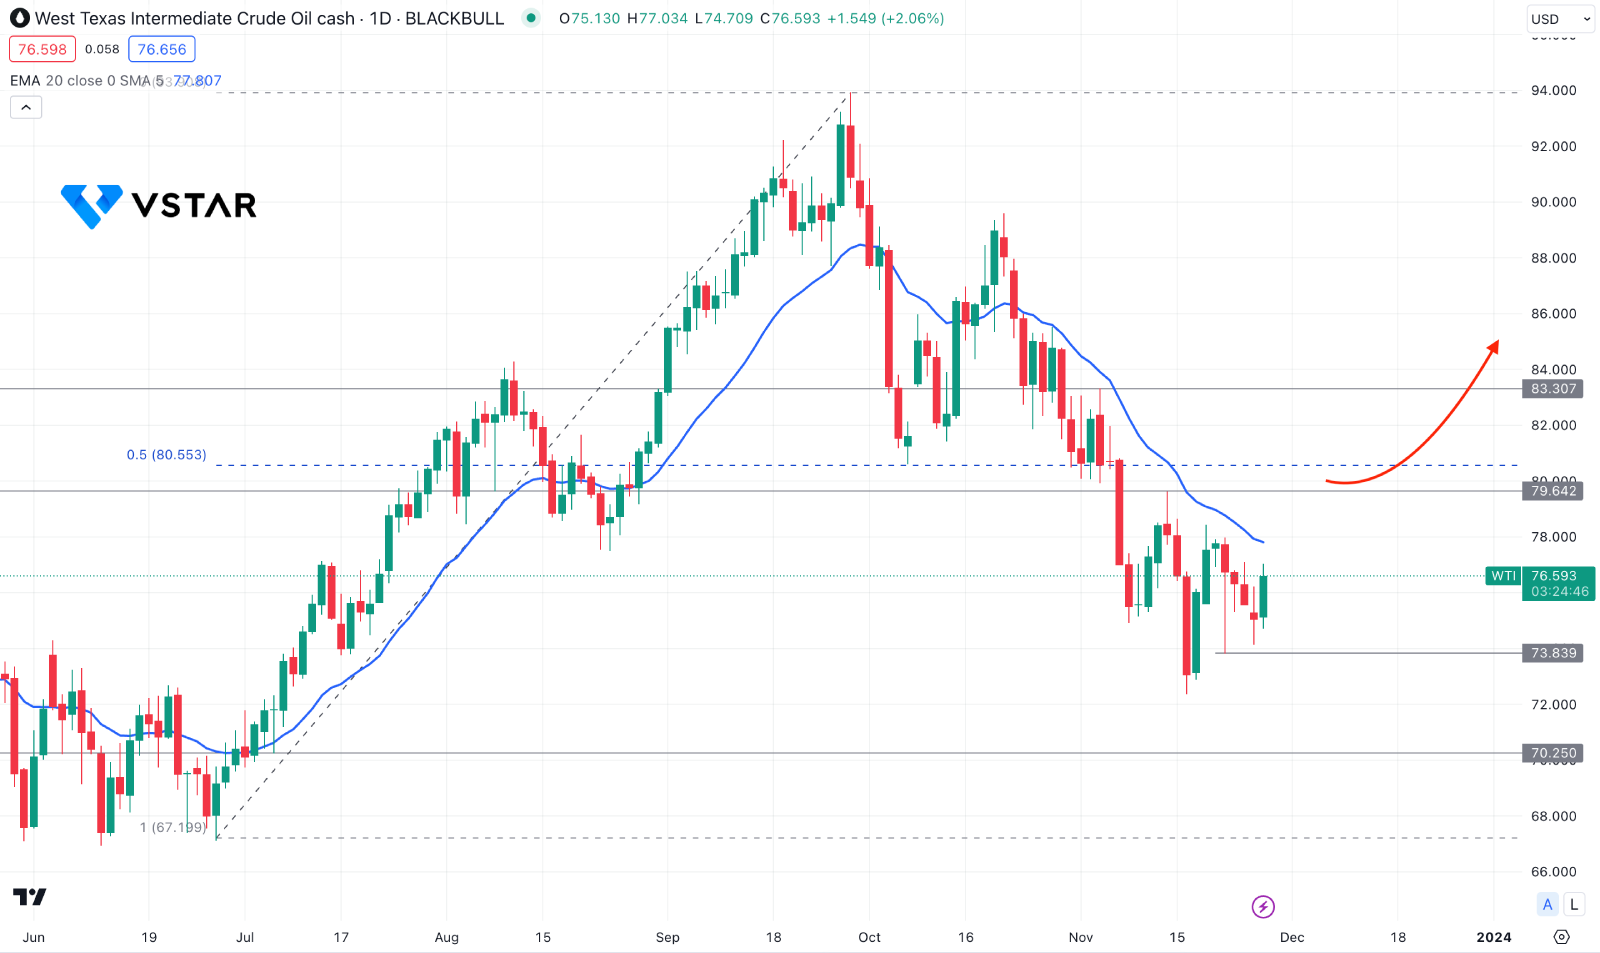
Considering the long-term bullish swing from the 67.19 low to the 94.00 high, the 50% Fibonacci Retracement level is at the 80.550 level. As the current price trades below the crucial Fibonacci Level, we may consider it a discounted zone. Therefore, as long as the price trades at this zone, any long setup could provide a higher return.
Based on the daily structure, bullish support from the fundamental outlook with a daily close above the 79.64 level could be a valid long opportunity, targeting the 94.00 high.
The alternative approach is to find a bearish rejection from the 78.00 to the 80.550 zone with a valid candle close below the 20 EMA. In that case, the downside momentum could extend the price toward the 70.25 low.


