


The anticipation surrounding the forthcoming product launch by Xiaomi at the Mobile World Congress (MWC) and the robust financial performance could be crucial factors to look at. Notwithstanding the current market uncertainties, the ongoing price action also offers a decent trading opportunity in this stock.
Xiaomi Stock Growth Factors
The MWC is an essential platform for technology companies to introduce their most recent advancements. The potential involvement of Xiaomi and the introduction of its products at this occasion may represent a crucial juncture for the business, garnering the interest of investors and consumers alike.
As a crucial indicator of Xiaomi's future performance, the fourth-quarter results of 2023 will be utilized. Optimal financial results are expected to enhance investors' confidence in the organization's capacity for expansion and operational effectiveness.
Xiaomi's Earnings Projection Is Solid
Xiaomi is a compelling investment prospect, boasting a Price/Earnings (P/E) ratio of 15.54 and a market capitalization of $166.72 million USD. Upon accounting for the preceding twelve months as of the second quarter of 2024, the price-to-earnings (P/E) ratio marginally declines to 15.01, suggesting a potentially advantageous trajectory for earnings.
As indicated by revenue metrics, Xiaomi has observed a significant quarterly revenue growth of 21.43% in Q2 2024. These figures highlight the successful diversification of the organization's revenue streams. Notwithstanding its modest gross profit margin of 6.89%, Xiaomi sustains a profitable operation.
Moreover, the organization maintains a cash surplus over debt, securing its financial stability. Further, value investors are attracted to Xiaomi due to its low revenue valuation multiple.
Xiaomi Stock Technical Analysis

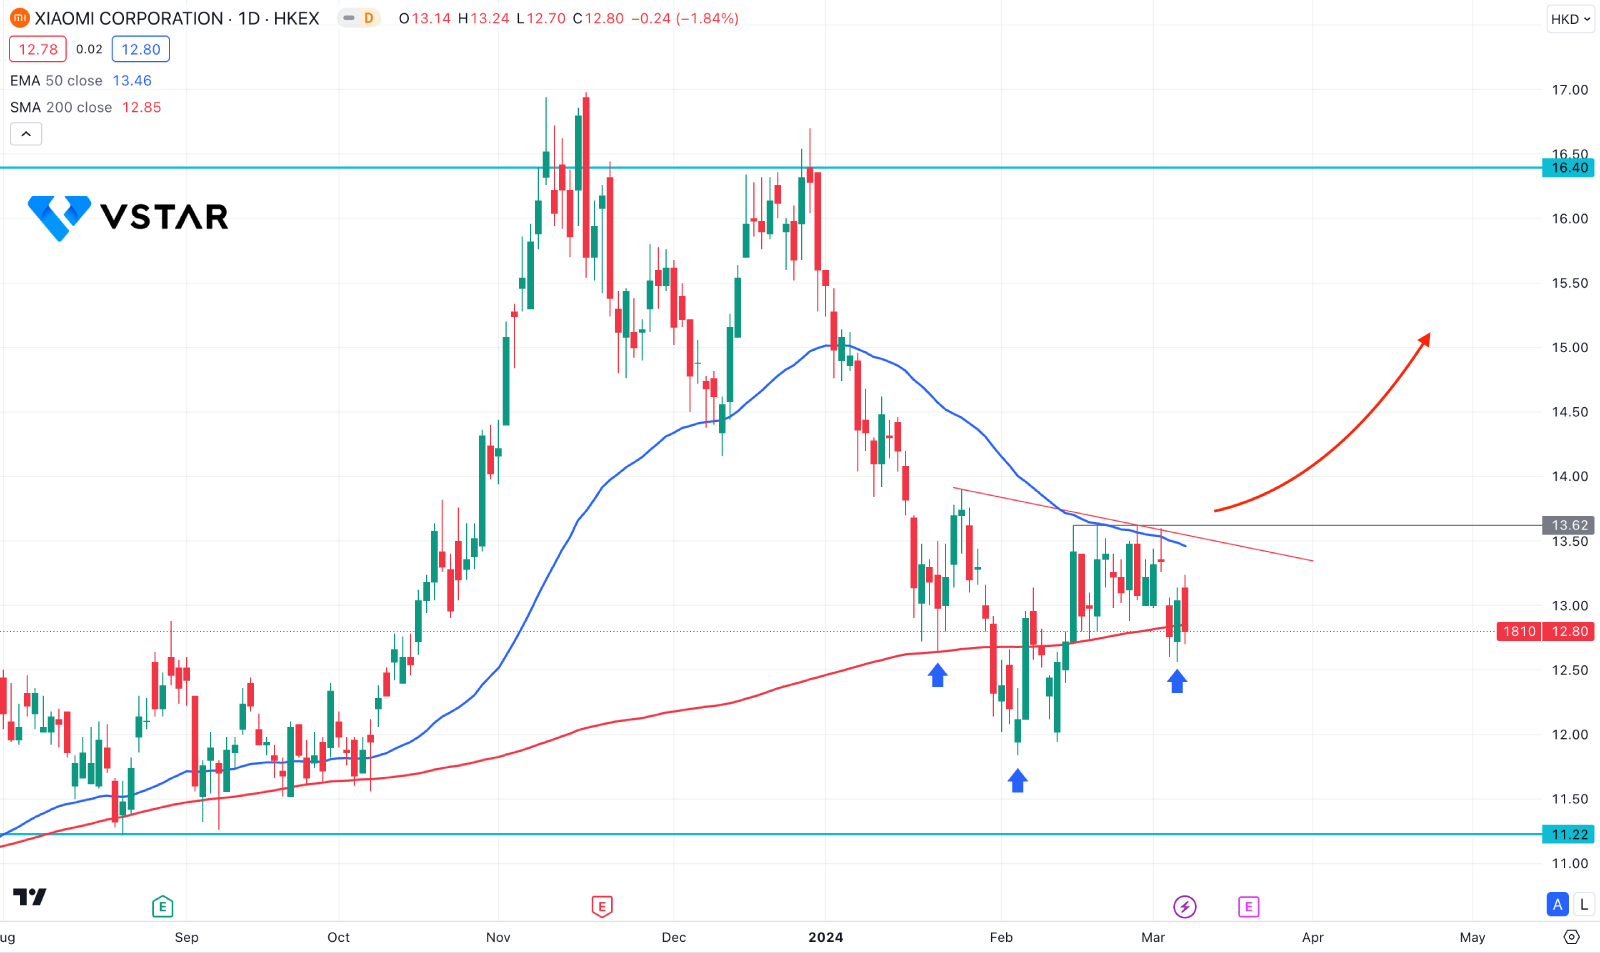
In the daily chart of Xiaomi stock price, the ongoing price action is corrective momentum, while the existing market trend is bearish. In that case, the primary outlook for this stock is to seek short opportunities until a significant bullish signal appears.
In the main chart, the 200-day Simple Moving Average is a major support as the current price hovers at this level. A successful bullish pressure from this line with a daily candle above the 50-day EMA could be a potential Golden Cross continuation signal.
On the other hand, an inverse Head & Shoulders pattern could be a potential long opportunity. However, a successful bullish breakout above the neckline resistance is needed before validating the long signal
Based on this outlook, a bullish daily candle above the 13.62 level could be a strong bullish signal in this stock, targeting the 16.40 high. However, the failure to hold the price above the 200-day SMA could be a potential sell signal, targeting the 11.00 level.


