介绍
埃克森美孚公司是全球石油和天然气行业的领导者之一,业务遍及200多个国家和地区,凸显了其重要的地位和影响力。然而,与许多公司一样,埃克森美孚近年来遇到了一系列挑战,包括COVID-19大流行的影响、油价波动、环保法规的加强以及来自可再生能源的竞争。
尽管存在这些障碍,埃克森美孚仍采取了积极主动的方法来适应不断变化的市场条件。该公司采取了降低成本和提高运营效率的措施,体现了其在快速变化的环境中保持竞争力的承诺。此外,埃克森美孚还对尖端技术进行了战略投资,并实现产品组合多元化,为各个行业的潜在增长机会做好了准备。
埃克森美孚公司概述
来源:Alphagamma
埃克森美孚公司由约翰·D·洛克菲勒于1870年创立,当时名为新泽西标准石油公司。该公司总部位于德克萨斯州欧文,与美国埃克森美孚公司和英国埃克森美孚有限公司拥有双重上市结构。该公司通过三个业务部门运营:上游业务、下游业务和化工业务。
埃克森美孚公司首席执行官是Darren W. Woods,他于1992年加入公司,在公司的各个职位上拥有超过25年的经验。该公司的最大股东包括Vanguard Group Inc.、BlackRock Inc.、State Street Corp.、Berkshire Hathaway Inc.和Geode Capital Management LLC。
公司历史上的一些关键里程碑包括:
- 1999年与美孚公司合并成立埃克森美孚公司,成为世界上最大的上市石油和天然气公司。
- 发现和开发一些世界上最大的油气田,如阿拉斯加普拉德霍湾、俄罗斯萨哈林岛、哈萨克斯坦卡沙干、南美洲圭亚那-苏里南盆地等。
- 在研究和创新方面处于行业领先地位,例如开发合成润滑油、催化裂化、3D地震成像、液化天然气(LNG)、碳捕获和储存(CCS)以及生物燃料。
埃克森美孚公司的商业模式和产品/服务
来源:彭博社
埃克森美孚如何赚钱
埃克森美孚通过勘探、生产、精炼、运输、营销和销售石油、天然气、石油产品和石化产品来赚钱。该公司还通过发电、采矿和技术许可等其他来源产生收入。
该公司的收入受到产量、油气价格、炼油利润、化工利润、汇率以及供需动态等多种因素的影响。
主要产品和服务
埃克森美孚为其客户提供各种产品和服务,例如:
- 石油和天然气:该公司从常规和非常规来源生产原油和天然气,例如陆上和海上油田、页岩地层和深水油藏。
- 石油产品:该公司将原油精炼成各种石油产品,如汽油、柴油、航空燃油、取暖油、润滑油和沥青。
- 石化产品:该公司利用液化天然气(NGL)和乙烯、丙烯、丁烯、苯、甲苯和二甲苯等其他原料生产石化产品。
- 其他产品和服务:该公司还提供其他产品和服务,例如天然气或可再生能源发电;煤炭或金属开采;其专有工艺或催化剂的技术许可;以及工程或项目管理服务。
埃克森美孚公司的财务、增长和估值指标
资料来源:金融时报
埃克森美孚公司财务报表审查
市值:截至2023年7月11日,埃克森美孚公司的市值为2,587亿美元。
净利润:埃克森美孚公司报告2023年第二季度净利润为79亿美元,假设稀释,每股收益为1.94美元。
收入增长:埃克森美孚公司2023年第二季度收入下降17.5%至629亿美元,而2023年第一季度为765亿美元。收入下降主要是由于石油和天然气价格较低。
利润率:埃克森美孚公司2023年第二季度的毛利率为15.8%,而2023年第一季度为17.7%。该公司的营业利润率为4.9%,而2023年第一季度为6.3%。净利润率为-1.2%,而2023年第一季度净利润率为0.7%。
股本回报率:埃克森美孚公司2023年第二季度股本回报率为-14.7%,而2023年第一季度为-10.2%。股本回报率为负主要是由于净亏损和股东增加所致由于发行新债而产生的股本。
资产负债表实力及影响:截至2023年6月30日,埃克森美孚公司经营活动产生的现金流为94亿美元。2023年第二季度该公司的资本和勘探支出为62亿美元。
该公司采取了多项措施来提高流动性并降低成本,例如:
-2022年以优惠条件筹集180亿美元的新债务
-2022年将资本支出减少35%至210亿美元,2023年再减少11%至16-190亿美元
-2020年运营支出削减15%至290亿美元,2022年再削减7%至270亿美元
-剥离部分非核心资产,例如挪威、英国、澳大利亚和印度尼西亚的上游资产
-尽管出现净亏损和负自由现金流,但仍将股息支付维持在每股0.87美元
主要财务比率和指标
为了评估埃克森美孚公司的估值,我们可以将其估值倍数(P/E、P/S、P/B、EV/EBITDA)与其同行和行业进行比较。然而,由于埃克森美孚公司报告2020财年出现净亏损,其市盈率意义不大。因此,我们将根据2022财年的预计收益使用远期市盈率。
根据雅虎财经的数据,截至2023年7月11日,埃克森美孚公司的远期市盈率为14.8,市盈率为1.4,市净率为1.6,EV/EBITDA比率为7.9。
下表显示了埃克森美孚公司的估值倍数与同行及行业的比较:
|
公司 |
远期市盈率 |
市销率 |
市净率 |
EV/EBITDA比率 |
|
埃克森美孚公司 |
14.8 |
1.4 |
1.6 |
7.9 |
|
雪佛龙公司 |
15.6 |
1.5 |
1.7 |
8.2 |
|
英国石油公司 |
10.2 |
0.6 |
1.2 |
5.4 |
|
荷兰皇家壳牌公司 |
9.9 |
0.7 |
1.3 |
5.6 |
根据该表,我们可以看到埃克森美孚公司的远期市盈率高于同行,这表明相对于其预期的盈利增长而言,其成本更高。
然而,埃克森美孚公司的市盈率、市净率和企业价值/息税折旧摊销前利润(EV/EBITDA)比率与同行相似或更低,这表明其相对于其销售额、账面价值以及息税折旧前利润更便宜和摊销。因此,我们可以得出结论,埃克森美孚公司的估值是好坏参半,具体取决于我们使用的倍数。
XOM股票表现分析
XOM股票交易信息
埃克森美孚公司的普通股在纽约证券交易所(NYSE)交易,股票代码为XOM。该公司还拥有在伦敦证券交易所(LSE)交易的美国存托凭证(ADR),代码为XONA。
该公司的主要交易所是纽约证券交易所,其主要货币是美元(USD)。
埃克森美孚公司的交易时间为东部时间(ET)工作日上午9:30至下午4:00,不包括美国市场假期。该公司还在周一至周五东部时间上午4:00至上午9:30进行盘前交易,东部时间下午4:00至晚上8:00进行盘后交易。
埃克森美孚公司自1970年首次公开募股以来已进行过五次股票分割,最近一次是2001年6月进行的2比1分割。
该公司自1911年以来一直维持派息,最近一次派息为2021年6月每股0.87美元,当时的股息率为5.7%。
XOM自IPO以来的股价表现
埃克森美孚公司于1970年11月18日首次公开募股,每股价格为0.63美元(根据股息和分割进行调整)。
2023年2月,其历史最高价为每股120美元,较IPO价格上涨16,452%。1970年12月18日,该公司的历史最低价为每股0.54美元,较IPO价格下跌14%。
截至2023年7月11日,该公司当前股价为每股61.32美元,较IPO价格上涨9,615%,较历史高位下跌41%。近年来公司股价波动较大,如下图所示:
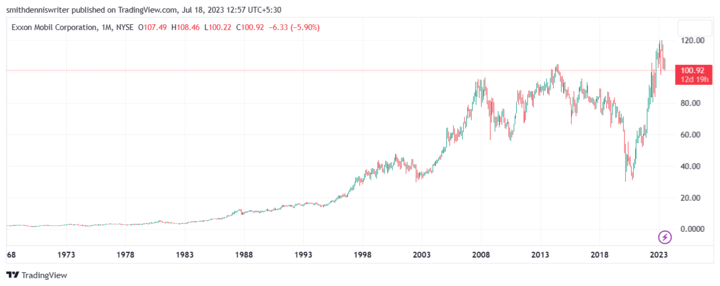
来源:TradingView
XOM股价预测
XOM股价走势分析
为了分析XOM股价的走势,我们可以使用移动平均线、趋势线、图表形态等技术指标。
移动平均线是显示股票在特定时期内的平均价格的线。它们可以帮助确定趋势的方向和强度,以及潜在的支撑位和阻力位。
趋势线是连接一段时间内股价高点或低点的直线。它们可以帮助识别趋势的方向和斜率,以及潜在的突破或击穿点。
图表形态是股票图表上形成的形状,表明趋势的延续或逆转。他们可以帮助确定潜在的交易进入点和退出点。
根据下图,我们可以看到,XOM股价自2014年7月以来一直处于下跌趋势,如红色向下倾斜的趋势线所示。自2018年10月以来,该股股价也一直低于50日和200日移动均线,表明看跌情绪。
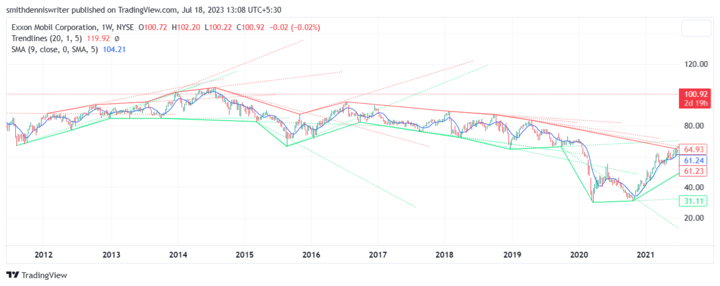
来源:TradingView
然而,我们也可以看到近几个月趋势可能逆转的一些迹象,如下图所示:
从2020年11月到2023年7月,XOM股票一直处于上升趋势。
股价从2020年3月到2023年7月形成了双底形态,这是一种看涨反转形态,标志着从下跌趋势转为上涨趋势。2020年11月突破颈线每股45美元左右,证实了这一模式。
股价还突破了2022年11月的50日均线和2023年2月的200日均线,显示出短期和长期的看涨势头。
股价在2023年3月和2023年4月也多次测试并反弹红色趋势线,表明可能出现上涨趋势。
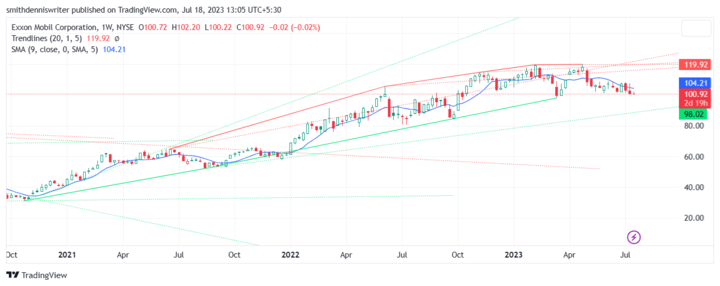
来源:TradingView
XOM股票的关键阻力位和支撑位
阻力位是指卖方数量往往超过买方的价格,从而对股价造成下行压力。支撑位是买家数量往往多于卖家的价格,从而对股价造成上行压力。
根据下图,我们可以确定XOM股票的一些关键阻力位和支撑位:
阻力水平
- 每股110美元,与2023年6月的前期高点和心理整数相吻合。
- 每股115美元,与2023年1月的前高点以及2022年7月至2023年6月下跌趋势的38.2%斐波那契回撤位相吻合。
- 每股120美元,与2022年10月的前高点和2022年7月至2023年6月下跌趋势的50%斐波那契回撤位相吻合。
支撑级别
- 每股95美元,与2022年12月的前期低点和双底形态的颈线重合。
- 每股90美元,与2022年11月的前期低点和红色趋势线重合。
- 每股85美元,与2022年3月的前低点和2022年2月的历史低点一致。
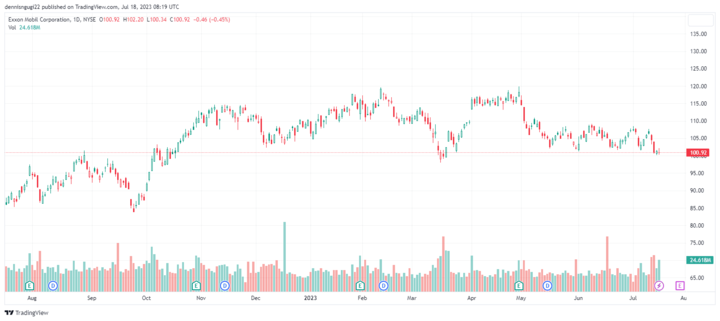
来源:TradingView
分析师建议和价格目标
分析师建议是金融分析师或专家对股票潜在表现给出的意见或评级。它们的范围可以从强力买入、买入、持有、卖出到强力卖出。价格目标是基于各种假设和模型对股票未来价格的估计。
据雅虎财经称,截至2023年7月11日,有25名分析师关注XOM股票。他们给出了以下共识建议:
- 买入:6位分析师(24%)
- 持有:15位分析师(60%)
- 卖出:4名分析师(16%)
下表显示了一些主要分析师的目标价以及基于当前每股61.32美元的股价所隐含的上行/下行空间:
|
分析机构 |
价格目标 |
隐含的上行/下行空间 |
|
摩根士丹利 |
57美元 |
-7% |
|
瑞士信贷 |
60美元 |
-2% |
|
巴克莱银行 |
64美元 |
4% |
|
摩根大通 |
65美元 |
6% |
|
高盛 |
72美元 |
17% |
|
瑞银集团 |
75美元 |
22% |
根据该表,我们可以看到平均目标价为每股65.50美元,较当前股价小幅上涨7%。最高目标价为每股75美元,较当前股价大幅上涨22%。最低目标价为每股57美元,较当前股价适度下跌7%。
风险/挑战和机遇
来源:埃克森美孚
竞争风险
主要竞争对手
埃克森美孚公司在全球市场上面临着来自其他石油和天然气公司的激烈竞争。其一些主要竞争对手包括:
- 雪佛龙公司:美国第二大、世界第四大石油和天然气公司,业务遍及180多个国家和地区。其细分领域包括上游、下游和中游。
- BPplc:世界第三大石油和天然气公司,也是欧洲最大的公司,在80多个国家和地区开展业务。其业务包括上游、下游、俄罗斯Rosneft(BP持有19.75%股份)以及其他业务。
- 荷兰皇家壳牌公司:世界第五大、欧洲第二大石油和天然气公司,业务遍及70多个国家和地区。其业务部门包括综合天然气部门、上游部门、下游部门和企业部门。
资料来源:Marketrealist
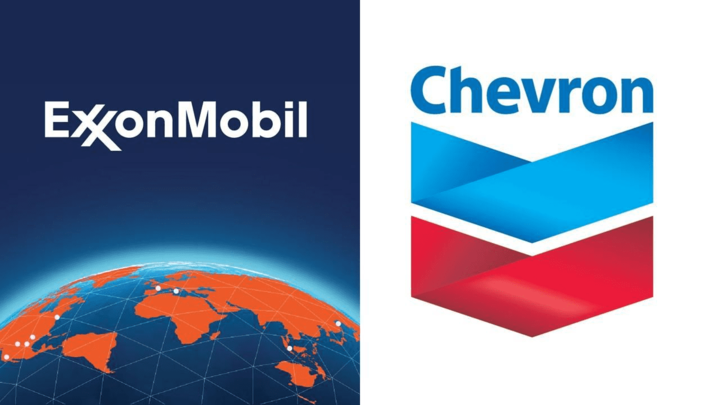
来自雪佛龙公司的威胁
雪佛龙公司对埃克森美孚公司构成重大威胁,原因如下:
- 在北美、拉丁美洲和非洲等一些关键地区,雪佛龙公司的市场份额高于埃克森美孚公司。
- 雪佛龙公司拥有比埃克森美孚公司更加多元化的资产组合,从传统资源到非常规资源,如页岩、致密油和液化天然气。
尽管存在这些竞争风险,埃克森美孚公司仍拥有许多优势,有助于其在全球石油和天然气市场上竞争。这些优势包括:
- 规模和规模:埃克森美孚公司是世界上最大的石油和天然气公司之一,业务遍及全球,拥有多元化的资产组合。这使该公司比规模较小的竞争对手具有显著的成本优势。
- 技术专长:埃克森美孚公司在创新和技术专长方面拥有良好的记录。这使得该公司能够开发新的石油和天然气资源并提高生产效率。
- 品牌声誉:埃克森美孚公司拥有强大的品牌声誉和忠实的客户群。这使该公司在产品营销和销售方面具有竞争优势。
其他风险
除了竞争风险外,埃克森美孚公司还面临其他可能对其业务和股票表现产生不利影响的风险,例如:
- 石油价格波动风险:石油价格由全球市场供需力量相互作用决定,并受到经济活动、地缘政治事件、技术发展、环境法规等多种因素的影响。
- 清洁能源转型风险:清洁能源转型是指从化石燃料向太阳能、风能、氢能和生物燃料等可再生能源的转变。清洁能源转型是由气候变化问题、政府政策、消费者偏好和技术创新等多种因素推动的。
- 运营风险:公司的运营涉及各种风险,如机械故障、事故、火灾、爆炸、溢出、泄漏、碰撞、恐怖主义、天气事件、自然灾害、疾病爆发、网络攻击和其他不可预见的事件。
成长机会
埃克森美孚公司拥有多种增长机会和驱动因素,可以增加未来的收入和盈利能力,例如:
- 石油和天然气行业的复苏:从长远来看,随着疫苗的普及和分发、经济活动的恢复和增长、旅行限制和建议的取消,石油和天然气行业预计将从COVID-19大流行中恢复过来。随着需求和供应动态趋于稳定。根据国际能源署(IEA)的数据,到2040年,全球能源需求预计将增长25%,石油和天然气行业拥有巨大且不断增长的市场潜力,可以推动未来的增长。
- 扩大在中国、印度、巴西和墨西哥等新兴市场的业务,这些市场由于人口、城市化、工业化和收入水平的增长,对石油和天然气产品和服务的需求迅速增长。
- 开发优质资源、低成本运营、长期回报的新项目,如南美圭亚那-苏里南盆地、德克萨斯州和新墨西哥州二叠纪盆地、亚太巴布亚新几内亚液化天然气、莫桑比克等非洲的液化天然气。
未来展望和扩展
埃克森美孚公司对未来抱有乐观的愿景,制定了雄心勃勃的扩张计划,旨在促进产量增长、增强现金流生成、维持股息支付以及投资低碳解决方案。展望未来,该公司的目标是从2019年到2025年实现产量年均增长2%至3%,最终到2025年达到每日500万桶油当量(boe/d)的里程碑。
此外,假设油价为每桶50美元,埃克森美孚的目标是到2025年每年产生高达300亿美元的自由现金流。值得注意的是,尽管2020年面临净亏损和负自由现金流,该公司仍致力于将股息支付维持在每股0.87美元每季度。
此外,该公司致力于环保实践,并计划到2025年投资30亿美元用于低碳解决方案。这项投资将重点关注碳捕获和封存(CCS)、氢技术、生物燃料和碳中和等关键领域。燃料。埃克森美孚对增长和可持续发展采取的多方面方法体现了其致力于为股东和地球塑造更美好未来的承诺。
来源:conetic
为什么交易者应该考虑XOM股票
出于多种原因,交易者应考虑XOM股票,例如:
- 根据P/S、P/B和EV/EBITDA等估值倍数,XOM股票相对于同行和行业被低估,这表明它比竞争对手和整个行业具有更高的升值潜力。
- XOM股票的交易价格也较大流行前的水平大幅折扣,这表明一旦石油和天然气行业恢复正常运营和需求,其就有很大的复苏空间。
- XOM股票还受到埃克森美孚公司强劲基本面的支撑,埃克森美孚公司是全球最大、盈利能力最强的石油和天然气公司,拥有多元化的资产组合、忠诚的客户群以及很大程度上尚未开发的市场潜力。
- XOM股票还受到埃克森美孚公司的积极前景和扩张计划的推动,该计划旨在提高产量增长、改善现金流生成、维持股息支付并投资低碳解决方案。
- XOM股票对于寻求高波动性和流动性的交易者也很有吸引力,因为由于油价波动、COVID-19大流行及其对石油和天然气行业的影响,股价大幅波动。该股票还具有较高的交易量和较低的买卖价差,因此易于买卖。
XOM股票的交易策略
交易者可以根据自己的风险偏好、时间范围和市场状况,对XOM股票使用各种交易策略。一些可能的交易策略包括差价合约交易、波段交易和日间交易
CFD交易:CFD代表差价合约,它是一种衍生品,允许交易者在不拥有基础资产的情况下推测其价格变动。差价合约交易具有多项优势,例如:
- 杠杆:交易者可以利用杠杆以比账户中更多的资金进行交易,这可以放大他们的利润或损失。
- 卖空:如果交易者预计价格会下跌,则可以卖空XOM股票,这意味着他们可以以更高的价格出售股票,然后以更低的价格买回,从差价中获利。
- 对冲:交易者可以通过在与XOM股票相关的另一种资产中建立相反头寸来对冲XOM股票的风险。
波段交易:XOM股票的波段交易是一种涉及持仓几天到几周的交易类型。波段交易者通常使用技术分析来识别市场趋势和模式,并根据这些趋势来进场和出场。
当日交易:XOM股票的当日交易是一种涉及单日持仓的交易类型。日间交易者通常使用技术分析来识别短期价格走势,他们希望在同一天内进场和出场。XOM股票的当日交易可能是一种非常有利可图的交易方式,但也存在很高的损失风险。日间交易者需要能够快速做出决策并快速执行交易,因为他们不断受到市场波动的影响。
在VSTAR交易XOM股票差价合约
如果你正在考虑交易XOM股票,这里有一个建议:查看VSTAR,全球最好的在线交易平台之一,用于交易XOM股票差价合约。VSTAR提供了一些很酷的优势:
- 成本低:VSTAR交易XOM股票差价合约的交易优惠且费用不太高。这可以帮助你规划交易策略并更好地应对风险。
- 安全可靠:VSTAR使用智能安全方法在你进行交易时保证你的个人和资金详细信息的安全。
- 易于使用:VSTAR拥有用户友好的设置和工具,使XOM股票差价合约交易变得简单。
- 随时提供帮助:如果你需要XOM股票差价合约交易方面的帮助,VSTAR的支持团队24/7全天候为你提供帮助,解决任何问题。
如果你想了解更多有关在VSTAR交易XOM股票差价合约的信息,你可以访问VSTAR的网站或联系VSTAR的客户支持团队了解更多详情。


结论
埃克森美孚公司不仅仅是一家石油和天然气公司。它是能源创新、技术和可持续发展领域的全球领导者。它在为客户、股东、员工和社会创造价值方面有着悠久而丰富的历史。它拥有多元化且富有弹性的资产组合,可以满足世界不断增长和变化的能源需求。它对未来有着积极而雄心勃勃的愿景,因为它的目标是增加产量、改善现金流、维持股息并投资低碳解决方案。
如果你对埃克森美孚公司(NYSE:XOM)股票感兴趣,你应该考虑在VSTAR交易XOM股票差价合约,这是世界上最好的在线交易平台之一。
*免责声明:本文内容仅供学习,不代表VSTAR官方立场,也不能作为投资建议。