When is the right time to enter or exit a trade in Amazon stock for maximum profit? If you are struggling with this question, your answer is technical analysis.
In technical analysis, you study a stock's price movements and market indicators to inform your trading decisions. By running Amazon stock through technical analysis, you can quickly identify potential profitable buying and selling opportunities.
Combining technical analysis with fundamental analysis can increase your profit opportunities. Fundamental analysis involves studying a company's financial health, competitive situation, and economic condition.
It is important that you have a good understanding of a stock's fundamentals before you consider it. For example, you need to make sure that the stock isn't going out of the market soon.
Think of fundamental analysis as an extra step in the process of identifying the best stocks to trade. Once you have established the stock's fundamental position, you can move on to see how the market is trading it.
This article will examine the technicals of Amazon stock and provide fundamental insights to help you trade AMZN stock profitably.
Before we dive into the details, let's first learn more about Amazon as a company.
Amazon (NASDAQ: AMZN) Overview
Amazon is an American technology company founded by Jeff Bezos in 1994. The company's operations are focused on two major divisions: e-commerce and cloud computing. Amazon also runs online advertising, digital media streaming, and hardware businesses. The company's hardware unit makes smart speakers, tablets, and television streaming devices.
With a market cap of about $1.3 trillion, Amazon is one of the largest technology companies in the world. Amazon's market cap hit a peak of about $2 trillion in 2021.
AMZN stock went public in 1997 at an IPO price of $18 per share. The stock soared more than 30% on its first day of trading, closing at $23.50.
Amazon Stock Split History
The e-commerce and cloud computing powerhouse has implemented 4 stock splits since its IPO. Amazon's first stock split was a 2-for-1 in June 1998. The second split was a 3-for-1 stock split in January 1999. The third AMZN stock split was a 3-for-1 in September 1999. The fourth Amazon stock split was a 20-for-1 in June 2022. Amazon's split-adjusted IPO price is $0.075.
Amazon News
Amazon-iRobot Acquisition Deal Cleared in UK
The U.K.'s antitrust regulator has cleared Amazon's acquisition of iRobot. Amazon still needs approval from U.S. and EU regulators before it can close the deal. Amazon struck a deal to buy iRobot, the maker of the Roomba robotic vacuum cleaner, for $1.7 billion.
Prime Members Could Get Free Mobile Service
Amazon is considering sweetening its Prime membership package with a free or low-cost mobile service plan. The company has opened talks with T-Mobile, Verizon, and Dish about supporting the Prime mobile service. There are about 167 million Amazon Prime members in the U.S. These members pay an annual or monthly subscription fee to unlock benefits such as express delivery of shopping orders.
Bezos Buys Amazon Stock
Amazon founder Jeff Bezos recently purchased a share of Amazon stock. Bezos, who owns 10% stake in Amazon stock, had not reported buying any additional Amazon shares since at least 2002. Instead, he has been selling portions of his stake in Amazon stock to fund various programs. But Bezos' purchase of only a single share of Amazon stock has left many guessing as to what exactly this mysterious move is supposed to show.
Inside Amazon's Fundamentals
Amazon Financial Results
Revenue and profit: Amazon's revenue increased 9% year over year to $127.4 billion in the first quarter of 2023, beating the consensus estimate of $124.5 billion. Amazon's revenue has increased at a compound annual growth rate of 17% over the past 5 years.
Cash position and balance sheet condition: Amazon ended the first quarter with more than $64 billion in cash. The company's balance sheet is in a good shape, showing a current ratio of 0.92 and a debt-to-equity ratio of 0.91.
Amazon Stock Price History
Amazon's stock price has grown tremendously since the company went public in 1997. Amazon debuted on the NASDAQ with an opening price of $18 per share, giving the company a market valuation of $438 million at the time. The dot-com crash of the early 2000s brought Amazon's stock to a low of $5.51 per share in 2001. However, the company rebounded and saw steady growth throughout the 2000s, trading between $40 and $90 per share by 2010.
Amazon's stock really took off in the early 2010s with the growth of cloud computing, the emergence of new businesses like Amazon Web Services, and the increasing dominance of e-commerce. The stock first hit $100 per share in late 2011 and reached $1,000 per share for the first time in October 2017. Amazon's market capitalization surpassed $1 trillion in September 2018. More recently, Amazon stock hit all-time highs above $3,700 per share in July 2022 before declining amid broader market weakness. The company has completed three stock splits in its public history to maintain a reasonable price per share. Overall, Amazon stock has delivered a compound annual growth rate of more than 30% since its IPO, rewarding early investors.
Factors that Impact Amazon Stock Price
- Amazon News: One of the factors that affect Amazon's stock price is news about Amazon's operations, financial performance, and competitive position.
- Amazon Earnings report: Amazon stock price tends to rise when the company's earnings results beat expectations and fall when the earnings disappoint.
- Economic condition: A booming economic condition can lift AMZN stock, but a tough economic environment can exert downward pressure on the stock as the company struggles to grow its sales.
- Regulations: Tightening or evolving regulatory measures can cause market uncertainty and weigh on Amazon's stock price.
Amazon's Market Share
Online retail: Amazon controls about 38% of the U.S. e-commerce retail market. This puts it well ahead of domestic rivals Walmart, eBay, and Target. Amazon's share of the global online retail market is estimated at about 15%.
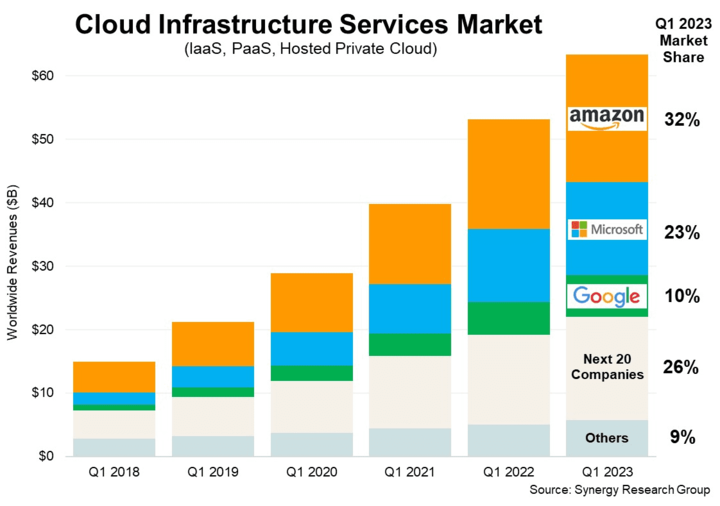
Cloud computing: Amazon dominates the global cloud computing industry with 32% market share. This puts it well ahead of Microsoft with 23% of the cloud market share, Google with 10%, and Alibaba with 4%.
Amazon's Competitive Advantages
Strong balance sheet: Amazon has substantial cash and manageable debt. Consequently, the company boasts greater financial flexibility than many of its competitors.
Diversified business: Amazon's operations span retail, cloud computing, advertising, and media. Therefore, the company has spread its risks across multiple industries.
Global footprint: Amazon's e-commerce business has significant global reach that allows the company to capture more sales than many of its competitors. Moreover, its massive global footprint provides economies of scale.
Strong brand: Amazon is among the most recognized brands in online retail, cloud computing, and artificial intelligence.
Amazon's Addressable Market
Across its major operation areas such as e-commerce, cloud computing, digital advertising, and video streaming, Amazon's addressable market is nearly $8 trillion by 2030. For a company that currently generates just over $500 billion in annual revenue, Amazon still has a huge growth opportunity ahead given the size of its addressable market.
Amazon Stock Forecast
The average Amazon stock price prediction of $138 implies an upside of 10%. The peak AMZN target price of $165 implies over 30% upside. The base Amazon stock prediction of $111 implies a downside potential of 10%.
Amazon Stock (NASDAQ: AMZN) Technical Analysis
At the current price of about $125, Amazon stock has surged nearly 170,000% over the split-adjusted IPO price of $0.075. AMZN stock has traded in the range of $81 - $147 over the past year. The stock has gained about 55% over its 52-week low but trades 15% below its 52-week high.
Is Amazon stock a good buy?
Amazon stock has surged more than 45% since the beginning of 2023, outpacing the broader market as the S&P 500 is up just 15% in the same period.
Analysis of Key Technical Indicators For AMZN Stock
AMZN Stock Price Moving Averages Analysis
Moving averages are highly popular technical indicators. Traders use moving averages to identify price trends or directions of price movements.
Moreover, moving averages can also help traders determine price support and resistance levels. The support level is the point at which a stock price is less likely to drop below. On the other hand, the resistance level is the point at which the price is less likely to break above.
There are two main types of moving averages: simple moving average (SMA) and exponential moving average (EMA). The difference between the two is that the EMA tracks the current market price more closely than the SMA. Therefore, the EMA is more popular with short-term traders because it enables them to recognize price changes more quickly.
Moving averages can be calculated for different periods. The most commonly used moving average periods are 20-day, 50-day, and 200-day. The shorter the period, the faster the moving average. Therefore, the 20-day moving average is faster than the 50-day moving average. Similarly, the 50-day moving average is faster than the 200-day moving average.
Interpreting AMZN Stock Moving Average Indicators
1. Price Crossover
The chart below shows Amazon stock's daily price action since January 2023. The current price of Amazon stock is represented by the blue line and the 20-day moving average is represented by the orange line.
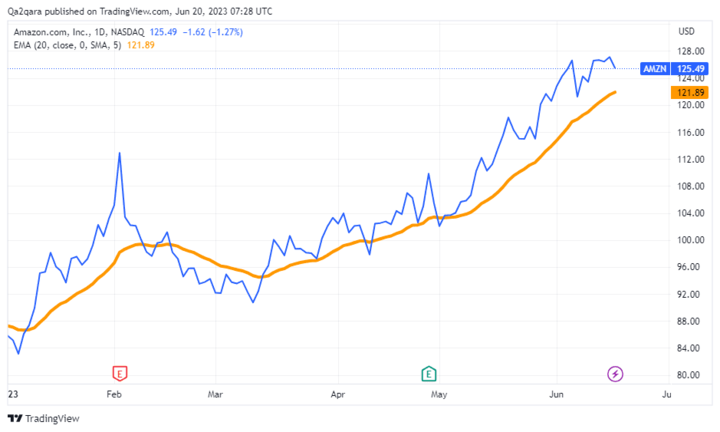
You can look at the current price and moving average crossings to gauge whether AMZN stock is likely to go on an uptrend or a downtrend.
When the current market price crosses above the moving average, this indicates that an uptrend is imminent.
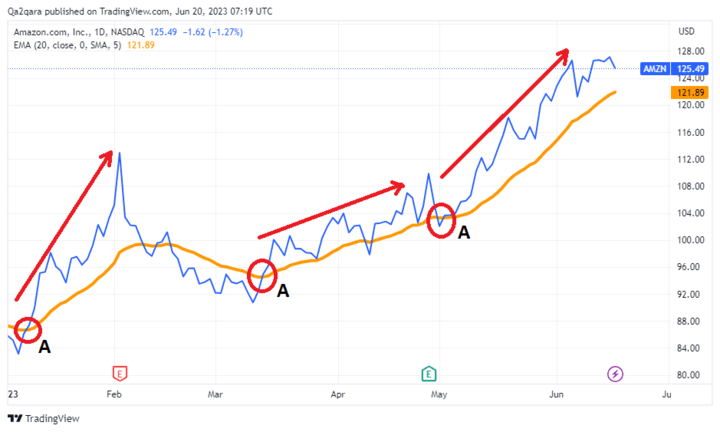
In the chart above, the points labeled "A" show the current price of Amazon stock (blue line) crossing the 20-day moving average (orange line). As you can see in the chart, AMZN stock has been on an upward trend following these crossings.
Therefore, it can be a good time to enter a long trade in Amazon stock when the current price crosses above the moving average.
Conversely, the current price crossing below the moving average indicates that a downtrend is imminent. The point labeled "B" in the chart above shows the current price of Amazon stock (blue line) crossing below the 20-day moving average (orange line). As you can see, AMZN stock went on downtrends following the downward crossing.
Therefore, it can be a good time to enter a short trade in Amazon stock when the price crosses below the moving average.
In June 2023, Amazon stock price stayed above the 20-day MA, showing that the stock is in an uptrend.
2. Moving Averages Crossing
You can plot several moving averages to determine a trend. In an upward trend, the faster moving average will be above the slower moving average. Conversely, the slower moving average will be above the faster moving average in a downward trend.
The chart below illustrates the price action of Amazon stock and the relationship between two moving averages for different periods. The candlesticks represent the current Amazon stock price, the orange line represents the 20-day moving average, and the blue line represents the 50-day moving average.
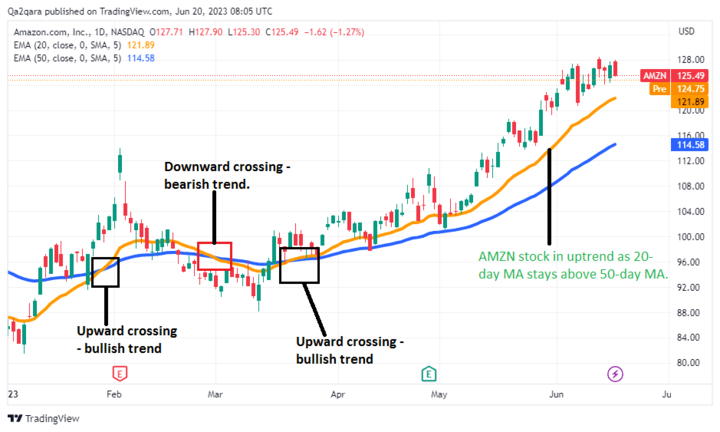
As you can see, bullish signals are generated when the 20-day moving average (orange line) crosses above the 50-day moving average (blue line). Similarly, a bearish signal is generated when the orange line crosses below the blue line.
Moreover, the stock is in a general uptrend as long as the orange line is above the blue line. In June 2023, Amazon stock has been on an uptrend as you can see that the price is above both the 20-day MA and the 50-day MA.
3. Support and Resistance Levels
Moving averages can also act as dynamic support and resistance levels. In an uptrend, moving averages can act as support levels, providing a floor for the price to bounce off. In a downtrend, moving averages can act as resistance levels.
The chart below shows the price action of Amazon stock for portions of May and June 2023. The 20-day MA is represented by the orange line, the 50-day MA by the blue line, and the 100-day MA by the green line.
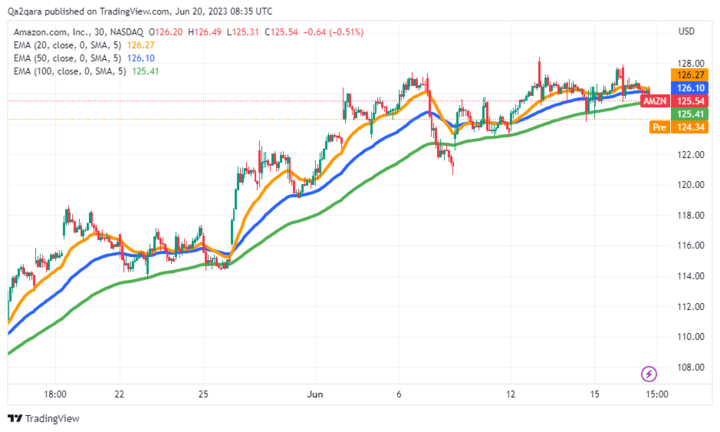
As you can see, the 20-day MA acted as the stock's first support level. When that was breached, the 50-day MA became the next support level. When that was also breached, the 100-day MA provided the next support floor.
Amazon Stock Relative Strength Index (RSI) Analysis
The Relative Strength Index (RSI) is a momentum indicator. It measures the speed and magnitude of a stock's recent price movements. The RSI reading falls in the range of 0 – 100. A stock's RSI reading changes based on its average gains and losses, usually over a 14-day period.
Traders use the RSI reading to determine whether a stock is overbought or oversold.
A stock is considered overbought if it has climbed too fast to a level above its true value. Traders see an overbought stock as poised for a downside reversal and may short it to profit from the price pullback.
On the other hand, a stock is considered oversold if it has dropped too low to a level below its true value. Traders see an oversold stock as primed for an upside reversal and may enter a long trade in it to profit from the rebound.
Interpreting the AMZN Stock RSI Reading
Studying the RSI reading can provide you with various signals to inform your AMZN stock trading decisions. These are some of the signals you can obtain from reading the RSI.
1. Overbought Signal
An RSI reading above 70 indicates that a stock is overbought, and that provides a signal to enter a short trade.
The chart below shows the price action and RSI readings of Amazon stock from January 2023. The RSI reading, represented by the purple line, is below the price chart. The stock reached overbought levels in early February, mid-May, and early June as illustrated in the chart.
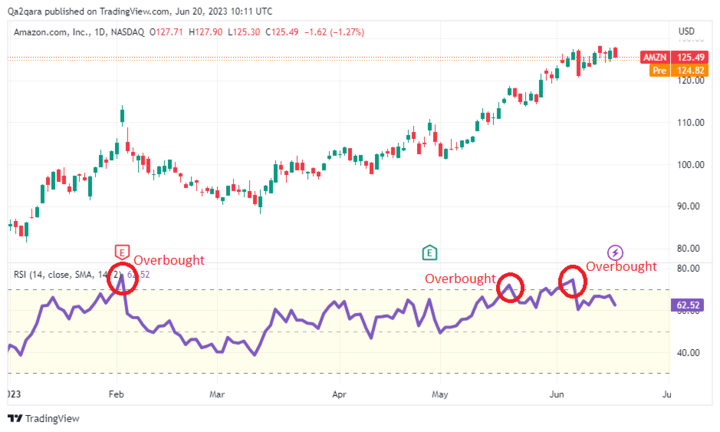
As you can see, Amazon stock pulled back every time the RSI reading crossed above 70.
While you can clearly see the overbought points for AMZN stock, all you can see is that the stock's RSI has stayed near 70 for an extended period of time. During an uptrend, the RSI can often reach 70.
2. Oversold Signal
An RSI reading below 30 generally indicates that a stock is oversold. At this point, traders see an opportunity to go long.
But a stock's oversold level as captured in RSI reading can be above 30 in a generally bull market. Being that Amazon stock price has generally been on an uptrend in 2023, the stock's RSI reading hasn't dipped below 30. Instead, the points labeled "B" in the chart below show, in the early months of the year, traders saw RSI readings below 40 for AMZN stock as signaling oversold levels.
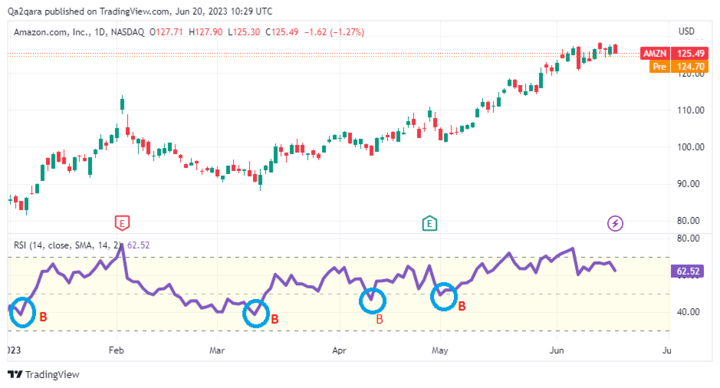
As the uptrend in AMZN stock has continued in recent months, RSI readings below 50 have drawn waves of buyers.
Amazon Stock Bollinger Bands Analysis
Bollinger Bands are a popular technical indicator tool that you can use to monitor market breakouts and identify profitable trading opportunities.
Bollinger Bands consist of three lines: An upper band, a middle line, and a lower band. The upper and lower bands are set at standard deviation marks from the center line. And the centerline is a simple moving average, usually a 20-period moving average.
The price tends to bounce between the bands. Many traders use Bollinger Bands to check overbought and oversold levels as part of determining which direction the price might move next. Therefore, you can combine Bollinger Bands with the RSI reading to check the overbought and oversold conditions of Amazon stock.
Moreover, Bollinger Bands measure market volatility. The market is considered less volatile when the bands are squeezed close together. On the other hand, volatility is high in the market when the bands are far apart.
Interpreting AMZN Stock Bollinger Bands Indicators
1. Trend Reversal Signals
When the price breaks above the upper band, the stock is considered overbought and a pullback can be expected.
The chart below shows AMZN stock price action for portions of May and June 2023. You can see Amazon stock pulling back after crossing above the upper band at the points marked "A".
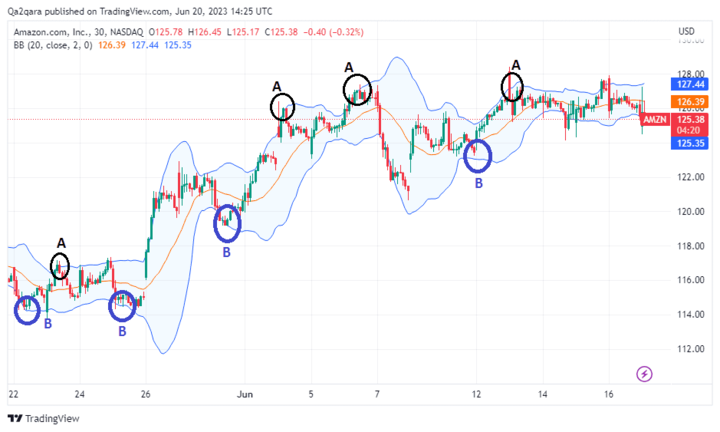
When the price breaks below the lower band, the stock is considered oversold and a bounce back can be expected. You can see this in the chart where Amazon stock hits the lower band at the point marked "B" and then reverses course in an uptrend.
2. Breakout Signals
You can use Bollinger Bands to identify breakouts in Amazon stock for trading opportunities. A breakout occurs when a stock price moves aggressively either up or down after a period of consolidation. Bollinger Bands offer traders a visual way to monitor breakouts.
A market consolidation is represented by squeezed bands, as you can see in the chart below.
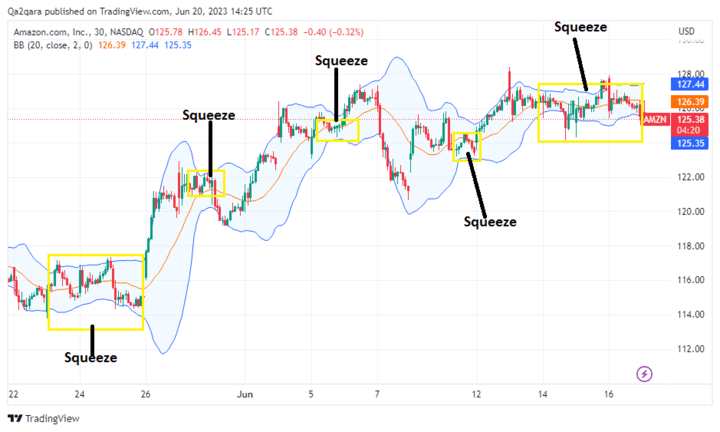
When the bands squeeze together, it is usually a sign that a breakout is coming. As you can see in the chart, AMZN stock broke out after the consolidation phases. Looking at where Amazon stock price is now, as shown in the chart above, a consolidation is going on and a breakout could follow soon.
Amazon Stock MACD Analysis
The MACD (Moving average convergence divergence) is a powerful technical tool used widely by traders. The MACD indicator has four components as described below:
- MACD line
- Signal line
- Histogram - represents the difference between the MACD line and the Signal line. Histogram turns green when the MACD crosses above the Signal line. It turns red when the MACD crosses below the Signal
- Zero line - represents the center of the MACD indicator.
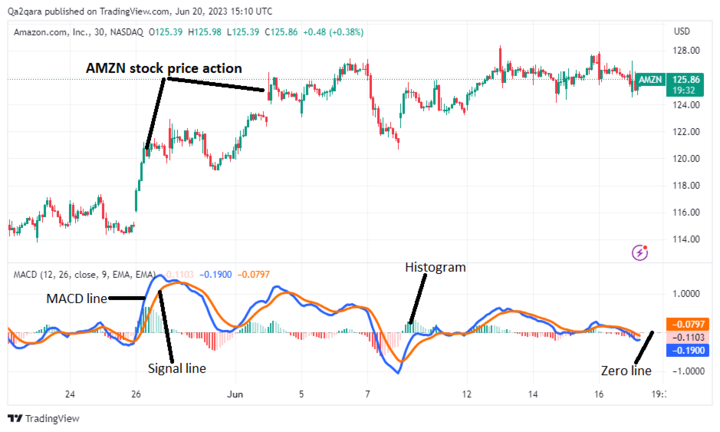
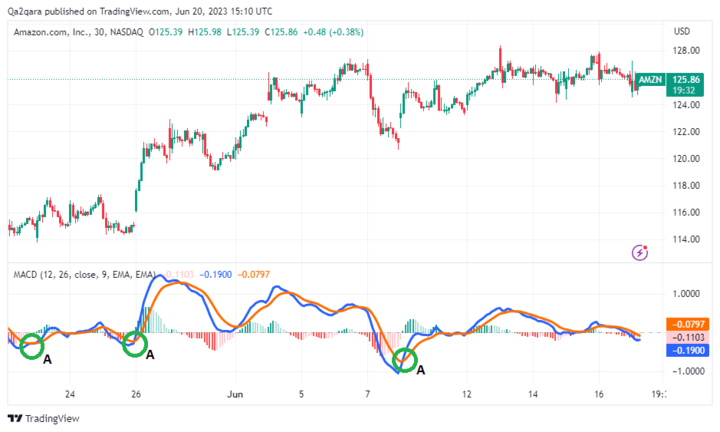
The chart above shows Amazon stock price action along with the MACD indicator. Many traders use the MACD indicator as a signal to enter or exit trades.
Interpreting Amazon Stock MACD Indicators
1. Crossover Signals
When the MACD line moves above the Signal line, it indicates that the stock is about to go on an uptrend. This can be a good time to enter a long trade. Conversely, a downtrend signal is generated when the MACD line moves below the Signal line. This can be a good time to enter a short trade.
In the chart below, the points marked "A" show the MACD line crossing above the Signal line. You can see that these crossings are followed by upward movements in AMZN stock price.
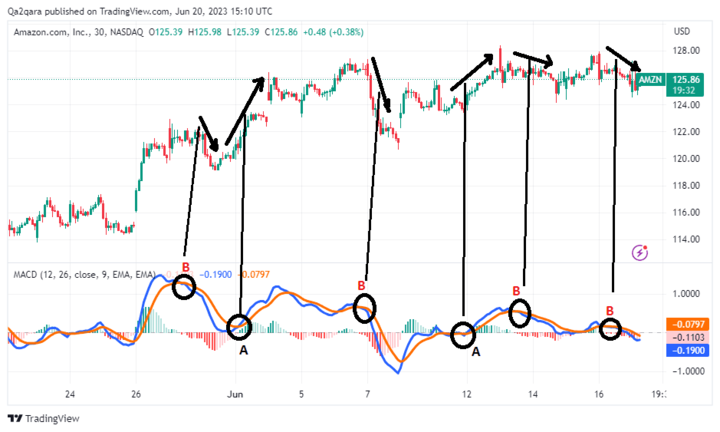
Similarly, you can see Amazon stock going on a downtrend after the MACD line crosses below the Signal line at the points marked "B".
2. Zero Line Cross
When the MACD line moves up from below the zero line, it generates a bullish signal. This can be a good time to go long in Amazon stock. Conversely, a bearish signal is generated when the MACD line moves down from above the zero line. In the chart below, the points marked "A" show bullish crossings.
3. Histogram Signals
The MACD histogram measures the market momentum. If the stock price is increasing rapidly, the histogram bars become longer. On the other hand, shorter bars show decreasing speed of price movements. Moreover, green bars indicate that the trend is turning bullish and red bars signal that the trend is turning bearish.
In the chart below, you'll notice that the bars turn green when the MACD line crosses above the Signal line. Similarly, the bars turn red when the MACD line crosses below the Signal line.
Studying the MACD histogram can help you spot an impending trend chance ahead of the market.
Using Amazon Stock Chart Patterns to Identify Trading Opportunities
Traders consider chart patterns as the basis of technical analysis. These patterns appear as specific shapes in the price action chart. Traders study chart patterns to get ideas on which direction the price might move next.
Chart patterns come in broad varieties, but they can be put into two main groups: continuation patterns and reversal patterns. Continuation patterns signal that the existing trend will continue. On the other hand, reversal patterns signal that the existing trend will change direction.
Therefore, you can study chart patterns along with other analysis techniques to identify opportunities to buy or sell Amazon stock.
These are the chart patterns of Amazon stock that traders would do well to know:
1. Head and Shoulders Chart Pattern
The head and shoulders chart pattern is a trend reversal indicator. It appears as a series of three peaks with the center peak raising higher than the rest. All of these peaks fall back to the same support level, also called the neckline, as you can see in the chart below.
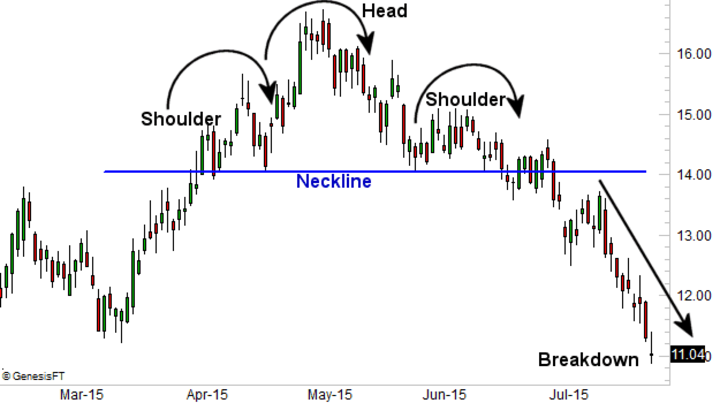
Source: Bigtrends.com
If this chart pattern interrupts an uptrend, a reversal to a downtrend can be expected to follow. If it interrupts a downtrend, a reversal to an uptrend can be expected to come next.
2. Double Top Chart Pattern
The double top chart pattern is a trend reversal signal. The pattern resembles the letter "M" with almost equal peaks as you can see in the chart below.
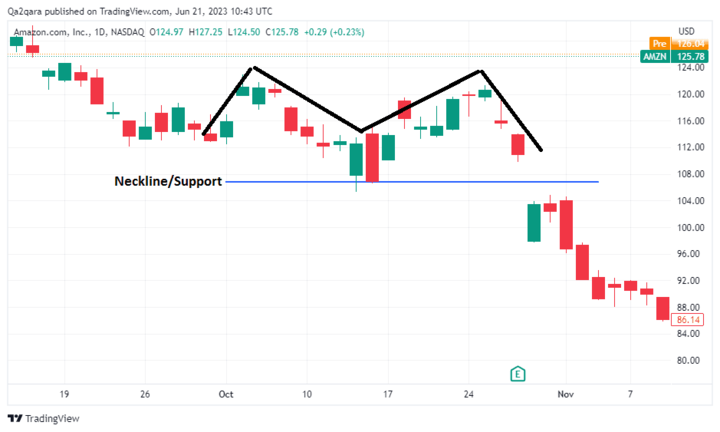
The double top pattern shows the price making an initial push up before reversing to the support level. The price attempts another push up but fails to sustain it and drops below the support level. When the double top pattern appears, you can expect the stock to go on a downtrend.
3. Double Bottom Chart Pattern
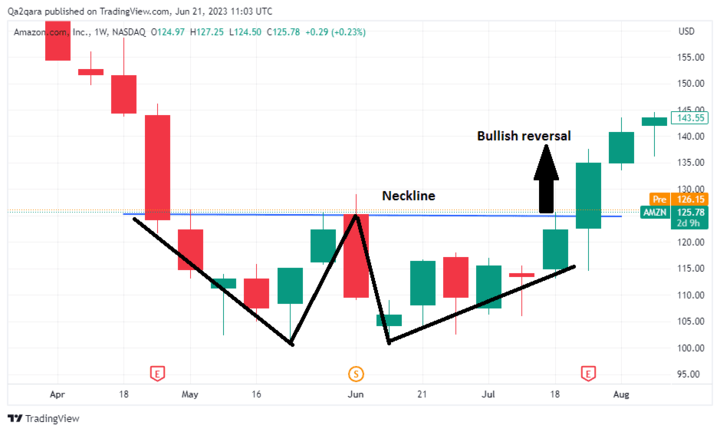
The double bottom pattern is another trend reversal indicator. The pattern has the shape of the letter “W” and signals the end of a downtrend and the start of a bullish reversal as you can see in the chart above.
4. Cup and Handle
The cup and handle chart pattern is a trend continuation signal. It shows that a bullish trend is likely to continue. The pattern is shaped like a cup with a handle to the right.
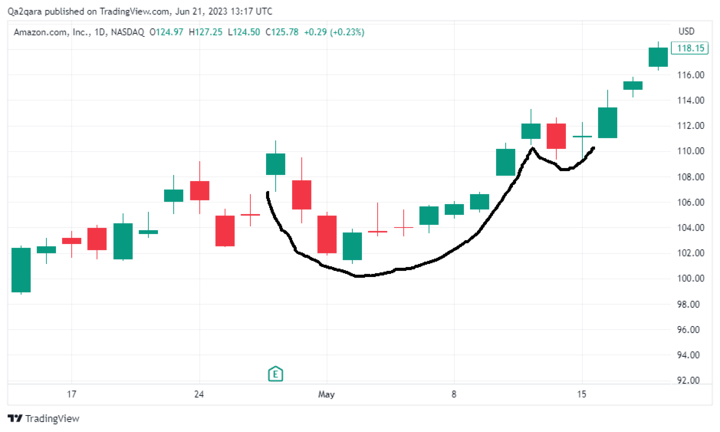
The cup handle represents a brief pullback in an upward trend as illustrated in the chart above.
5. Flag Chart Pattern
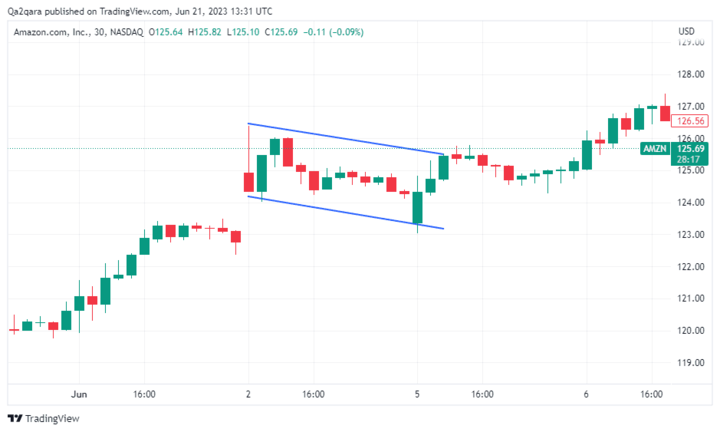
The flag chart pattern is a trend continuation signal. The flag shows a temporary pause in a trend. A flag with an upward slope signals that a downtrend will continue. On the other hand, a flag with a downward slope signals that an uptrend will continue, as you can see in the chart above.
Amazon Stock Trading Strategies
1. Trend-Following Trading
A trend trader looks for a continuation of a move. If Amazon stock is in an uptrend, a trend-following trader expects the stock to keep going up. Similarly, if the stock is in a downtrend, a trend trader expects it to keep going down.
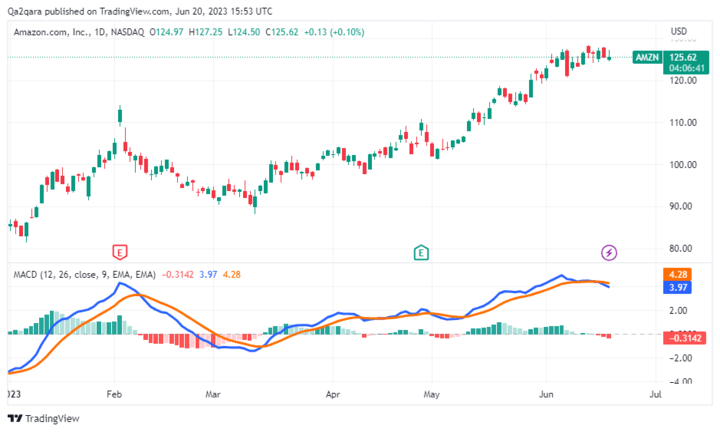
As you can see in the chart below, Amazon stock was in a downtrend between February and March 2023. As a result, this period presented a great opportunity for trend-following traders to profit from Amazon stock's downtrend.
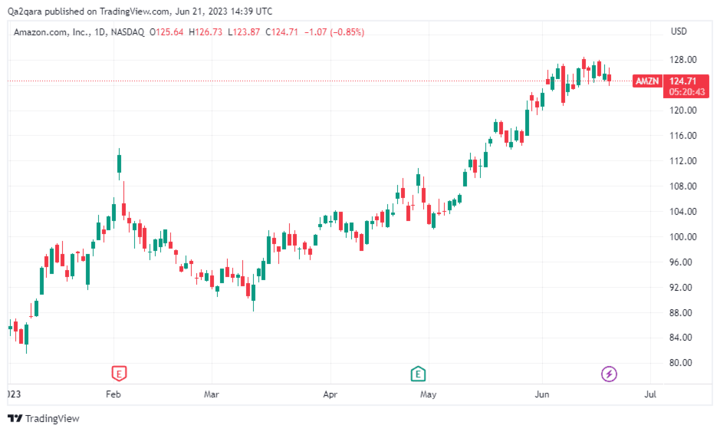
The chart also shows that AMZN stock has generally been on an uptrend between May and June 2023. As a result, trend traders have an opportunity to profit from Amazon's upswing.
To be successful with the trend-following trading strategy, you need to study chart patterns and technical indicators to gauge whether a trend is likely to continue or reverse.
In order to apply the trend-following strategy, the market should be in a trend. It could be a bullish trend or a bearish trend. These are very important conditions.
While trend trading can be lucrative, you can only apply this strategy in a trending market. It doesn't work when the market is moving sideways or consolidating.
Pro trend traders know that risk management is important. When trading an uptrend, consider placing your stop-loss just below the support level. When trading a downtrend, the stop-loss should be placed just above the resistance level.
2. Mean Reversion Trading
The mean reversion trading strategy is based on the theory that the price is always going to revert to its mean.
Stocks generally tend to trade around their mean valuation. But they occasionally keep moving away from the mean. The extreme moves can be caused by traders reacting to news or other unusual events. But these extreme moves are usually temporary as the stock will eventually revert to trading around its mean valuation.
Therefore, the mean reversion strategy relies on the stock price to go back to normal after moving away from its average price.
The Bollinger Bands is a popular technical tool among mean reversion traders.
If a stock has gone down too much, mean reversion traders will expect it to rise again. As a result, they'll enter a long trade in the stock because they hope it will rebound from that low position. If the stock has gone up a lot, mean reversion traders will go short because they expect the stock to go back down to its mean value.
In mean reversion trading, you're assuming that big moves will reverse. Therefore, it is important to include risk management techniques in your trading strategy.
You can use the Bollinger Bands to set your stop-loss and take profit levels. If you enter a long trade, consider placing the stop-loss at the lower band and the take profit upper band. Similarly, in a short trade, you can set the stop-loss near the upper band and the take-profit below the lower band.
Whether you're applying the trend trading or mean reversion strategy, another important risk management technique to remember is that you should never risk more than 1% of your capital in a trade.
Why Trade Amazon Stock CFD?
Trading stock CFDs is a lightweight method to profit from stock movements. In CFD trading, you profit from correctly predicting what direction the stock price will move.
CFD trading profit is calculated by multiplying the difference between the closing and opening prices by the number of CFD contracts purchased. Let's say you're predicting that Amazon stock would go up and you purchase 100 contracts for that trade. If Amazon stock actually rises by $5, your profit on that trade would be $500. It works similarly if you're predicting that the stock would fall.
Since CFD trading doesn't actually involve buying the stock, the cost of a stock CFD contract can be less than the market price of the underlying stock. As a result, Amazon CFD trading requires less initial capital than buying Amazon shares directly.
Additionally, CFD trading makes it easier for you to trade both bull and bear markets. A major downside of CFD trading is that it doesn't offer traders voting rights in the underlying companies.
Trade Amazon Stock CFD with VSTAR
If you're interested in trading Amazon stock CFD, the first thing you need to do is select your trading platform. It is important to choose your CFD trading platform carefully to avoid scams or excessive fees and restrictions.
For trading Amazon stock CFDs, consider using VSTAR. VSTAR is a legitimate CFD broker that is fully licensed and regulated.
The platform has low fees and tight spreads, which enable traders to maximize their profit. VSTAR is designed for high-speed and frequent traders. Therefore, the platform has easy to use mobile and web interfaces, offers generous leverage, and supports almost all deposit and withdrawal methods.
You can start trading Amazon CFD on VSTAR with only $50 and use leverage to increase your market exposure.
For new traders, VSTAR offers a $100,000 demo account for practice trading.
Consider opening your free VSTAR CFD trading account today to start making money trading Amazon stock CFD.


Final Thoughts
Amazon (NASDAQ: AMZN) stock has solid fundamentals, making it a strong candidate to consider for CFD trading. With technical analysis, you can quickly and easily identify profitable Amazon stock CFD trading opportunities. Pro traders study multiple technical indicators and patterns to identify or confirm profitable buying or selling opportunities.
FAQs
1. Is Amazon stock a buy or sell?
AMZN's fundamentals remain strong, but the stock's lofty valuation is creating a divide. Investors bullish on Amazon's market positioning and growth see it as a buy at current levels, while more cautious investors see it as fully valued or risky at current prices.
2. How high will Amazon stock rise?
Analysts' 12-month price targets range from $3,200 to $5,000 per share.
3. Why is Amazon's PE ratio so high?
Amazon's P/E is elevated (over 60) due to the massive reinvestment of earnings back into growth. Investors are paying a premium for future potential.
4. What is a good price for AMZN stock?
A good entry point is debatable as the stock is prone to volatility. But buying below $3,000 may provide some margin of safety.
5. Will Amazon fall back to $1,000 per share?
AMZN stock is unlikely to fall back below $1,000 unless growth stalls significantly or the broader market crashes. The stock hasn't been this low since 2017.
6. What will Amazon stock be worth in 2025?
By 2025, most analysts forecast Amazon stock to be worth more than $5,000, assuming its dominant position in e-commerce and cloud continues.