This morning, the Federal Reserve announced the maximum federal funds rate, the results are generally in line with market expectations, after the suspension of the rate hike in June, the rate hike of 25bps, the target range was raised to 5.25% to 5.5%, rising to the highest level in 22 years. This was the eleventh rate hike since the beginning of the hiking cycle in March last year and the most significant change from the last meeting's statement was the forward guidance on interest rates, stating that it "will continue to assess new information and its implications for monetary policy and reiterate that it will exercise judgment on the degree of additional tightening that may be appropriate". Following the release of the resolution, markets continued to shrug off the likelihood that tighter monetary policy would cause a recession and continued to bet on an uptrend, with the S&P 500 briefly rising to its highest level since last April.
With the interest rate hike cycle nearing its end, in the face of the first half of the year since the unexpected rise in the market, Wall Street's well-known big short also had to make strategic adjustments, such as Morgan Stanley's chief equity strategy analyst Mike Wilson, the big short Bank of America's chief strategy analyst Savita Subramanian recently admitted errors of judgment, no longer adhere to the S&P 500 bear market expectations. Wall Street collectively raised the S&P 500 year-end target price: Credit Suisse from 4050 at the beginning of the year to 4700, HSBC from 4000 to 4600, Goldman Sachs from 4000 to 4500, Bank of America from 4000 to 4300, Barclays from 3725 to 4150 (source: Bloomberg).
Finance is cyclical. While individual stock prices are unpredictable in the short term, the study of their valuations, price-to-earnings ratios, and other data is somewhat predictable over the long term. And company growth is affected by economic and industry cycles, just as bond prices are affected by inflation expectations and stocks by growth rates. Thus, over the long term, investors' returns on financial assets appear to be closely correlated with economic conditions.
But investors' expectations of economic and corporate fundamentals (such as expected growth, profits, inflation, and interest rates) amplify expectations of economic conditions, and the cycles of these sentiments become key influences on the business cycle. And a growing body of academic research also suggests that investors' risk appetite is an important transmission channel through which monetary and fiscal policy affect the business cycle. So the rationale for the Federal Reserve's "expectations management" is clear. Only this time, monetary policy does not seem to have been able to influence investor sentiment - even in the face of high-interest rates, the market is still in a frenzy, with expectations of a soft landing continuing to grow.
Although no one can predict the exact boundaries of the economic cycle, it is not impossible to find them, and some indicators have a forward-looking role in predicting recessions. Three of the most common indicators that analysts look at are the inverted U.S. Treasury yield curve, the LEI, a leading economic indicator published by the Conference Board, and the output gap.
U.S. Treasury Yield Curve Inversion
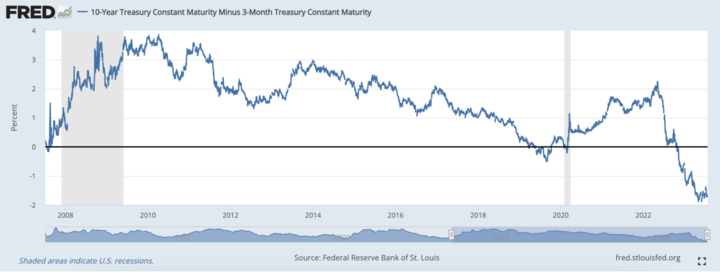
Difference between 10-year Treasury yield and 3-month Treasury yield:
2023-07-24: -1.65
The U.S. bond yield curve is the relationship between the yields on U.S. Treasuries (bonds) of different maturities, usually including different maturities such as 3-month, 2-year, 5-year, and 10-year bonds. An inverted yield curve is one in which the yields on long-term bonds are lower than those on short-term bonds, i.e., the yield curve for long-term bonds is above that for short-term bonds. Based on July 24, 2023 data, the current difference between the 10-year and 3-month Treasury yields is -1.65
Source: Twitter@charliebilello
When the U.S. bond yield curve inverts, it is usually seen as a precursor or signal of a recession. This is because, under normal circumstances, long-term bonds should yield more than short-term bonds, because the longer you borrow, the more risk you take on, so investors demand higher yields. As shown in the chart above, the difference between 10-year and 3-year Treasury yields is positive between 2007 and 2021. However, with a recession looming, investors may become pessimistic about the future economic outlook and therefore put more money into longer-dated bonds, leading to increased demand for longer-dated bonds, which pushes up their prices and, in turn, lowers their yields. A key factor contributing to inversions is the market's expectations about the future economic outlook. In general, inversions can occur when investors anticipate a future economic slowdown or recession, making them more willing to buy long-term bonds to avoid higher risk. At the same time, demand for short-term bonds falls, causing their yields to rise.
Historical data on inversions show that over the past few decades, inversions in the U.S. bond yield curve have often been accompanied by recessions around the time of the inversion. As a result, inversions are considered one of the more reliable indicators of recessions, with a 66% accuracy rate in predicting recessions.
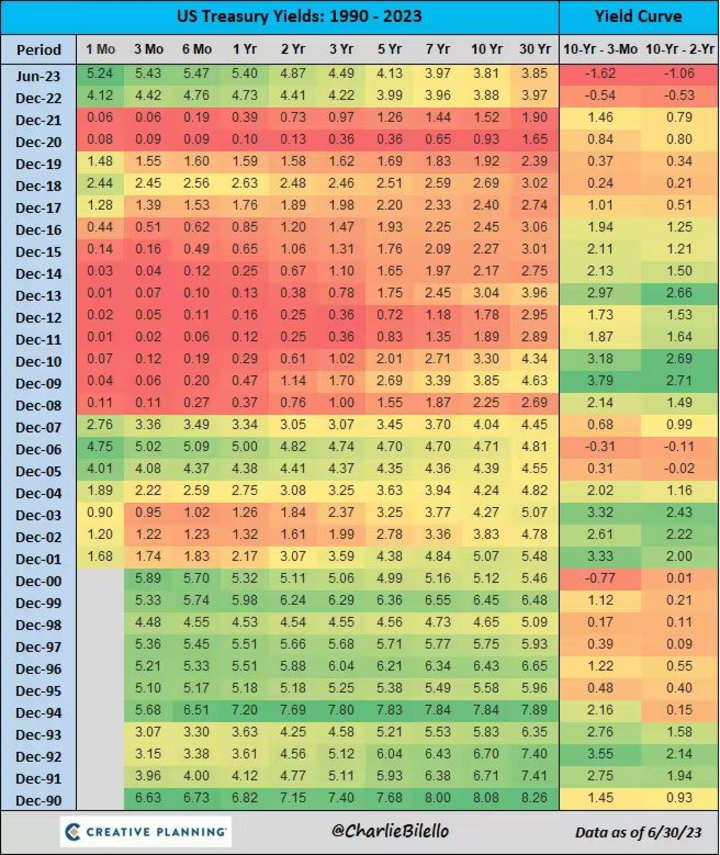
Conference Board Leading Economic Index (LEI)
The Leading Economic Index (LEI) is an economic indicator published by the Conference Board of the United States (The Conference Board) that is used to predict the trend of future economic activity. It is a composite index of several economic indicators, including but not limited to industrial production, consumer confidence, money supply, long-term bond yields, and more.
The chart below shows the composition of the LEI for June 2023, where it can be observed that the current LEI is -4.2, with consumer expectations for the business outlook, manufacturing new orders, the 10-year Treasury yield and the federal funds rate differential, and the leading credit index in largely negative territory, contributing to the majority of the LEI index moving into negative territory.
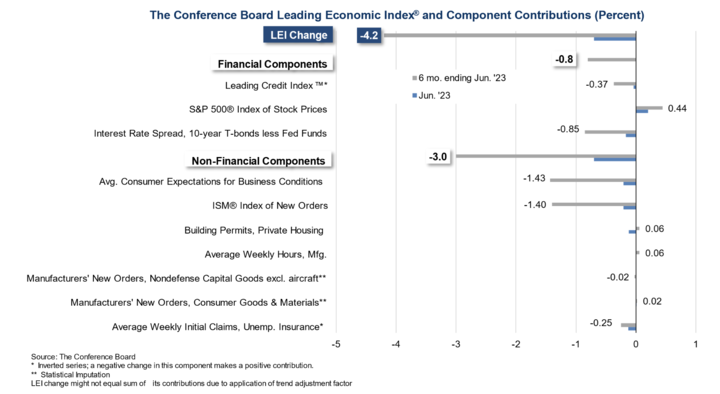
The chart shows LEI performance in June 2023, data from the official website of the Conference Board
When the Conference Board Leading Indicator (LEI) is negative, it is usually taken as a sign or signal of a recession. This is because the purpose of the LEI is to predict how the economy will perform in the coming months, and a recession is usually defined as two consecutive quarters (i.e., six months) of economic contraction. When the LEI is negative, it means that several of the economic indicators included in it suggest that the economy may be on a downward trend in the future, possibly due to factors such as declining consumer confidence, reduced investment, and shrinking manufacturing activity. This could lead to a decline in business production, an increase in unemployment, and a slowdown in overall economic activity that could eventually lead to a recession. And according to the chart below, the LEI has been consistently negative since mid-2022, indicating a recession.
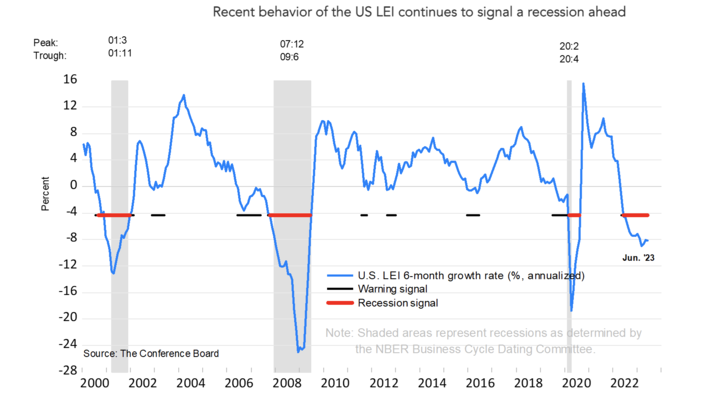
Source: Official website of the Conference Board
This indicator, superimposed on the yield curve's probability of predicting recessions, seems to have been able to indicate a high probability that the current economic cycle is headed for a recession.
Output Gap
The output gap is a macroeconomic indicator that measures the difference between actual economic output (GDP) and potential economic output. Potential output is the level at which the economy can continue to operate if resources (labor, capital, etc.) are fully utilized. When actual economic output is greater than potential economic output, it is called a positive output gap, and vice versa, a negative output gap.
The output gap is calculated as Y-Y*, where Y is the actual output and Y* is the potential output. If this calculation yields a positive number, it is called an inflationary gap, indicating that the growth of aggregate demand exceeds the growth of aggregate supply, which may lead to inflation; if it yields a negative number, it is called a recessionary gap - which may imply deflation.
In a normal business cycle, the output gap may be positive during expansions and negative during recessions. This is because a negative value of the output gap indicates that the economy is operating below its potential level, which means that output and employment levels may fall and economic activity may be depressed.
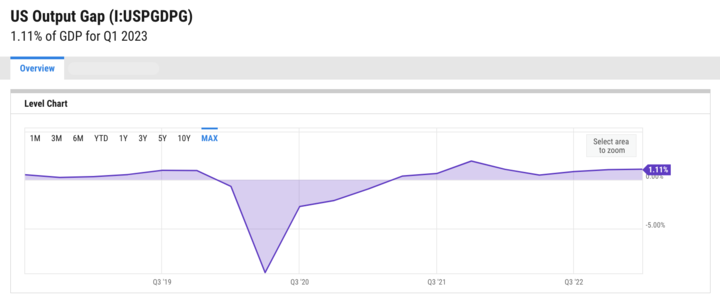
Source:ycharts
The current U.S. output gap is 1.11%, compared with 1.06% last quarter and 1.09% last year. Thus, this indicator does not appear to be in recession at this time.
The current performance of GDP also does not meet the NBER definition of two consecutive quarters of recessionary performance.
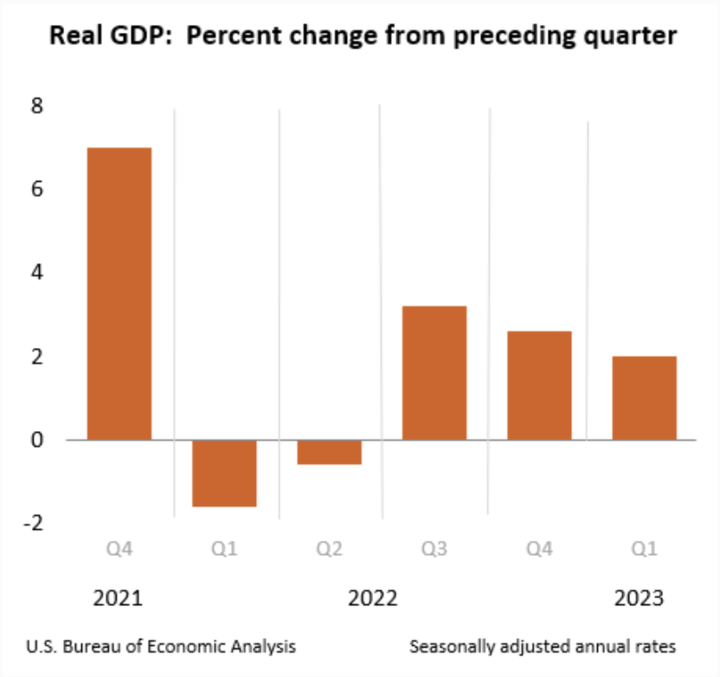
Source: US Bureau of Economic Analysis
Summarizing the three indicators above, we conclude that a recession is expected, but economic data continues to show resilience. Asset markets continue their frenetic pace, and this data is why the Fed has the backbone to keep raising rates.
If you're always looking for signs of a bubble, recession, or crash, I'm afraid you'll be disappointed. They are very rare. In addition to cyclical and structural bull markets, trendless bull markets are also very common. How to achieve above-average investor market levels in a low-volatility financial cycle requires a higher win rate. The observable history of volatility suggests that the tail end of a rate hike cycle is not when the risk is greatest - after all, monetary policy works with a huge lag. And every time the Fed has started to cut rates, it has caused a plunge in U.S. equities (the chart below shows that two Fed turns in the first decade of 2000 caused the S&P 500 to fall by more than 50%). This is because lowering interest rates means that inflation has been reduced to target, or that the Fed is confident that it will be reduced to target, but the decline in inflation is accompanied by a shrinking of U.S. equity wealth and earnings, and rate cuts imply that economic activity is no longer active and that monetary policy is needed to stimulate the market, thus indirectly acknowledging the recognition of a recession. This has caused a short and sharp withdrawal of funds due to risk aversion. However, the rate cut also means that a new cycle will begin - liquidity will return.
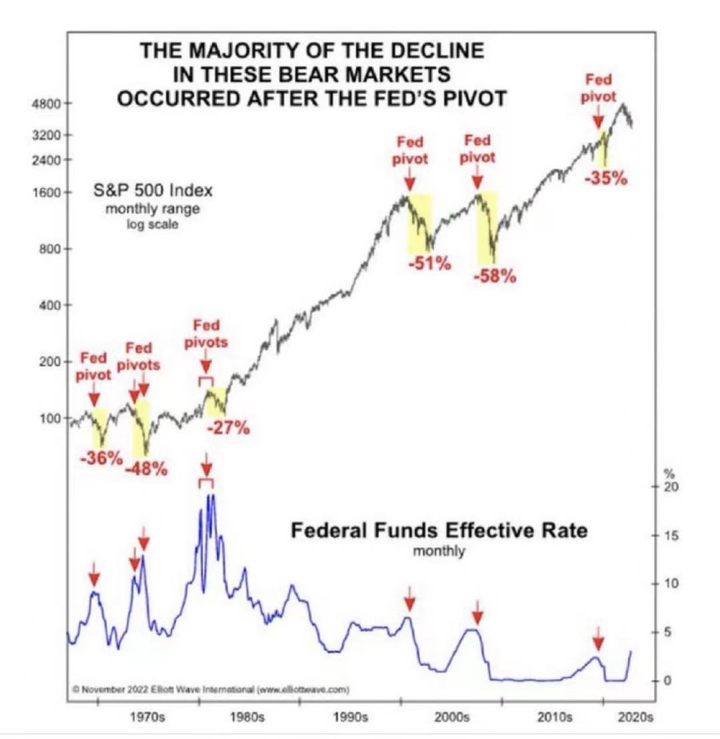
Source: Elliott Wave International (www.elliottwave.com)
The essence of financial investing is to capture market signals and inflection points in volatility to generate cycle returns. And the Fed's stance on the official turn, perhaps we are looking for the perfect opportunity.