What is Day Trading?
Buying and selling financial products in a single trading day is known as day trading, and it's a dynamic financial approach. Unlike traditional investing, which involves keeping assets for a long time, day trading tries to profit from short-term price swings.
Day trading differs significantly from traditional investing; while investors may hold onto assets for extended periods, day traders seek to profit from short-term fluctuations. The primary distinction lies in the time horizon: investors focus on long-term growth, while day traders prioritize immediate gains.
Day trading offers several advantages, including its accessibility. With online platforms and educational resources widely available, anyone can enter the market with minimal barriers. Moreover, the potential for substantial profits is enticing, especially when leveraging volatile assets. Additionally, day traders face no overnight risk since they close all positions before markets close, eliminating exposure to after-hours movements.
However, day trading does have its drawbacks. The high levels of volatility inherent in short-term trading can lead to significant losses if not managed effectively. Moreover, the use of margin amplifies both gains and losses, increasing the risk for traders. Psychologically, the fast-paced nature of day trading can foster addiction-like behaviors, leading individuals to make impulsive decisions driven by emotion rather than logic.
In essence, day trading offers opportunities for quick profits but demands discipline, risk management, and emotional resilience. Understanding its nuances and weighing the pros and cons are crucial for aspiring day traders to navigate the markets successfully.
What is Day Trading Stocks?
Buying and selling stocks inside a single trading day is known as day trading, and the goal is to profit from rapid movements in price. It necessitates rapid decision-making, in-depth market knowledge, and technical analysis - all the opposite of traditional investing. Let's explore the main facets of stock day trading.
Simply put, it involves placing multiple orders in a single day and taking advantage of intraday market swings to generate rapid gains. Selecting the right stocks is essential; to ensure effortless entry and exit, traders concentrate on those stocks that are highly liquid and have significant trading volumes. Volatile stocks give price movement possibilities, helping day traders to profit from short-term trends. However, stocks must be aligned with your strategy through careful research, pattern analysis, and market news updates.
How to Pick Stocks for Day Trading?
To make money, day traders look for companies that have a certain industry or index group following them, a sufficient level of liquidity, and moderate to high volatility. Leveraging the current trend for intraday trading, sorting through the market noise, and picking the right stocks are all important aspects of stock selection.
Day traders have the freedom to select almost any stock because there are so many stocks accessible. Taking advantage of intraday price swings, they aim to benefit from short-term fluctuations by placing several long and short contracts in a single day.
Day traders use real-time market data from several sources, including online brokerages, Google Finance, and Yahoo Finance, to find trading opportunities. It is vital to fully understand the characteristics of the selected stocks, particularly their volatility and liquidity, to make informed decisions.
Developing trading strategies is the next stage after identifying a possible transaction, be it in a single stock, multiple stocks, or exchange-traded funds (ETFs). To maximize profits in the quick-paced state of intraday trading, successful day trading thus requires a careful selection procedure and the capacity to adjust to market dynamics.
A. Best Industry Groups for Day Trading
Choosing the correct industry categories is vital for your success while day trading. The major industries for day trading are shown below in brief:
- Pharmaceuticals and biotechnology: Pay special attention to FDA pronouncements since they can potentially cause big price changes. Earning prospects are generated by the rapid effect of clinical trial findings, regulatory approvals, and medication pipeline updates on stock prices
- Tech: Day traders love technology stocks because of their high volatility. Keep a watch on businesses with collaborations, new launches, or earnings reports coming up since these occasions sometimes result in significant price movements that present opportunities for winning trades.
- Penny stocks: Despite being riskier, day traders frequently prefer penny stocks due to their high volatility. Look for stocks that may act as catalysts, such as industry developments or earnings announcements, since these can cause sharp market swings that present opportunities for quick profits.
B. Key Factors to Consider When Picking Best Stocks for Day Trading
1. Volatility
The vitality of day trading lies in volatility. It is an indicator of how much a stock's price fluctuates. Increased volatility makes it possible for prices to fluctuate more significantly, which opens up chances for rapid profits. To profit from brief price fluctuations, day traders constantly look for stocks with high volatility. Seek for stocks with a track record of significant price swings caused by events like earnings statements, news releases, or shifts in market sentiment.
2. Liquidity
Identifying high-volume stocks is of the utmost importance for day traders. Reduced daily volume frequently leads to greater spreads (buy-sell price gaps), which may affect profits—which are never certain. Significant buy or sell orders may cause low-volume stocks to move more unpredictably. On the flip side, large-volume stocks demonstrated significant trading activity, providing more liquidity and, as a result, reduced spreads. This dynamic can improve trading chances while minimizing day traders' adverse impact on their profits.
3. Price Range
Think about the stocks' price range that you intend to trade. Mid-priced stocks are a favorite among day traders because they combine enough volatility to make lucrative transactions with affordability for those with smaller accounts. You may choose stocks that suit your trading style and risk tolerance by looking at a stock's average daily price movement.
4. Timeframes
While many day traders work with shorter timescales, some work with longer ones. To find moving stocks, various time frame analyses are beneficial. On the other hand, it might be difficult to keep up with changes throughout different periods.
5. Trend
Different types of stock market traders participate in day trading, including arbitrage traders, hedgers, and speculators. Hence, it is important to know your trading style to choose the best possible stocks. Most retail traders struggle with directional speculation as algorithmic trading gains strength. It is crucial to choose stocks with similar characteristics to trends. Technical day trading indicators are important in this search.
The average stock price over a certain time frame is shown through moving averages; these are common indicators. Momentum and price divergences are measured by the MACD, with values above the zero line indicating bullishness.
Besides, the Awesome Oscillator helps traders navigate the constantly shifting marketplace of day trading by evaluating the strength or weakness of stock prices.
6. Per Share Price
A stock's price per share is a crucial consideration for day traders. Cheap stocks, often known as penny stocks, attract investors because of their affordability and potential for large profits. However, they carry a higher risk because of their reduced liquidity and vulnerability to manipulation.
Conversely, more expensive stocks could need a larger initial investment but are typically more stable. Selecting companies based on their price per share should be done after carefully assessing your trading strategy and risk tolerance.
7. Other Factors
Careful stock selection is essential for day trading to be successful. To improve your trading judgments and stock selection process, consider these important aspects in addition to industry focus.
News and Events
Keep a close eye on events that might move the market, such as business announcements, interest rate decisions, economic data, and earnings reports. These variables have a big influence on stock prices. Therefore, day traders looking for successful chances may learn a lot from them.
Technical Analysis
Technical analysis methods are used to evaluate the performance of stocks. Charts, volumes, and trends may examine a stock's behavior. You may make data-driven decisions by using key indicators like breakouts, moving averages, and the Relative Strength Index (RSI) to help you discover possible entry and exit opportunities.
Float and Market Capitalization
Look at a stock's market capitalization (total market value) and float (the number of shares that may be traded). Whereas market capitalization indicates the size and stability of the firm, lower float stocks are typically less predictable. Finding the right balance depends on how much risk you can take.
Time of Day
Remember that timing is important in day trading. There is frequently more volatility and liquidity during the trading day's early hours and end hours. During these times, many day traders concentrate their efforts, taking advantage of the quick price changes to generate profits.
Top 10 Best Day Trading Stocks
The best day trading stocks to trade for day trading rely on both individual preferences and market conditions. These 10 Best Day Trading Stocks have traditionally been preferred by day traders because of their overall potential, volatility, and liquidity. Remember that the stock market is volatile, highlighting the importance of extensive research before entering any trade.
|
Stock |
Industry |
Market Cap |
Beta (5Y Monthly) |
Average Daily Volume |
|
Affirm Holdings (AFRM) |
Software - Infrastructure |
13.459B |
3.72 |
19,822,183 |
|
Block Inc. (SQ) |
Software - Infrastructure |
42.268B |
2.53 |
10,439,559 |
|
Upstart Holdings (UPST) |
Credit Services |
2.883B |
2.12 |
9,855,649 |
|
Lyft Inc. (LYFT) |
Software - Application |
5.019B |
1.91 |
14,264,155 |
|
SoFi Technologies (SOFI) |
Credit Services |
7.934B |
1.79 |
51,316,873 |
|
Doordash (DASH) |
Internet Content & Information |
47.51B |
1.72 |
4,247,229 |
|
American Airlines (AAL) |
Airlines |
9.781B |
1.56 |
36,254,432 |
|
Walt Disney (DIS) |
Entertainment |
202.764B |
1.38 |
13,025,800 |
|
eBay (EBAY) |
Internet Retail |
22.021B |
1.30 |
6,349,063 |
|
Qualcomm (QCOM) |
Semiconductors |
168.516B |
1.42 |
8,890,927 |
Affirm Holdings (AFRM)
Recently, the stock value of Affirm Holdings, Inc. (AFRM) dropped by 10.89% and closed at $43.86 on NasdaqGS. Still, stability is demonstrated by its strong fundamentals, which include a market valuation of $13.459B and a 52-week range of $8.80 - $52.48.
The TTM total revenue, which is $1.722 billion, shows a good increase when financials are examined. Despite a brief decline in current quarter earnings (-0.67), the firm has long-term potential as it projects 93.39% growth over the next five years. With its robust financial position and room for expansion, Affirm is an attractive investment even in volatile markets, and prospective investors are encouraged to consider it.
Affirm Stock Forecast
Source: TradingView
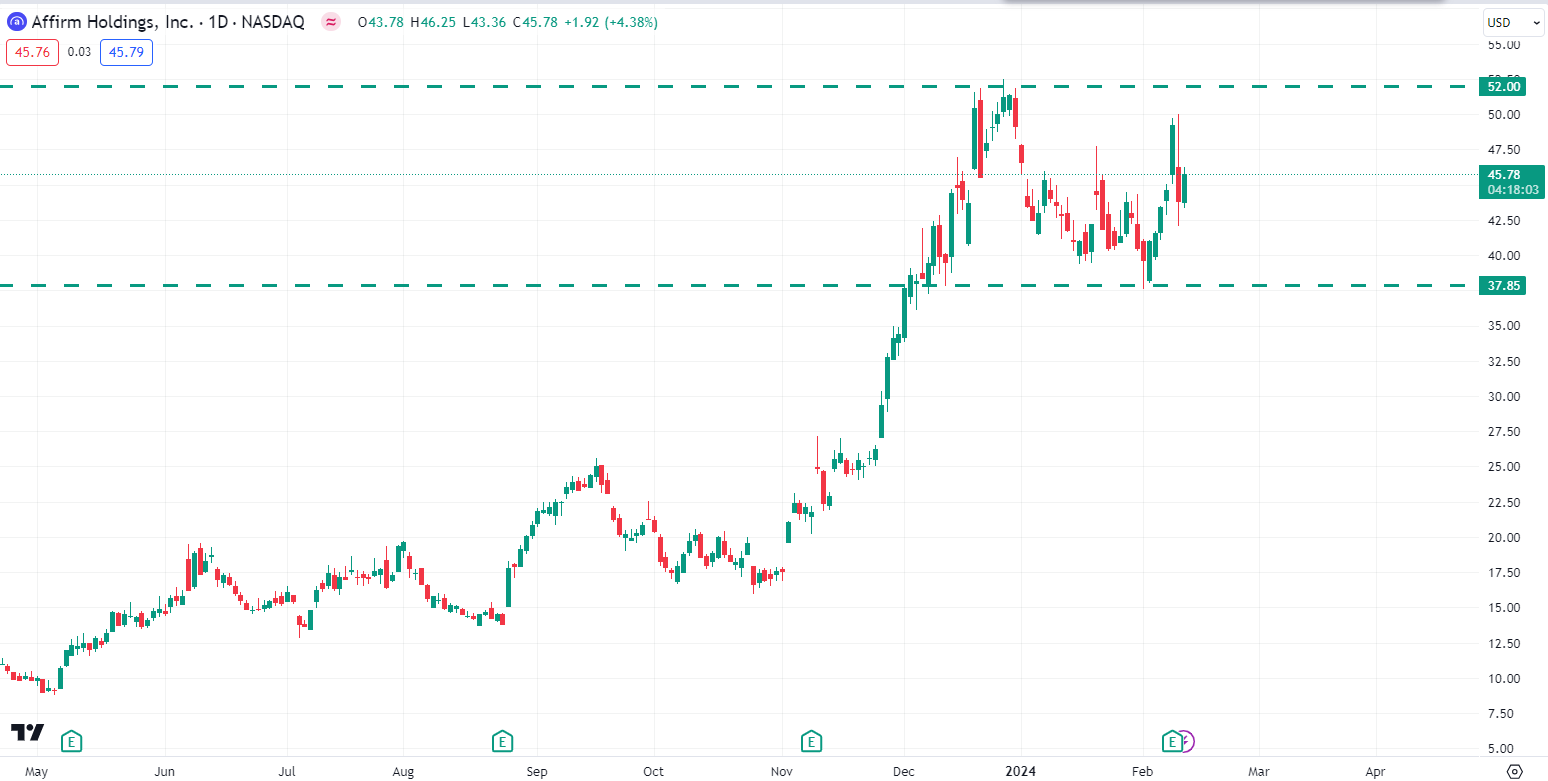
AFRM stock is currently trading at around $45.74 in the price area and trying to recover further. After a decline below the $40 psychological level, the price found support around the $37.85 price level and pushed higher.
As per the current price action, Affirm stock may continue the bullish momentum toward the $60 price area in the coming days.
Block Inc. (SQ)
Block, Inc. (SQ) had a little decline in stock price, ending the day at $61.90 on the NYSE. However, the business has strong fundamentals; it has a $42.268 billion market capitalization and a 52-week range of $38.85 to $83.08.
According to financial data, Block's TTM revenue is $20.79 billion, indicating a noteworthy annual rise of 24.40%. Even though it reported a net income deficit, its operating cash flow of $944.25 million demonstrates stability. Block presents an attractive investment opportunity with a projected P/E of 23.04 and a PEG ratio of 0.83, considering its potential for consistent development and leadership in the digital payments market.
SQ Stock Forecast
Source: TradingView
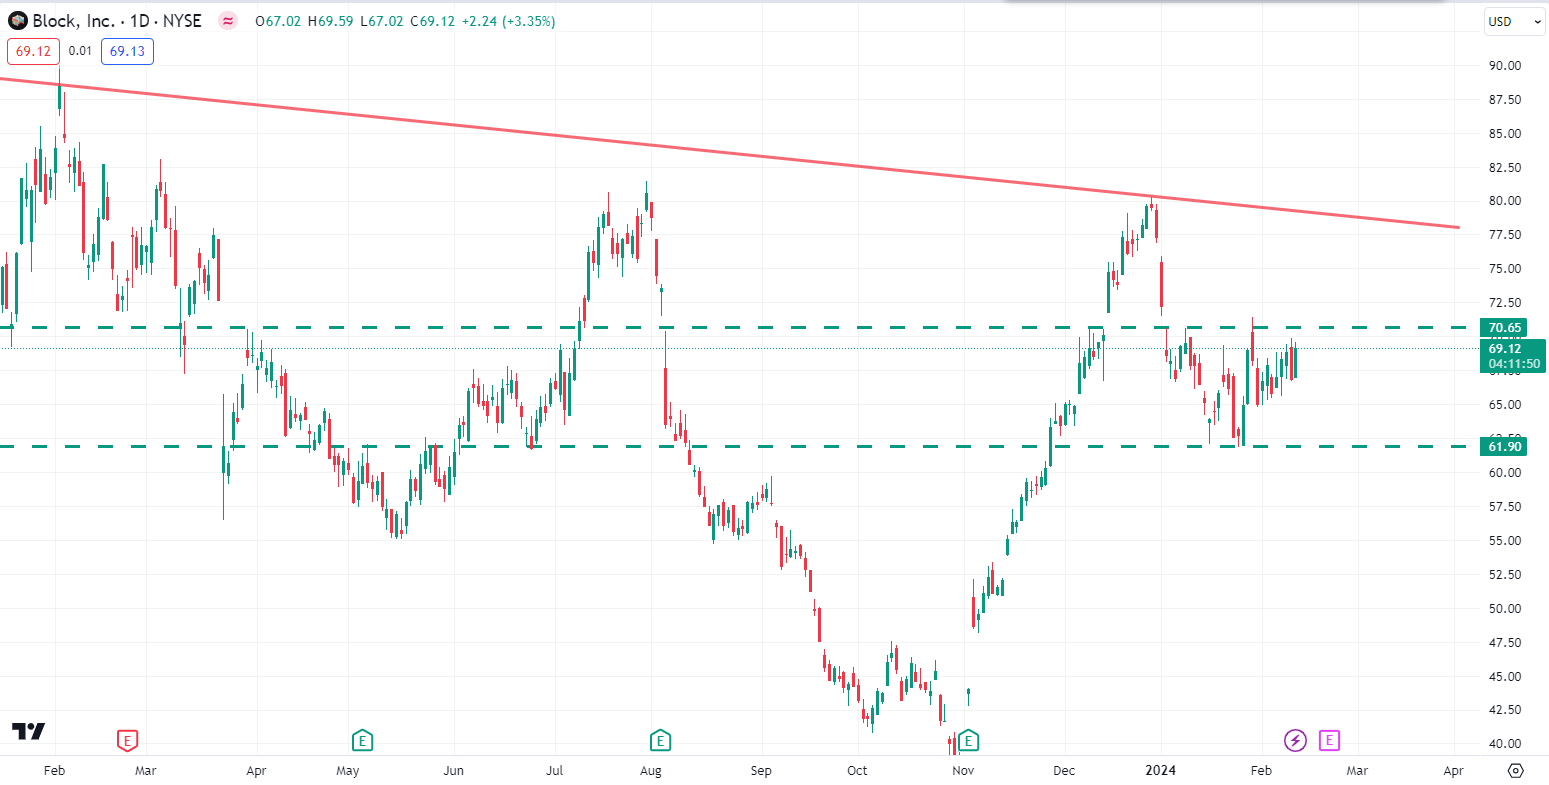
SQ stock price was rejected from the bearish trend line on Dec 27, 2023, and nose dive to the $61.90 price level. However, the price currently ranges around the $61.90 - $70.65 area. As per the current price action, if the price can break below the $61.90 support level, SQ stock may decline further lower toward the $50 price area in the days ahead.
Upstart Holdings (UPST)
Recently, Upstart Holdings, Inc. (UPST) saw a slight decrease in its stock price of 1.19%, ending the day at $29.15 on the NasdaqGS. Notwithstanding this, the firm has solid fundamentals: it has a market capitalization of $2.883 billion and a wide 52-week range of $11.93 to $72.58. The financials for UPST show a noteworthy $515.479M in sales for the previous year, representing a tremendous increase. With an operational cash flow of -$269.658M, UPST demonstrates resilience despite a net income loss.
The solid financial sheet shows $1.936 million in total assets, which suggests stability and room for expansion. UPST offers attractive investment prospects in the digital lending business, which is expected to grow significantly through an inventive strategy.
UPST Stock Forecast
Source: TradingView
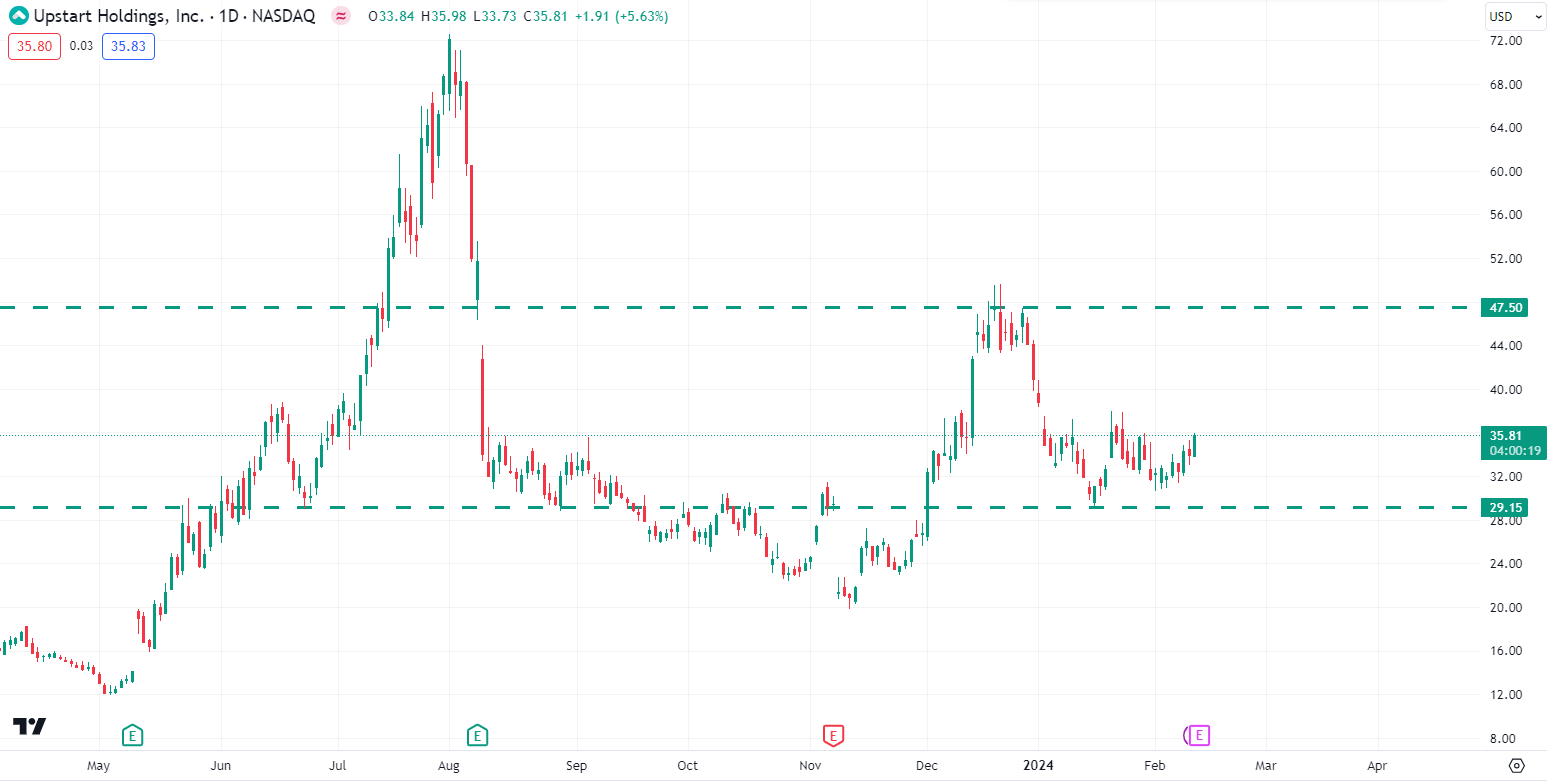
After a sharp decline, UPST stock price found support around the $29.15 event area. However, bulls are still struggling to continue higher. So, if the price can break above the $37.15 psychological level with a daily bullish candle, UPST stock may continue higher toward the $47.50 resistance area in the upcoming days.
Lyft Inc. (LYFT)
Lyft, Inc.'s (LYFT) stock price recently increased by 1.96% to close at $12.30, demonstrating the company's recovery in after-hours trading. Lyft emphasizes its industry dominance with a $5.019 billion market cap. Lyft's forward-looking Q4 2023 profits forecast indicates a favorable trend despite a negative EPS of -2.45. Examining its financial statements, it generated $4.35 billion in revenue in the most recent quarter, demonstrating its ability to generate money.
Although Lyft continues to face difficulties due to its negative operating income of -$1.01 billion, the company's interest income shows promise for other revenue sources. Anticipated earnings per share (EPS) of $0.56 for the upcoming year and sales predictions of $4.92 billion for 2024 indicate the possibility for growth. Notwithstanding recent difficulties, Lyft is still a significant participant in the rapidly evolving ridesharing market and merits investors' interest.
LYFT Stock Forecast
Source: TradingView
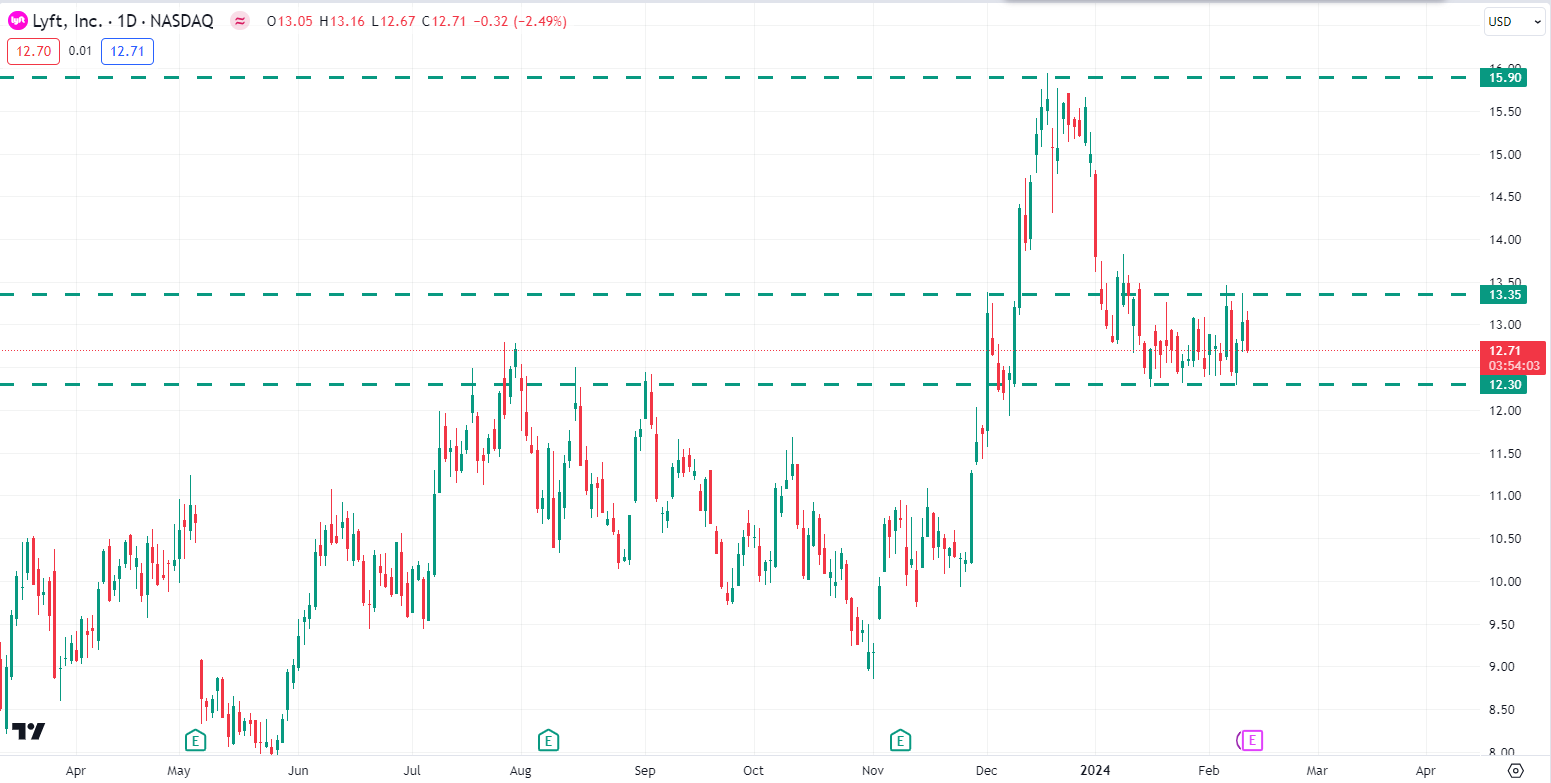
LYFT stock price is currently trading in the $12.30 - $13.35 range after a sharp downward movement. As the overall momentum is still bullish, there is a high chance that LYFT stock may continue toward the $15.90 key area again in the coming days.
SoFi Technologies (SOFI)
Investor confidence was reflected in the 0.62% rise in SoFi Technologies, Inc. (SOFI) shares, which closed at $8.13. Its $7.934 billion valuation showed market volatility with a day's range of $8.08 to $8.35. The Q1 2024 forward-looking profits forecast exhibits positive tendencies, indicating SoFi's growth potential despite a negative EPS of -0.36.
Financially speaking, SoFi demonstrated its revenue capacity by reporting $1.96 billion in total revenue. Concerns about expense control are brought to light by a pretax income that is negative at -$391.27 million. Potential improvement is indicated by analysts' positive $0.25 EPS projection for the upcoming year.
SoFi's growth trajectory is shown by revenue predictions for 2025, which point to $2.85 billion. SoFi has growth potential despite short-term issues based on its optimistic sales and EPS expectations.
SOFI Stock Forecast
Source: TradingView
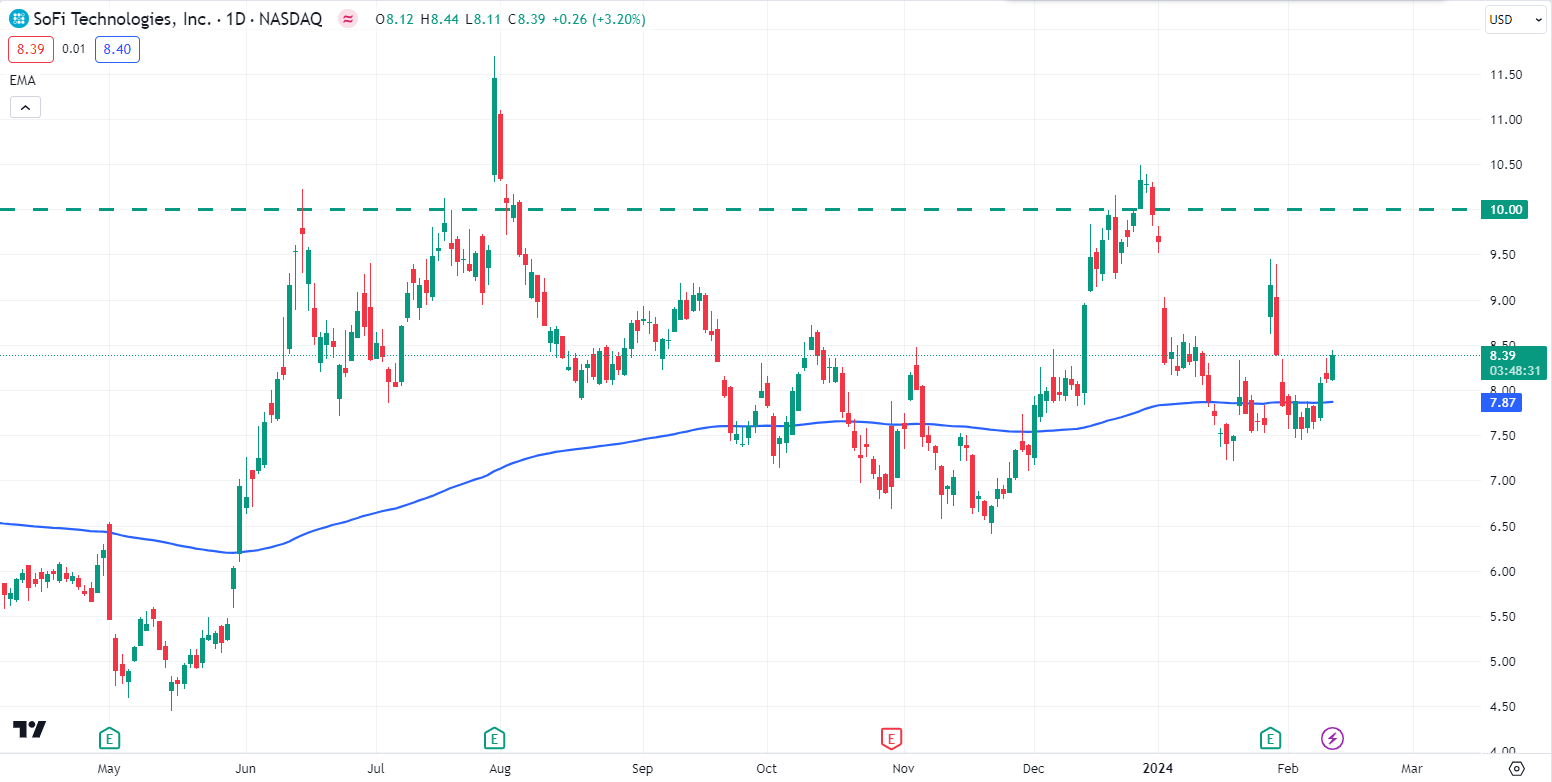
SOFI stock price surged over the 200 EMA as the bulls are still optimistic. As per the current price action context, SOFI stock bulls may continue their bullish momentum toward the $10.00 price area in the days ahead.
Doordash (DASH)
The stock of DoorDash, Inc. (DASH) witnessed a noteworthy 0.85% advance, ending at $119.31 and rising to $119.88 after hours. Investor confidence is clear with a $47.51 billion market value. DoorDash's strong $8.15 billion in revenue indicates its market dominance despite a negative TTM EPS of -2.73.
Looking at the numbers, it was evident that DoorDash was having operational difficulties. It had a negative operating income of $774 million and a net loss of $1.04 billion. Nonetheless, optimistic analyst expectations point to a possible decline in losses, with sales expected to increase to $10.09 billion by 2024.
Doordash Stock Forecast
Source: Tradingview
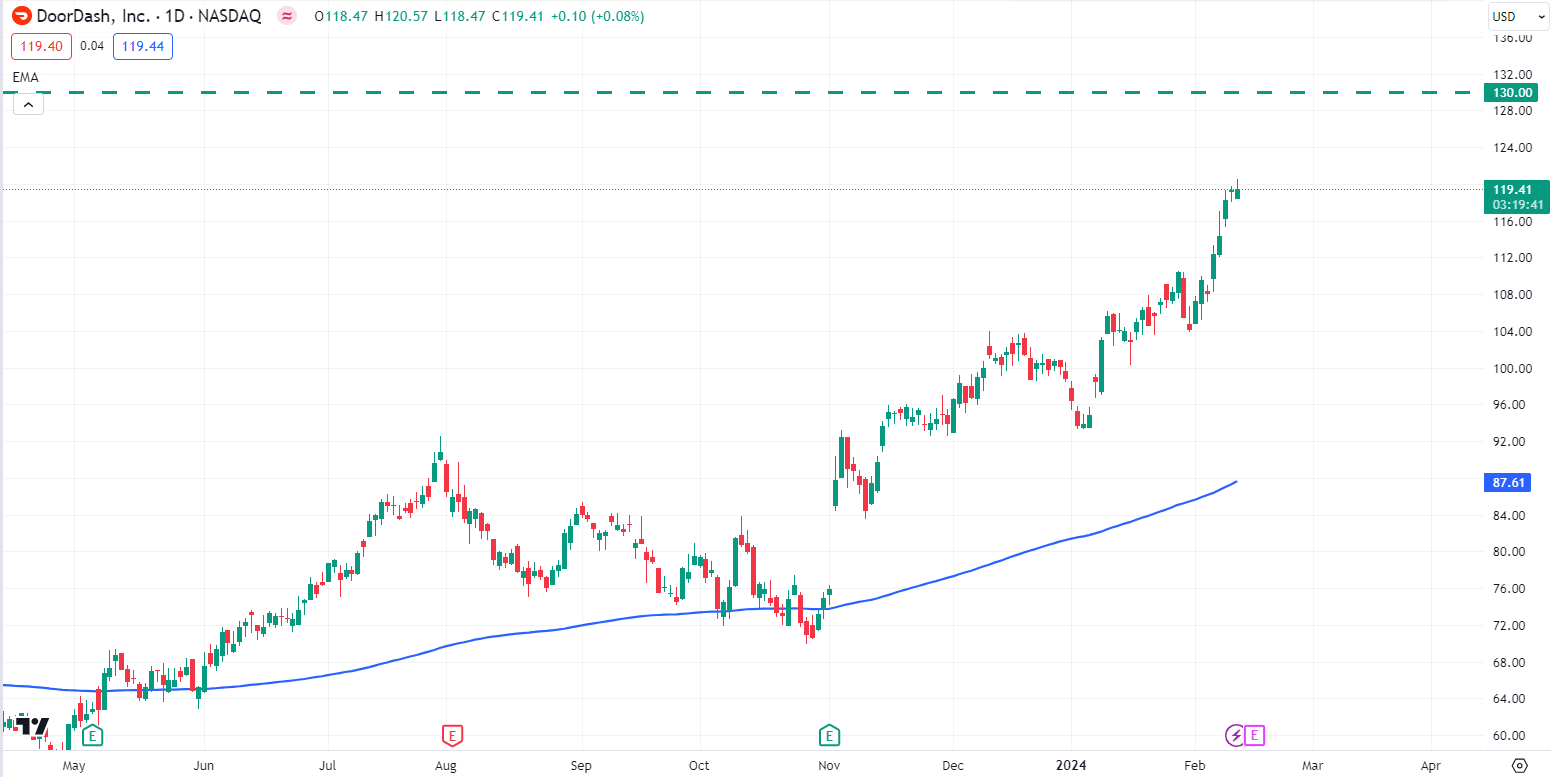
DASH stock continues its bullish momentum and trades around the $119.41 price area. As per the current price action context, the DASH stock price may continue upward toward the $130.00 psychological event level in the coming days.
American Airlines (AAL)
After-hours trading saw American Airlines Group Inc. (AAL) settle at $14.82, slightly down 0.47% from its closing price of $14.88. The airline exhibits stability in a challenging industry, as seen by its $9.781 billion market capitalization. At 12.30, American Airlines' P/E ratio is acceptable and indicates a favorable price.
AAL's positive TTM EPS of $1.21, which indicates profitability, was announced after reviewing the financials. The airline demonstrates its basic strength with an operational income of $4.73 billion and a gross profit of $12.44 billion. Monitoring is necessary, though, due to issues including a $7.71 billion operating expenditure.
AAL Stock Forecast
Source: TradingView
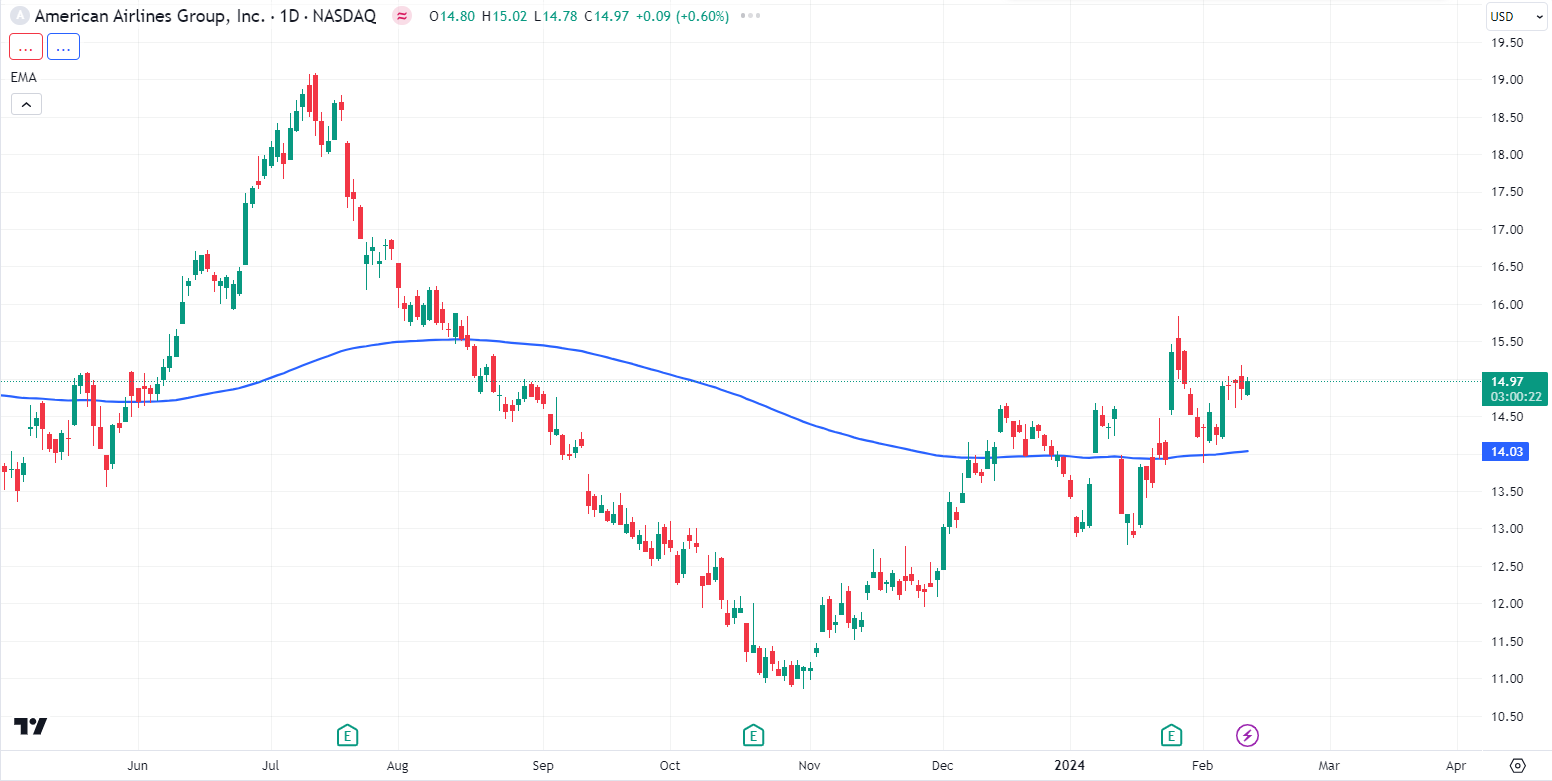
AAL stock bulls still hold the bullish bias above the 200 EMA. After a retracement toward the 200 EMA, bulls regained momentum and pushed the price higher. As per the current situation, AAL stock price may recover further toward the $16.00 price area in the days ahead.
Walt Disney (DIS)
Following regular business hours, The Walt Disney Company (DIS) settled at $108.34, down 1.95% to end at $110.00. Disney's market capitalization of $202.764 billion is still substantial, indicating investors' confidence. The company indicates stability and growth potential with a PE ratio of 66.50 and a projected dividend yield of 0.83%.
According to financial reviews, Disney's sales climbed considerably, hitting $88.935 billion in the most recent TTM quarter. Operating efficiency was evident as operating income increased to $9.935 billion. For 2025, analysts predict a positive EPS of $5.37, pointing to potential future growth.
Disney Stock Forecast
Source: TradingView
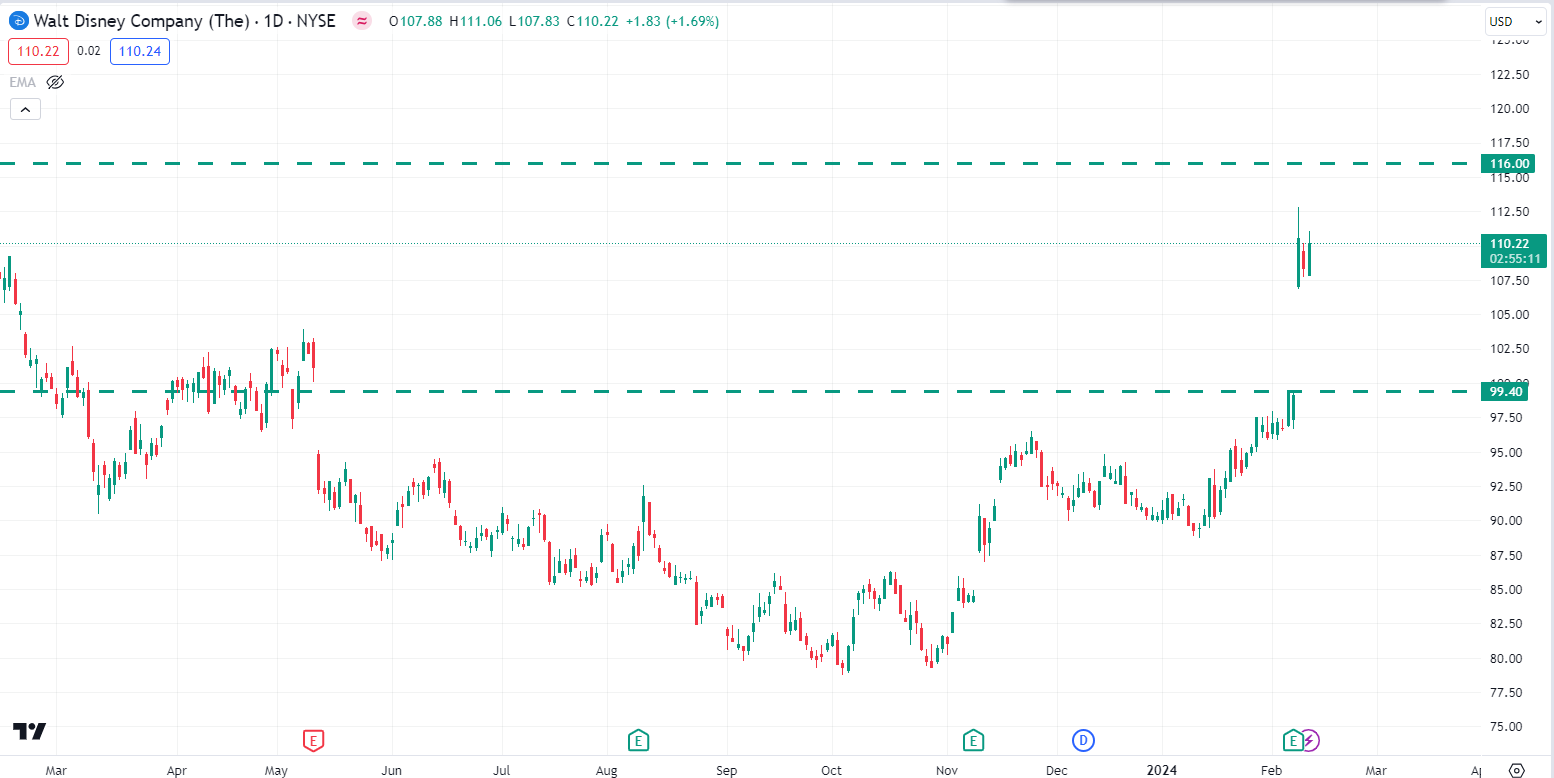
DIS stock price surged higher with a bullish gap and currently trading around $110.34 in the price area. As per the current price action, the price may retrace the downside toward the $99.40 support level before continuing further toward the $116.00 resistance level.
eBay (EBAY)
With an after-hours trade of $42.36, eBay Inc. (EBAY) finished at $43.22. The business offers investors a well-rounded return with a market valuation of $22.021 billion and a 2.36% future dividend yield. eBay is cheap compared to its industry peers, as seen by its PE ratio of 8.52, which points to future growth.
Regarding financials, eBay's revenue for the most recent TTM period is $10.06 billion, demonstrating stability. The company's low PE ratio and $2.096 billion operating income demonstrate its profitability and operational efficiency. For 2024, analysts predict a positive EPS of $4.35, indicating a promising future.
EBAY Stock Forecast
Source: TradingView
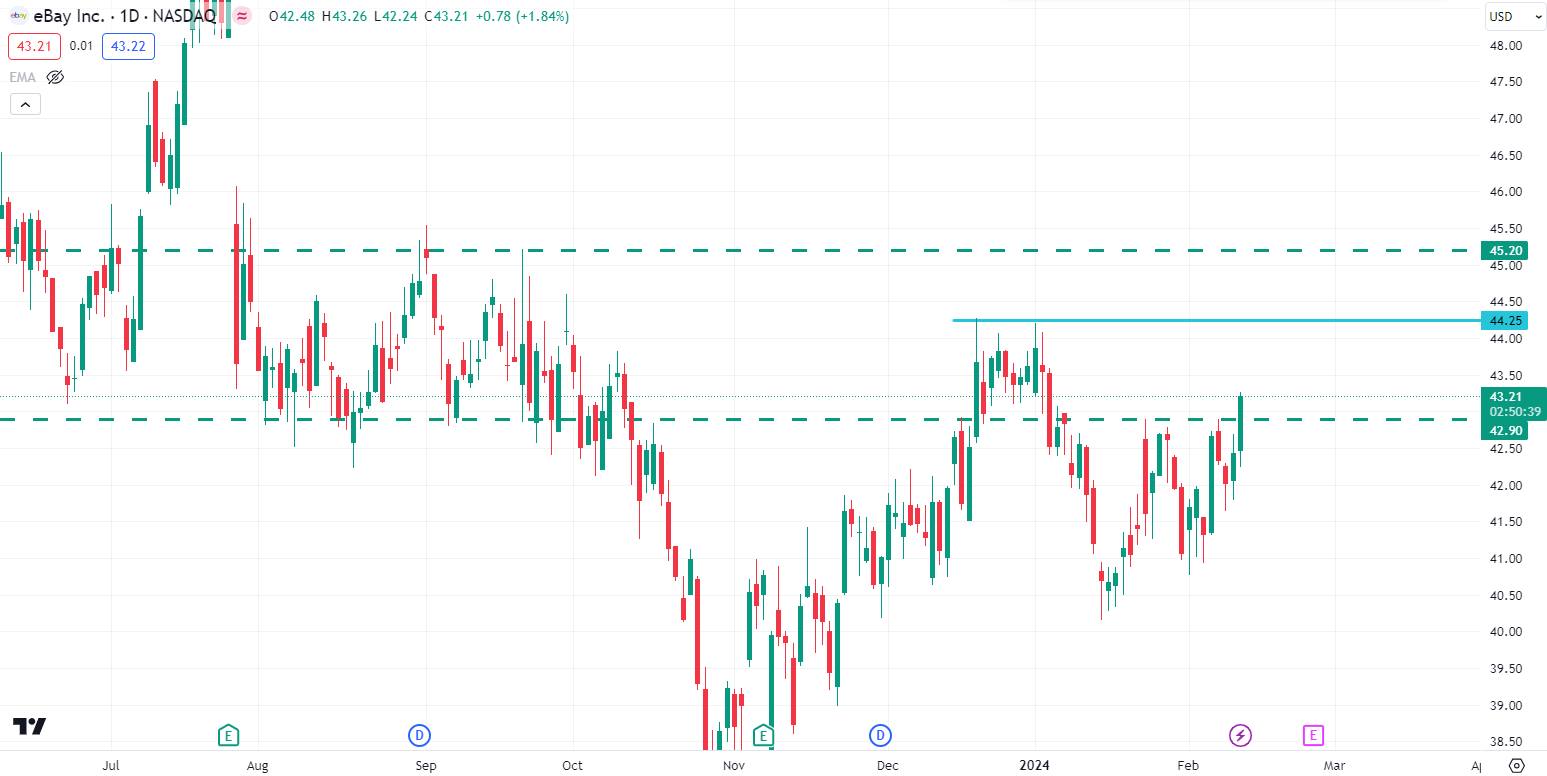
EBAY stock price broke above the $42.90 resistance area and is currently trading around the $43.25 price level. As per the current situation, eBay stock price may increase toward $44.25 as a first target. Our second target will be $45.20 if the price breaks above the $44.25.
Qualcomm (QCOM)
Following hours trading at $154.00, Qualcomm Incorporated (QCOM) finished at $154.50, up 0.5%. Qualcomm is a very attractive investment, with a market capitalization of $168.516 billion. It provides a stable value and a well-balanced return with a forward dividend yield of 2.12% and a PE ratio of 21.54.
Examining its earnings, Qualcomm's revenue for the most recent TTM quarter is $36.292 billion, indicating a steady increase. Strong operational efficiency is demonstrated by the company's $8.251 billion operating income. With strong growth potential, analysts predict a positive EPS of $10.72 for 2025.
QCOM Stock Forecast
Source: TradingView
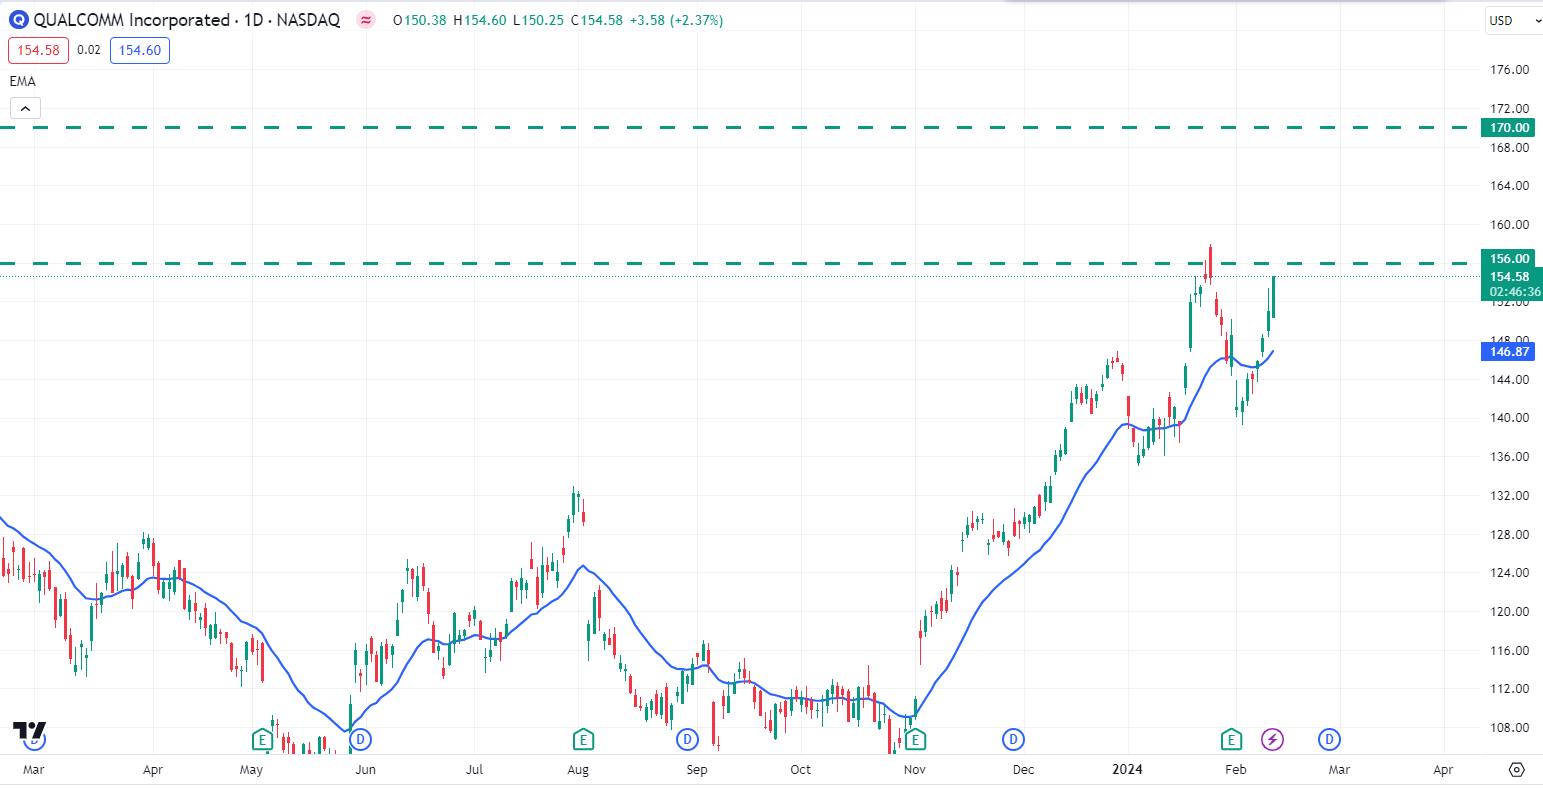
Qualcomm stock price pushed upward after breaking above 20 EMA. As per the current price action context, Qualcomm stock may continue its bullish momentum toward the $170.00 key resistance area. However, $156.00 may work as strong resistance in the upcoming days.
Strategies for Day Trading Stocks
A. Day Trading Strategies
Momentum Trading Strategy
Applying a momentum strategy means that you may profit from an upward or downward movement in a stock. The goal is to enter and exit positions before the stock hits its top or bottom. Finding momentum stocks is not always easy. To take advantage of faster trades with smaller companies - ideally with less than 100 million shares outstanding - when utilizing a momentum trading strategy, search for stocks that have substantial price swings caused by catalysts and movements of at least 30%.
Range Trading Strategy
One common short-term trading method in day trading is range trading, which is finding assets with certain price ranges. Day traders aim to make money as long as the price stays within a given range. A price chart defines a trading range by the asset's movement within predetermined support and resistance levels. With this approach, traders usually expect a rebound inside the defined range by buying at the support level and selling at the resistance level. On the other hand, range traders can initiate both long and short positions, giving them the freedom to close their positions when they hit the support level and go short at the resistance level.
Breakout Trading Strategy
When the price of a stock rises over its earlier resistance level, a breakout trade takes place. High-volume breakouts tend to maintain the new price better than low-volume ones. Fidelity claims that lower-volume breakouts frequently fall below past resistance levels, making it harder to make gains.
After reaching resistance, the stock usually retraces until a more powerful price catalyst appears. Once this price is reached, more sellers than buyers suppress additional price rises. Although it is simple, breakout trading might provide false signals.
Reversal Trading Strategy
A reversal strategy in day trading is intended to detect changes in the market's direction, allowing traders to take advantage of new trends for maximum profit. In order to spot trend reversals, this method requires maintaining a careful eye on chart patterns and technical indicators. The Head and Shoulders pattern, which has three peaks and indicates a change in sentiment from bullish to bearish or vice versa, is significant. Potential trend reversals are also indicated by double tops and bottoms.
A thorough understanding of technical analysis, including divergences and support/resistance levels, is necessary for successful implementation. In the fast-paced world of day trading, day traders strategically position themselves for lucrative results by closely monitoring these indicators.
News Trading Strategy
Stock prices fluctuate dramatically due to general sentiment driven by news and current affairs. Keeping an eye on business news enables day traders to take advantage of popular topics. Shorting a stock is a strategy traders use to benefit from unfavorable news by borrowing shares, selling them, and then repurchasing at lower prices.
On the other hand, the positive news encourages going long - that is, purchasing the stock and then selling it at a higher price. This tactic exploits the market sentiment advantage to profit from price fluctuations throughout the day.
Volume Trading Strategy
Using a volume-based technique in day trading helps traders identify trends and possible reversals by acting as if they are monitoring the market's pulse. This method entails examining trading volume, which is a reflection of the total number of shares traded, to make calculated decisions.
Volume spikes are important signals in this approach because they indicate an increased desire to buy or sell. These spikes, frequently associated with large price movements, are used by traders to determine whether to enter or quit a transaction. Analysis of the volume profile reveals volume nodes and strong support or resistance levels.
The On-Balance Volume (OBV) indicator confirms trends and suggests possible reversals by displaying overall buying or selling pressure based on volume fluctuations. The use of volume analysis in day trading facilitates accurate decision-making by providing helpful insights into market sentiments.
High-frequency Trading Strategy
High-frequency trading, or HFT, is a tech-driven day trading technique that takes advantage of rapid price changes by employing cutting-edge algorithms and quick execution. HFT companies trade quickly, completing several orders in milliseconds. By quoting bid and ask prices and earning from the spread, market-making creates liquidity, whereas arbitrage trading takes advantage of market price disparities. Statistical arbitrage guides fast trades by identifying trends using mathematical models.
HFT success depends on advanced technology hardware, low latency infrastructure, and highly optimized algorithms. HFT traders have to possess strong risk management skills, an in-depth understanding of market dynamics, and the flexibility to quickly adjust to the lightning-fast nature of day trading.
B. How to Start Day Trading Stocks with VSTAR
Are you ready to start trading stocks on a daily basis? VSTAR is a reliable partner with its user-friendly design and extensive functionality that makes trading easier for both novices and professionals.
Register first and become acquainted with the site. Analyze possible stocks by using VSTAR's market analysis tools. Create a strong trading strategy that outlines your entry and exit points, risk tolerance, and desired returns.
Utilize VSTAR's real-time statistics and notifications to stay updated. Stay focused on your goals and be diligent. You may succeed in the stock market by navigating the turbulent world of day trading with confidence if you put in the necessary effort and have the help of VSTAR.


Conclusion
Day trading has both opportunities and problems. Every strategy we have examined, ranging from high-frequency trading to reversal, has a distinct edge in the dynamic stock market.
Making wise decisions and managing risks well are essential for day trading success. Day traders may minimize possible losses and maximize their chances of success by carefully examining and choosing stocks, as well as by using effective risk management techniques.


