Welcome to the fascinating realm of Bitcoin trading! Staying ahead of the game is paramount in this fast-paced and ever-evolving market. That is where technical analysis becomes highly critical to trend identification and price predictions.
Imagine being able to predict market trends, identify optimal entry and exit points, and make well-informed decisions that could potentially skyrocket your profits. Technical analysis provides meaning to price movements such that you can maximize situations to make a profit.
This guide will explore everything you need to know about technical analysis for Bitcoin trading. From basic chart patterns to advanced indicators, the guide will unlock the secrets that could transform your trading game forever.
Are you interested in maximizing profit and minimizing the risk of Bitcoin trading? Read on to find out more!
Analyzing Bitcoin Price Charts
Bitcoin, the world's leading cryptocurrency, is a digital asset that has captivated the attention of traders and investors worldwide. Its volatile nature and potential for substantial gains have made it an enticing option for those seeking to capitalize on its price movements.
However, navigating the ever-changing Bitcoin market requires using the right tools. This is where analyzing the Bitcoin price charts along with technical analysis comes into play. Here are some critical uses of technical analysis:
Identify Important Price Levels of Support and Resistance
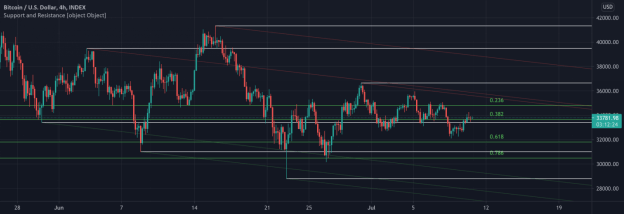
Identification of BTC's price support and resistance levels is a fundamental aspect of technical analysis. Support levels are price points at which buying pressure has historically been strong enough to prevent further price declines. These levels can act as a floor, as buyers tend to enter the market and push prices back up.
On the other hand, resistance levels are price points at which selling pressure has historically been strong enough to prevent further price increases. These levels can act as a ceiling, as sellers tend to enter the market and push prices back down.
To identify these crucial levels, look for areas on the chart with multiple price touches or a history of reversed trends. These are areas where the market has reacted strongly in the past, indicating significant buying or selling activity.
For example, suppose the price of Bitcoin has consistently bounced off a specific level multiple times. In that case, it suggests that buyers are stepping in at that level, providing support. Conversely, suppose the price has repeatedly struggled to break through a particular level. In that case, it indicates strong selling pressure, creating a resistance zone.
Detect Key Chart Patterns
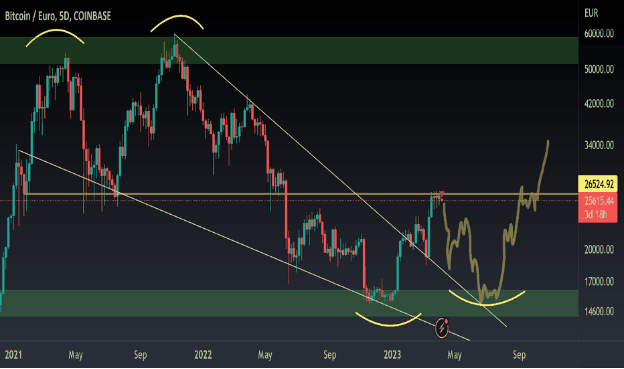
Chart patterns are visual formations that appear on price charts and provide valuable information about the market sentiment and potential future price movements. By identifying and understanding these patterns, you can gain a significant edge in predicting Bitcoin's next move.
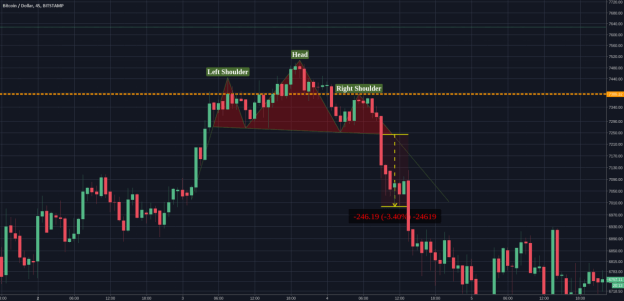
Head and Shoulders Pattern:
The head and shoulders pattern is a powerful reversal pattern characterized by three peaks—the middle peak (the head), which is higher than the other two (the shoulders). This pattern suggests a shift in trend from bullish to bearish and is often seen as a signal to sell or enter short positions.
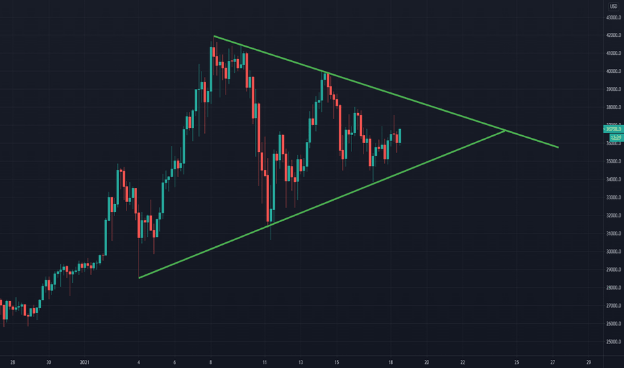
Triangles:
Triangles are continuation patterns that occur when the price forms a series of higher lows and lower highs, converging toward a point. There are three types of triangles—ascending, descending, and symmetrical. Ascending triangles indicate a potential bullish breakout, while descending triangles suggest a bearish breakout. Symmetrical triangles imply a period of consolidation before a potentially significant price move.
Flags:
Flags are short-term continuation patterns that occur after a sharp price movement. They appear as parallel trendlines, with the flagpole representing the initial sharp move and the flag forming a consolidation phase. A breakout from the flag pattern typically indicates the resumption of the previous trend.
Double Tops/Bottoms:
Double tops and double bottoms are reversal patterns characterized by two consecutive peaks or troughs. A double top forms when the price fails to break above a previous high, indicating a potential trend reversal from bullish to bearish. Conversely, a double bottom forms when the price fails to break below a previous low, suggesting a potential trend reversal from bearish to bullish.
Identify Trends
Trends are the lifeblood of trading. They represent the prevailing direction and momentum of price movements, allowing traders to align their strategies with the market. By identifying trends early, traders can position themselves for potential profits and avoid costly mistakes. Here are some methods to identify trends in Bitcoin trading:
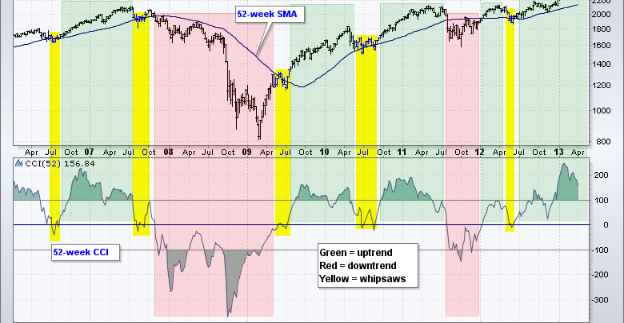
Moving Averages:
Moving averages are widely used indicators that smooth out price data over a specified period. They help identify the market's general direction by filtering out short-term price fluctuations. The two most common types of moving averages are the simple moving average (SMA) and the exponential moving average (EMA). Look out for the crossover of shorter-term moving averages above or below longer-term moving averages, which may signal a potential trend reversal or continuation.
Trend Lines:
Trend lines are lines drawn on a price chart to connect successive highs or lows. An upward trend line is drawn by connecting higher lows, while a downward trend line is drawn by connecting lower highs. Trend lines act as dynamic support or resistance levels and can help traders visualize the overall trend direction.
The slope of Highs/Lows:
Another technique to identify trends is observing the slope of highs and lows on a price chart. In an uptrend, the slope of higher highs and higher lows indicates a bullish trend.
Alternatively, in a downtrend, the slope of lower highs and lower lows indicates a bearish trend. By analyzing the steepness or shallowness of these slopes, traders can assess the strength of the trend and make informed trading decisions.
When applying these techniques, it is important to consider the timeframe that aligns with your trading strategy. Trends may differ across various timeframes, and what appears as a trend on a shorter timeframe may be a mere retracement on a longer timeframe.
Detect Volatility Changes
Volatility, the measure of price variability, plays a crucial role in trading. It indicates the degree of price fluctuations and can provide valuable information about market sentiment and potential opportunities. By detecting changes in volatility, traders can anticipate significant price changes or trends. Here are two methods commonly used to identify volatility changes in Bitcoin trading:
Height of Candlesticks:
Candlestick charts provide a visual representation of price movements and are a popular tool among technical analysts. The height of individual candlesticks can indicate the level of volatility in the market. Taller candlesticks represent higher volatility, while shorter candlesticks suggest lower volatility. Significant drops in volatility often precede significant price changes or trends.
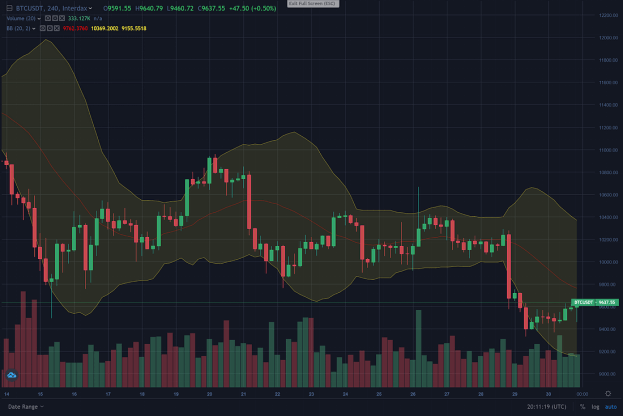
Bollinger Band Width:
Bollinger Bands are a technical indicator that consists of a moving average (usually a simple moving average) and two standard deviation bands plotted above and below the moving average. The Bollinger Band width measures the distance between the upper and lower bands. A narrower width suggests lower volatility, while a wider width indicates higher volatility.
Analyze Volume to Determine Conviction Behind Price Moves
Volume, the number of shares or contracts traded within a specified period, is a vital component of technical analysis. It provides insights into market participants' convictions and can help validate or invalidate price moves. Here is how you can utilize volume analysis in your Bitcoin trading:
Spikes in Volume:
Significant spikes in trading volume often indicate a surge in market activity and can signal potential reversals or the beginning of new trends. For example, a sudden increase in volume accompanying a price breakout suggests strong conviction. Therefore, it increases the likelihood of a sustained move.
Declining Volume:
Declining volume can suggest waning momentum and may require a catalyst to revive the trend. When prices continue to rise or fall on decreasing volume, it indicates a lack of strong conviction from market participants.
It is important to note that volume analysis should be used with other technical indicators and analysis methods to understand market dynamics comprehensively. Combining volume analysis with price patterns, trend lines, and other indicators can enhance the accuracy of trading decisions.
Key Technical Indicators for Bitcoin
To navigate this dynamic market successfully, traders rely on various technical indicators that provide valuable insights into price trends, reversals, and trading opportunities. Below are the key technical indicators for Bitcoin trading and how they can enhance your decision-making process.
RSI (Relative Strength Index)
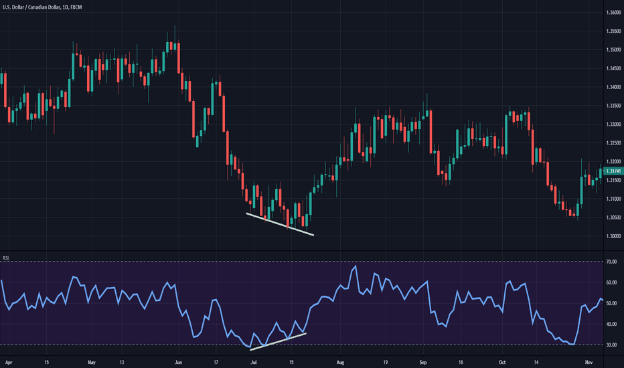
The Relative Strength Index (RSI) is a popular oscillator that measures the speed and change of price movements. It helps identify overbought and oversold levels, indicating potential trend reversals or corrections.
The RSI ranges from 0 to 100, with values below 30 considered oversold and values above 70 considered overbought. Traders often look for divergences between the RSI and price action to identify potential trading opportunities.
MACD (Moving Average Convergence Divergence)
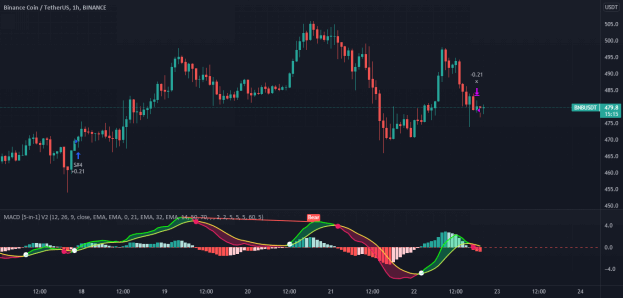
The Moving Average Convergence Divergence (MACD) is a trend-following momentum indicator that shows the relationship between two moving averages of a security's price. It consists of a MACD line, a signal line, and a histogram representing the difference between the two lines.
When the MACD line crosses above or below the signal line, or the histogram crosses the zero line, it signals potential trend changes or accelerations. Traders often use MACD crossovers to identify entry and exit points.
Moving Averages
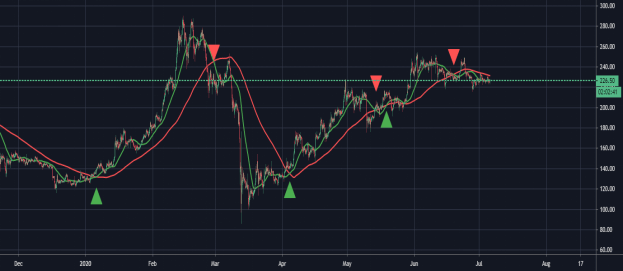
Moving averages (MAs) are widely used technical indicators that smooth out price data over a specified period. They help filter out price noise, identify support and resistance levels, and determine trends and reversals. Shorter moving averages, such as the 20-day or 50-day MA, are more responsive to price changes and provide timely signals.
On the other hand, longer moving averages, such as the 100-day or 200-day MA, show stronger trends and can act as significant support or resistance levels.
Bollinger Bands
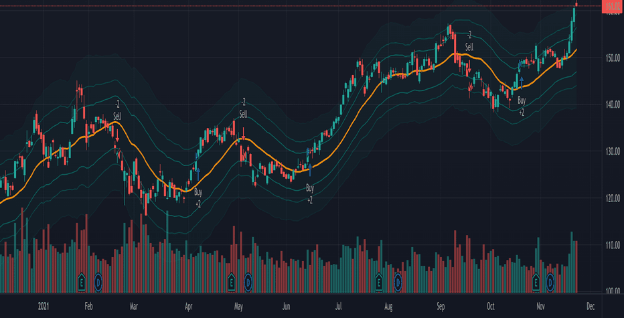
Bollinger Bands consist of a simple moving average (typically 20 periods) and two standard deviation bands plotted above and below the moving average. They measure price volatility and provide a visual representation of price channels.
When the Bollinger Bands narrow, it indicates decreasing volatility, often preceding increased price movement. Conversely, expanding Bollinger Bands suggest increasing volatility. Price touching the upper or lower band can also signal potential trend reversals.
Ichimoku Cloud
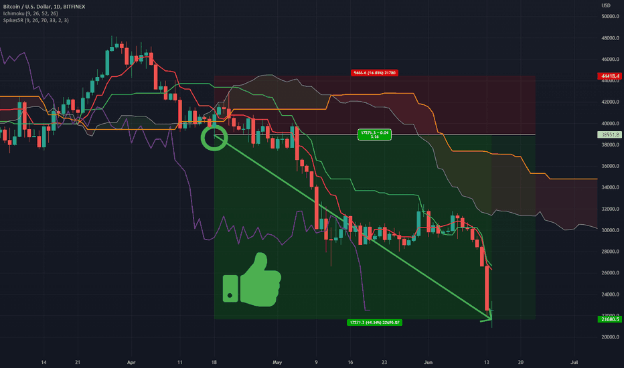
The Ichimoku Cloud is a comprehensive technical indicator that provides support and resistance levels, trend information, and potential trend reversals. It consists of several lines and a shaded area known as the cloud.
When the price is above the cloud, it is considered bullish; when it is below the cloud, it is considered bearish. Crossovers between the lines (such as the Tenkan-sen and Kijun-sen) can indicate potential trend reversals or confirmations.
Candlestick Patterns
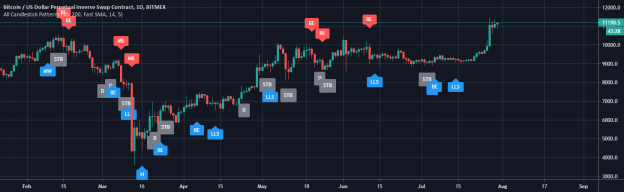
Candlestick patterns are formed by the arrangement of individual candlesticks on a price chart. Certain patterns, like engulfing patterns, doji, hammers, or shooting stars, can provide insights into potential trend reversals or continuations. It is important to consider these patterns in the context of existing trends, support and resistance levels, and other technical indicators for confirmation.
It is crucial to note that technical indicators should not be used in isolation. Rather, use them in conjunction with each other and other forms of analysis. Additionally, risk management techniques should always be employed to mitigate potential losses.
Develop a Trading Strategy
Successful trading in the Bitcoin market requires more than just a basic understanding of technical indicators. It necessitates the development of a well-defined trading strategy that incorporates various elements to guide your decision-making process.
i. Combining Indicators
Combining multiple indicators can provide more robust trading signals and increase the probability of success. For example, you can look for confluence between different indicators.
If the price breaks below a trend line and the lower Bollinger Band while the RSI drops below 30, it could signal a potential reversal and an opportunity to sell short. Experimenting with different combinations of indicators can help you refine your trading strategy and identify high-probability trading setups.
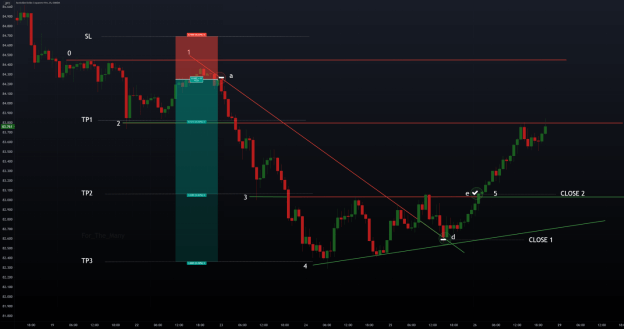
ii. Entry and Exit Rules
Establishing clear entry and exit rules is crucial for executing trades effectively. Define specific conditions or price levels that trigger your entry into a trade. For instance, you may decide to buy when the price breaks above a certain resistance level or sell when it drops below a key support level.
Additionally, determine your profit target levels and when to take profits. Consider incorporating trailing stops or adjusting stop-loss levels based on market conditions. Be mindful of fees and slippage when setting profit targets and stop-loss levels to ensure they are realistic and achievable.
iii. Timeframes
Utilizing multiple timeframes can provide valuable insights into Bitcoin's price action and help you make well-informed trading decisions. Longer-term timeframes, such as daily or weekly charts, can be used to identify overall trends and establish a broader market bias.
Shorter-term timeframes, such as 1-hour or 4-hour charts, can assist in timing your entries and exits more precisely. Intraday timeframes, like 30-minute or 15-minute charts, are useful for closely monitoring positions and making quick adjustments. Combining different timeframes allows you to gain a comprehensive view of the market and improve the timing of your trades.
iv. Backtesting
Backtesting your trading strategy using historical data is essential in evaluating its profitability and reliability. Applying your strategy to past market conditions allows you to assess how it would have performed in different scenarios.
Backtesting helps you identify strengths and weaknesses in your strategy and refine it accordingly. Consider adjusting parameters such as stop-loss levels, profit targets, timeframes, or entry and exit rules to optimize your strategy for better performance. Keep in mind that while backtesting can provide valuable insights, it does not guarantee future results.
v. Managing Risk:
Risk management is a critical aspect of any trading strategy. It is useful to protect your capital and minimize losses. Only risk a small percentage of your capital per trade, typically 1-5% at most, to avoid significant loss. Set stop-loss orders for all positions to limit potential losses in case the market moves against you.
Furthermore, book profits along the way as the trade progresses. This ensures that you secure gains while maintaining a favorable risk-reward ratio. Avoid overexposure by limiting the size of your positions, especially when trading volatile assets like Bitcoin.
Conclusion
This guide has explored the significance and methods of technical analysis in Bitcoin trading. Analyzing Bitcoin price charts can help traders identify support/resistance levels, detect trend signals, and trend strength to predict the BTC’s price movement.
Relative strength index, Mean average convergence divergence, Moving averages, Bollinger bands, Ichimoku cloud, and Candlestick patterns are critical technical indicators for trading BTC.
In addition, developing a trading plan that maximizes technical indicator tools with risk management strategies is essential. However, choosing a reputable exchange like Vstar is critical to trading BTC. Vstar is a reliable broker that provides institutional-level trading experience, including the lowest trading cost, which means tight spread and lightning-fast execution.


Finally, Vstar is regulated by CySEC, which is essential when choosing a broker. Some crypto exchange platforms are often unregulated and have a high commission, which can negatively affect your profit. We also offer a demo account for beginners to practice trading strategies to mitigate loss during actual trading.
We are excited as you decide to create an account with us and begin trading!