


- Despite recent underperformance compared to the S&P 500, BlackRock has shown strong returns over longer periods.
- BlackRock exhibited robust financial performance in 2023, with significant net inflows, base fee growth, and increased quarterly operating income and EPS.
- BlackRock's acquisition of Global Infrastructure Partners (GIP) aims to bolster its presence in the infrastructure investment market, with expected asset growth and synergies.
- BlackRock maintains a strong operating margin but faces challenges such as declining margins and slow base fee growth, requiring careful cost management amidst growth investments.
The article delves into BlackRock's (NYSE: BLK) recent performance, spotlighting its price trajectory vis-à-vis the S&P 500 along with fundamental strengths such as financial performance, strategic acquisitions, and operational efficiencies. Despite growth potential, challenges like slow base fee growth and declining operating margins pose concerns. The industry projections remain optimistic, with bullish forecasts and technical analysis further illuminating BlackRock's trajectory.
BLK Stock Price Performance
Over the past week, BlackRock saw a price return of -2.77%, underperforming the S&P 500 which experienced a -0.65% return. Similarly, over the last month, BLK returned -3.85% compared to the S&P 500's 1.68%. However, over a six-month period, BLK exhibited strong performance with a price return of 24.01%, outpacing the S&P 500's 20.92%. Year-to-date, BLK returned -0.97% while the S&P 500 returned 9.23%.
In the one-year timeframe, BLK's price return stood at 22%, below the S&P 500's 27%. Over three years, BLK returned 0.41% versus the S&P 500's 27.16%. Over five years, BLK delivered a price return of 80.19% compared to the S&P 500's 79.91%. Over ten years, BLK significantly outperformed with a price return of 165.84% versus the S&P 500's 181.32%.
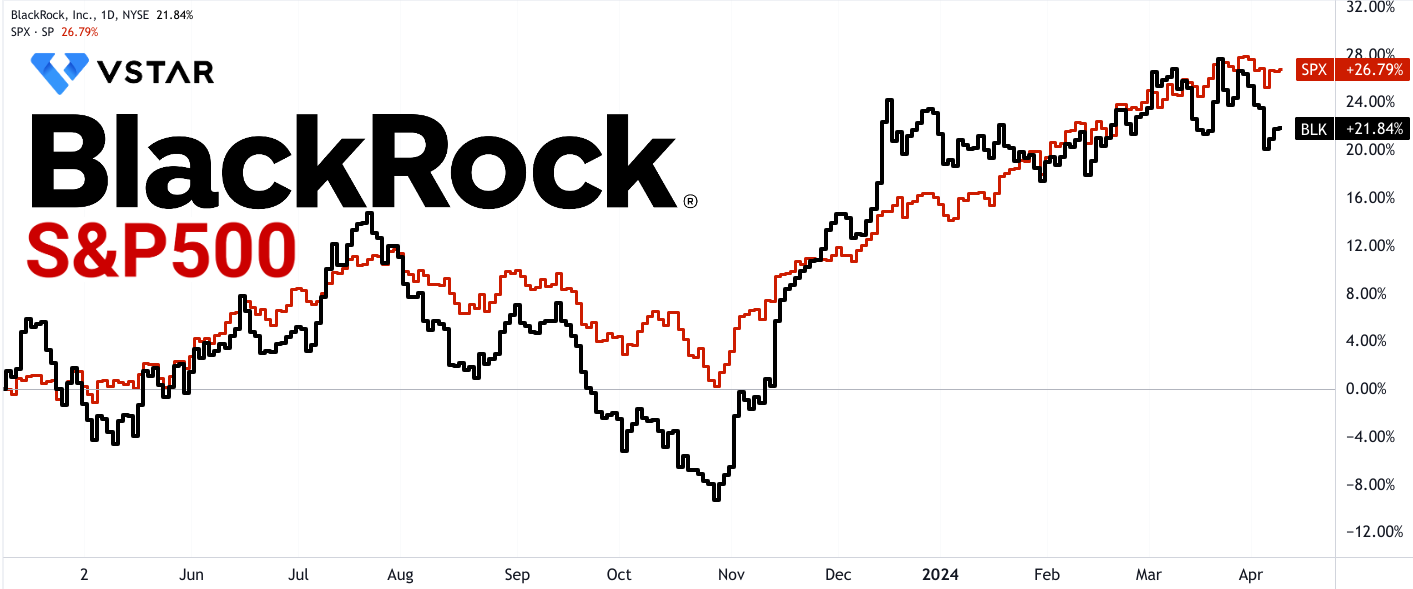
Source: tradingview.com
BlackRock Fundamental Strengths
Financial Performance and Business Results:
BlackRock's financial performance serves as a fundamental indicator of its growth potential.
In 2023, BlackRock experienced robust total net inflows of $289 billion, demonstrating its ability to attract significant assets under management (AUM). This influx of capital indicates strong client confidence in BlackRock's investment offerings and management capabilities. Moreover, the substantial momentum observed in the fourth quarter, with approximately $96 billion of total net inflows, suggests that BlackRock maintained its competitive edge throughout the year.
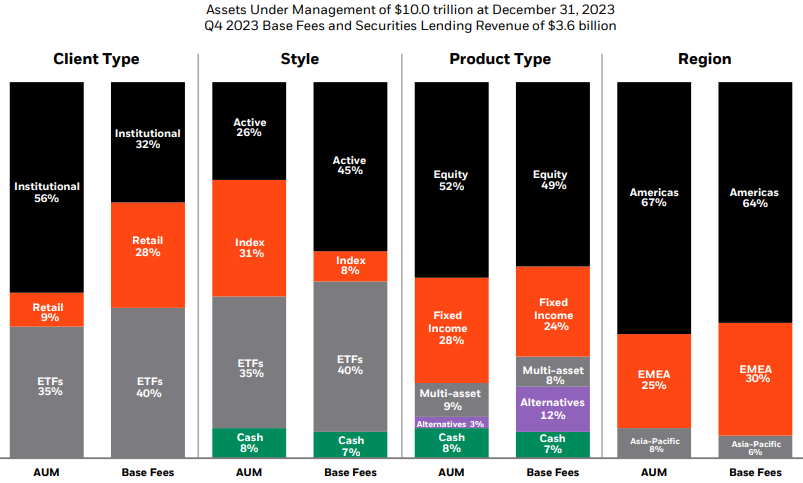
Source: Q4 2023 Earnings
An essential metric in assessing BlackRock's financial performance is its organic base fee growth. The annualized organic base fee growth for the last two full months of 2023 was at 6%, indicating a steady increase in fee-generating assets under management. This growth trajectory reflects BlackRock's ability to generate consistent revenue streams from its investment products and services.
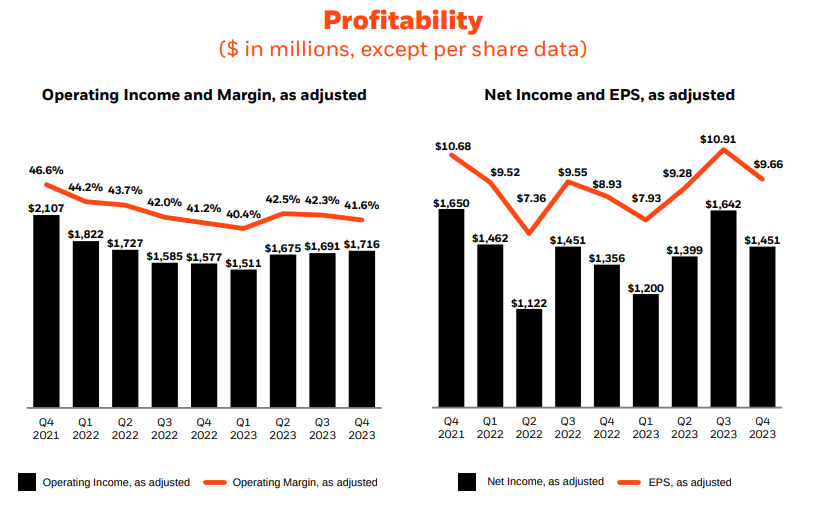
Quarterly operating income provides insights into BlackRock's operational efficiency and profitability. Operating income increased by 9% to $1.7 billion in the fourth quarter of 2023, compared to the previous year. This growth in operating income suggests that BlackRock effectively managed its operating expenses while capitalizing on revenue opportunities, resulting in improved profitability.
EPS is a critical metric for assessing shareholder value and profitability. BlackRock's EPS increased by 7% to $37.77 in 2023, indicating that the company translated its revenue growth into higher earnings for shareholders. This growth in EPS reflects BlackRock's ability to generate sustainable returns and deliver value to its investors.
While full-year revenue remained relatively flat year-over-year at $17.9 billion, it's essential to note that BlackRock's revenue stability amidst market fluctuations demonstrates its resilience and diversified revenue streams. Despite external challenges, BlackRock maintained its revenue base, highlighting its strong market position and client relationships.
Acquisition of GIP (Global Infrastructure Partners):
The acquisition of GIP represents a strategic move by BlackRock to expand its presence in the fast-growing infrastructure investment market.
GIP's current client AUM exceeding $100 billion and fee-based AUM over $60 billion signify its substantial market presence and revenue potential. By acquiring GIP, BlackRock aims to capitalize on the growing demand for infrastructure investments and strengthen its position in this lucrative market segment.
The planned integration of BlackRock's infrastructure platform with GIP is expected to triple BlackRock's infrastructure client assets to over $150 billion post-closing. This significant increase in assets under management demonstrates the scale of opportunities arising from the acquisition and positions BlackRock as a leader in the infrastructure investment space.
GIP's strong track record of delivering impressive returns and its dedicated investment in operational improvement teams further enhance BlackRock's capabilities in infrastructure investment. GIP's operational improvement teams have a track record of delivering deep value enhancements, leading to impressive returns for clients. By leveraging GIP's expertise, BlackRock can enhance its infrastructure investment offerings and deliver value-added solutions to clients.
The financial terms of the transaction provide additional insights into its significance for BlackRock and its shareholders. The acquisition involves a total consideration of $3 billion in cash and approximately 12 million shares of BlackRock stock. This indicates BlackRock's commitment to the acquisition and its confidence in the long-term value creation potential of the combined entity.
Furthermore, the transaction is structured to ensure alignment of interests between GIP and BlackRock, with a substantial majority of the consideration paid in BlackRock common stock. GIP's leadership will become meaningful shareholders of BlackRock, fostering collaboration and shared goals between the two organizations.
Operating Margin and Expense Management:
BlackRock's operating margin and expense management are crucial factors influencing its profitability and growth potential.
BlackRock's operating margin remained strong, with a fourth-quarter operating margin of 41.6%, reflecting efficient cost management and operating leverage. Operating margin measures the company's profitability by indicating the percentage of revenue that remains after paying operating expenses. BlackRock's ability to maintain a high operating margin demonstrates its efficiency in managing costs and generating profits from its operations.
Despite a slight decline in full-year as-adjusted operating margin by 110 basis points to 41.7%, BlackRock continues to focus on driving operating leverage and profitable growth. Operating leverage refers to the ability of a company to increase its profitability by generating higher revenue while keeping operating expenses relatively stable. While the decline in operating margin may raise some concerns, BlackRock's focus on driving operating leverage suggests its commitment to improving profitability over the long term.
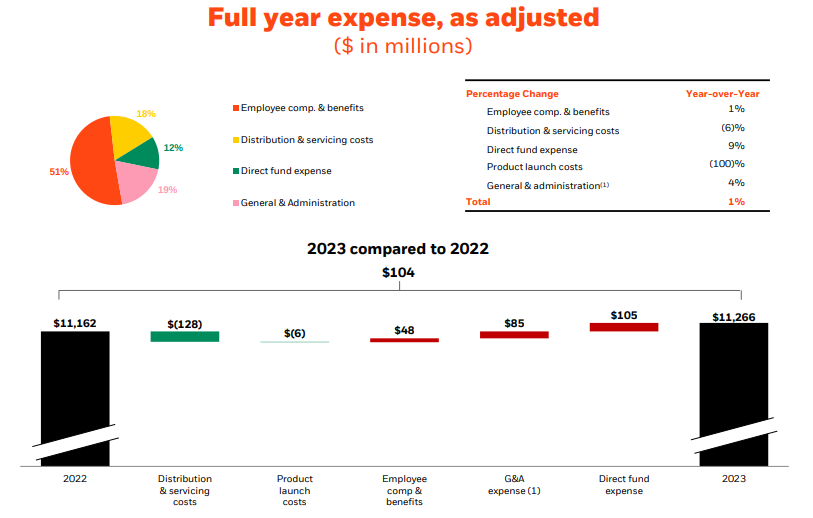
Source: Q4 2023 Earnings
Total expenses increased by only 1% in 2023, reflecting disciplined expense management despite significant investments in growth initiatives. Expense management is critical for maintaining profitability and ensuring sustainable growth. BlackRock's ability to effectively manage expenses while investing in strategic growth initiatives demonstrates its disciplined approach to cost management.
BlackRock's commitment to variabilizing expenses and generating fixed cost scale through technology and automation further enhances its efficiency and scalability. Variabilizing expenses involves aligning costs with revenue fluctuations to maintain profitability and flexibility. By leveraging technology and automation, BlackRock can streamline operations, reduce manual effort, and optimize resource allocation, leading to cost savings and improved efficiency.
Capital Management and Shareholder Returns:
BlackRock's capital management strategy plays a crucial role in enhancing shareholder value and driving long-term growth.
In 2023, BlackRock returned over $4.5 billion to shareholders through dividends and share repurchases, reflecting its commitment to delivering shareholder value. Shareholder returns encompass dividends and share repurchases, both of which represent mechanisms for distributing profits to shareholders. BlackRock's significant return of capital to shareholders underscores its dedication to maximizing shareholder value and rewarding investors for their support.
Share repurchases have been a consistent element of BlackRock's capital management strategy, with close to $15 billion of BlackRock stock repurchased since 2013. Share repurchases involve buying back shares of its own stock from the open market, reducing the number of outstanding shares and increasing earnings per share. BlackRock's ongoing share repurchase program demonstrates its confidence in its future prospects and its belief that its stock is undervalued.
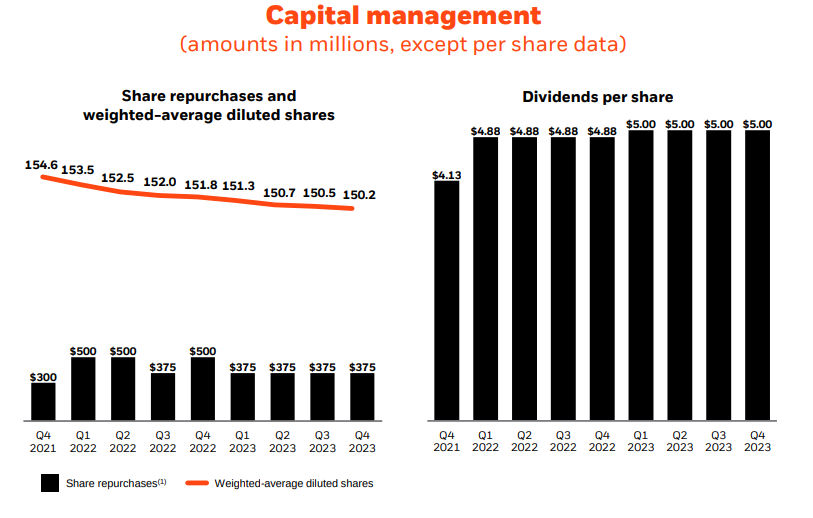
Source: Q4 2023 Earnings
BlackRock's dividend increase of 2% over the previous year and its target of purchasing $1.5 billion of shares during 2024 further underscore its commitment to enhancing shareholder value. Dividends represent a portion of a company's earnings distributed to shareholders on a regular basis. By increasing its dividend and setting ambitious share repurchase targets, BlackRock aims to signal its financial strength and commitment to returning capital to shareholders.
Furthermore, BlackRock's capital management strategy is designed to balance investments in strategic growth initiatives with returning excess cash to shareholders. This balanced approach ensures that BlackRock can fund organic growth opportunities while maintaining a shareholder-friendly capital return policy. By allocating capital efficiently and effectively, BlackRock can drive long-term value creation for shareholders.
BlackRock Fundamental Weakness
Slow Growth in Base Fees:
BlackRock's slow growth in base fees is evident from the reported 1% organic base fee growth in 2023. Despite significant total net inflows amounting to $289 billion, the organic base fee growth remained sluggish. This figure indicates the revenue generated from managing client assets, excluding the impact of market performance or acquisitions. A mere 1% growth suggests that BlackRock may be facing challenges in effectively increasing its fee revenue from existing client assets.
One possible reason for this slow growth could be the intense competition within the asset management industry. As more firms enter the market and offer similar products and services, pricing pressures may limit BlackRock's ability to raise fees. Additionally, shifts in client preferences towards lower-fee products, such as passive index funds or ETFs, could contribute to the stagnation in base fee growth. Despite BlackRock's efforts to innovate and stay ahead of client needs, the competitive landscape may be hindering its ability to command higher fees for its services.
Moreover, regulatory changes or compliance requirements may also impact fee structures, affecting BlackRock's ability to increase base fees rapidly. For example, regulations aimed at promoting fee transparency or restricting certain fee practices could limit BlackRock's flexibility in setting fees at desired levels. As a result, the company may struggle to achieve significant growth in base fees, despite its strong market position and client relationships.
Declining Operating Margin:
BlackRock's declining operating margin, which dropped by 110 basis points to 41.7% in 2023, raises concerns about the efficiency and profitability of the company's operations. Operating margin measures the percentage of revenue that remains after covering operating expenses, indicating the company's ability to generate profits from its core business activities. A decline in operating margin suggests that BlackRock may be facing challenges in controlling costs or optimizing operational efficiency.
Several factors could contribute to the decline in operating margin. Increased operating expenses, such as compensation, general and administrative expenses, or direct fund expenses, may be putting pressure on profitability. For example, rising compensation costs associated with attracting and retaining top talent or investing in technology and infrastructure could erode margins over time. Similarly, investments in strategic growth initiatives or business expansion efforts may temporarily increase expenses without immediately translating into revenue growth.
Additionally, external factors such as market volatility, regulatory changes, or geopolitical uncertainties may impact BlackRock's operating margin. For instance, fluctuations in asset prices or changes in interest rates could affect the company's investment performance and fee revenue, influencing overall profitability. Moreover, regulatory compliance costs or legal expenses related to litigation or enforcement actions may further strain operating margins.
Source: Q4 2023 Earnings
BlackRock Outlook
EPS Estimates:
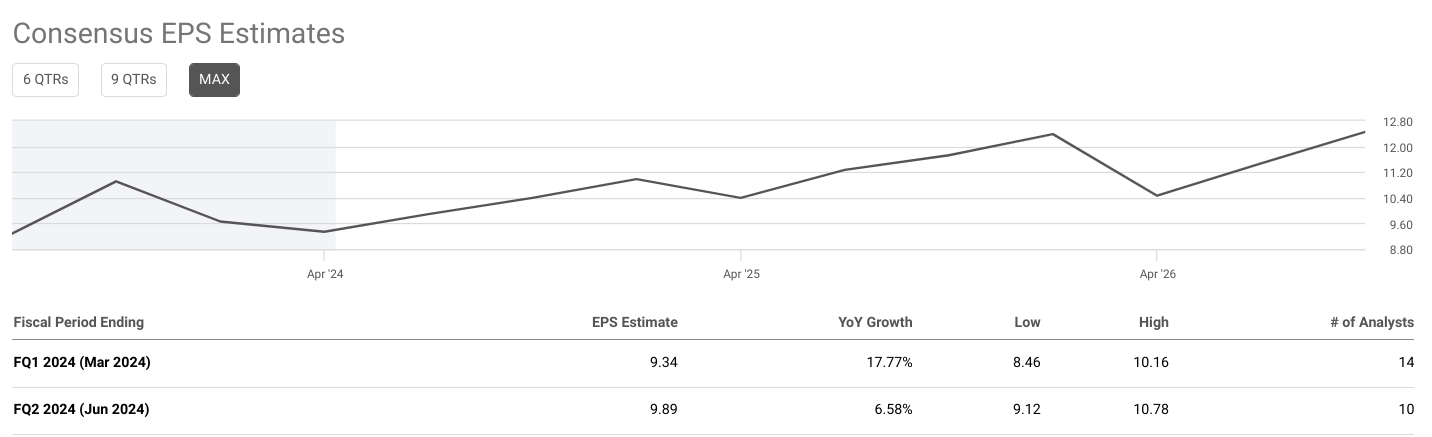
BlackRock's EPS estimates provide crucial insights into the company's financial performance and growth potential. In FQ1 2024 (ending March 2024), the consensus EPS estimate stands at $9.34 with a year-over-year (YoY) growth rate of 17.77%. For FQ2 2024 (ending June 2024), the EPS estimate is $9.89, indicating a slightly lower YoY growth rate of 6.58%.
The YoY growth rates signify the pace at which BlackRock's earnings are expected to increase compared to the corresponding periods in the previous year. A higher YoY growth rate suggests robust performance and indicates the company's ability to generate higher profits. However, it's important to note that the growth rate for FQ2 2024 is lower than FQ1, which might indicate potential challenges in maintaining the same level of growth momentum.
Analyzing the range of EPS estimates (from low to high) provides a perspective on the level of uncertainty among analysts regarding BlackRock's earnings. In both FQ1 and FQ2 2024, the range is relatively narrow, indicating a consensus among analysts regarding the company's earnings potential. This consensus is further supported by the number of analysts providing estimates, which is 14 for FQ1 and 10 for FQ2.
Source:seekingalpha.com
Revenue Estimates:
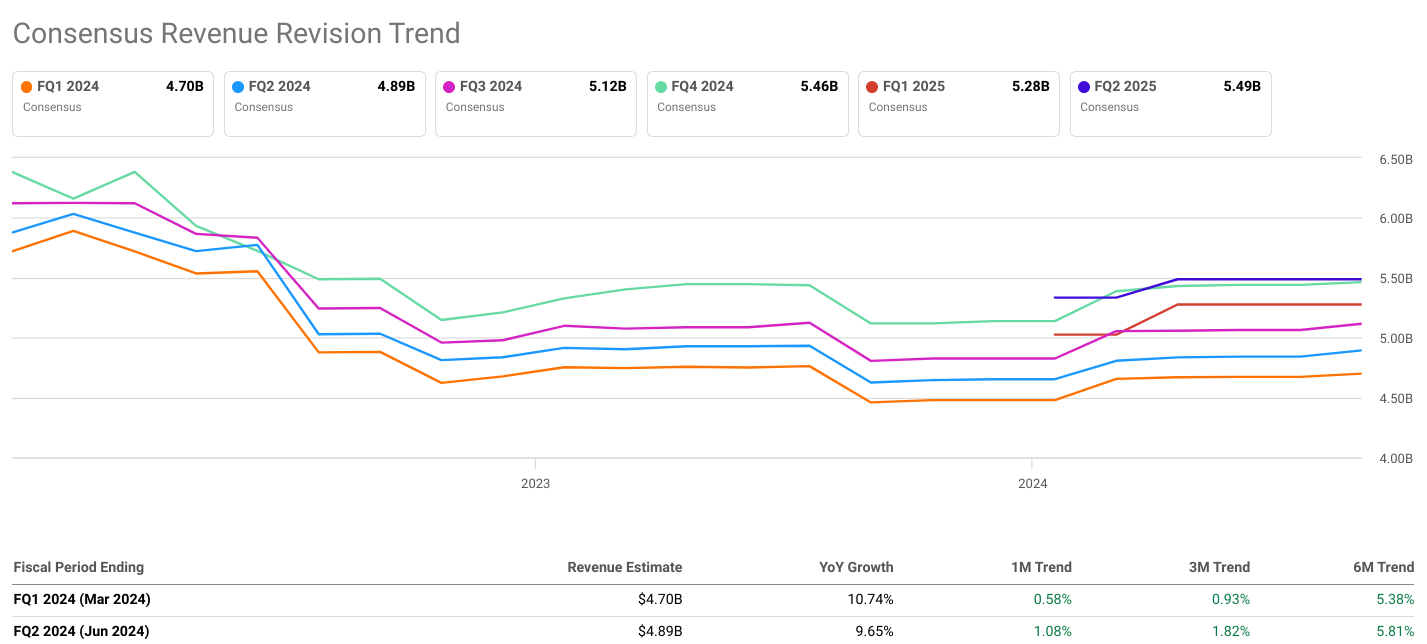
Revenue estimates offer insights into BlackRock's ability to generate income from its operations. In FQ1 2024, the consensus revenue estimate is $4.70 billion, representing a YoY growth rate of 10.74%. For FQ2 2024, the revenue estimate is slightly higher at $4.89 billion, with a YoY growth rate of 9.65%.
Similar to EPS estimates, the YoY growth rates for revenue indicate the expected rate of increase in BlackRock's total revenue compared to the same periods in the previous year. While the growth rates for both quarters remain positive, the slightly lower rate for FQ2 2024 suggests a potential moderation in revenue growth.
The range of revenue estimates reflects analysts' varying expectations regarding BlackRock's revenue performance. In both FQ1 and FQ2 2024, the range is relatively narrow, indicating a consensus among analysts regarding the company's revenue potential. However, the number of analysts providing estimates (8 for each quarter) is comparatively lower than that for EPS estimates, which may introduce some level of uncertainty.
Consensus Revision Trends:
Consensus revision trends provide insights into how analysts' expectations regarding BlackRock's financial performance evolve over time. For both EPS and revenue estimates, the 1-month, 3-month, and 6-month trends indicate the direction and magnitude of revisions to the estimates.
In terms of EPS revision trends, both FQ1 and FQ2 2024 show consistent upward trends across the 1-month, 3-month, and 6-month periods. This indicates a growing consensus among analysts regarding BlackRock's earnings potential, with expectations gradually improving over time. However, the rate of increase in the trend appears to slow down over the 6-month period, suggesting a potential plateauing of growth expectations.
Similarly, revenue revision trends also show positive momentum, with upward trends across the 1-month, 3-month, and 6-month periods for both FQ1 and FQ2 2024. This indicates increasing confidence among analysts regarding BlackRock's revenue generation capabilities. As with EPS revision trends, the rate of increase in the trend slows down over the 6-month period, suggesting a stabilization of revenue growth expectations.
Source:seekingalpha.com
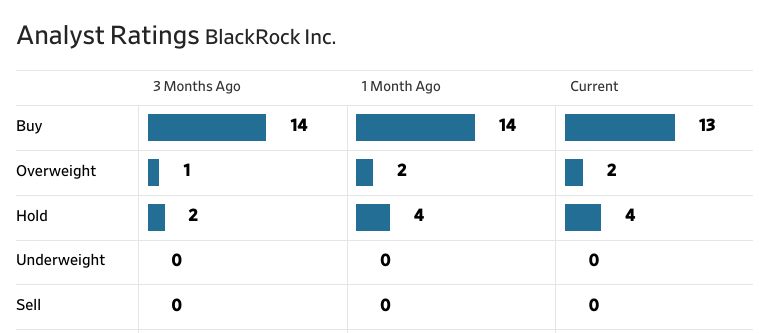
Analyst Ratings:
Analyst ratings provide an overview of market sentiment towards BlackRock's stock, reflecting analysts' recommendations based on their assessment of the company's performance and outlook. The ratings categories include Buy, Overweight, Hold, Underweight, and Sell.
As of the most recent data, the majority of analyst ratings for BlackRock are positive, with 13 Buy ratings, 2 Overweight ratings, and 4 Hold ratings. There are no ratings in the Underweight or Sell categories. This distribution of ratings indicates a generally favorable sentiment towards BlackRock's stock among analysts.
Comparing the ratings over the past 3 months, there has been a slight decrease in the number of Buy ratings, from 14 to 13, while the number of Hold ratings has increased from 2 to 4. This suggests a potential shift in sentiment or increased caution among analysts regarding BlackRock's stock. However, the absence of any Underweight or Sell ratings indicates a lack of significant negative sentiment towards the stock.
Industry Projections:
Industry projections provide insights into broader market trends and dynamics that may impact BlackRock's growth prospects.
According to ResearchAndMarkets.com, the investment banking market is expected to experience significant growth, with the market size projected to increase from $131.25 billion in 2023 to $142.16 billion in 2024, representing a compound annual growth rate (CAGR) of 8.3%. Furthermore, the projection of the market reaching $194.05 billion by 2028 at a CAGR of 8.1% underscores the enduring momentum and vitality of the industry. These projections suggest favorable conditions for BlackRock's growth, as the company operates within the investment management sector and stands to benefit from the overall expansion of the market.
BlackRock Valuation
Valuation Grade and Underlying Metrics
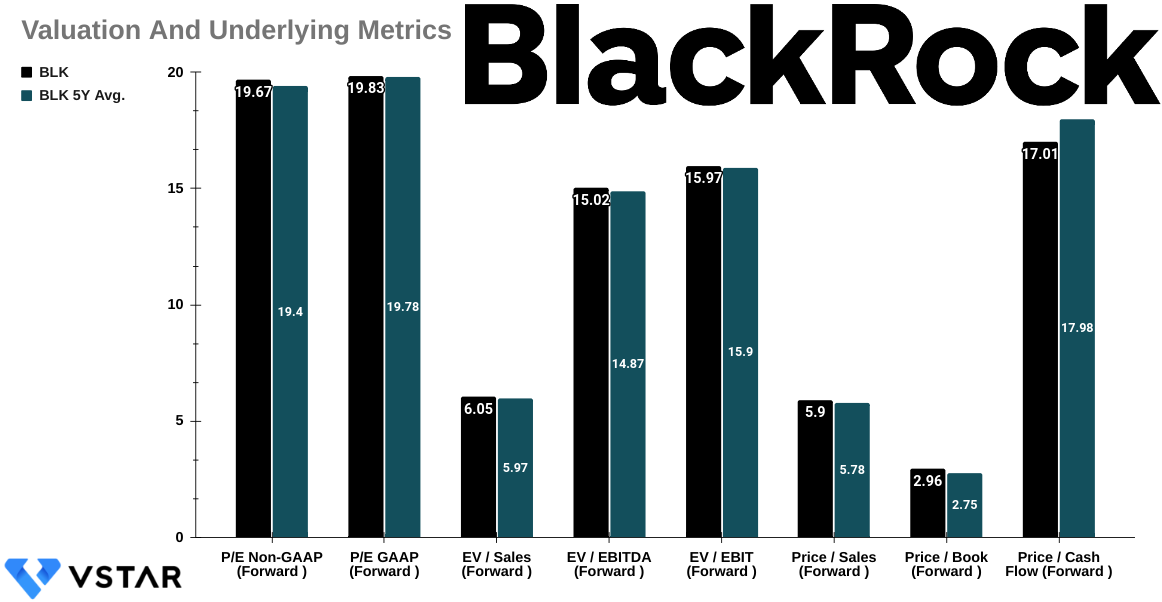
The P/E ratios for BlackRock (BLK) indicate that the stock is trading at slightly higher multiples compared to its 5-year average. The P/E Non-GAAP (Forward) is 1.39% higher, and the P/E GAAP (Forward) is 0.27% higher than the respective 5-year averages. This suggests that investors are willing to pay a slightly higher premium for BlackRock's earnings compared to the historical trend.
The EV metrics provide insights into how the market values BlackRock relative to its sales and earnings. All three metrics show a slight increase compared to the 5-year averages, with EV / Sales (Forward) showing a 1.32% increase, EV / EBITDA (Forward) showing a 0.97% increase, and EV / EBIT (Forward) showing a 0.45% increase. This indicates a modestly higher valuation placed on the company based on its enterprise value relative to its sales and earnings.
Price-based metrics shed light on how the market values BlackRock in terms of its stock price relative to various financial metrics. All three metrics are higher compared to their 5-year averages. Notably, Price / Book (Forward) shows a substantial increase of 7.47%, indicating a higher premium placed on BlackRock's book value per share. Price / Sales (Forward) and Price / Cash Flow (Forward) also show increases of 2.10% and 5.41% respectively. This suggests that investors are willing to pay more for each unit of sales, book value, and cash flow compared to historical trends. In short, the stock is slightly overvalued.
Source: Analyst's compilation
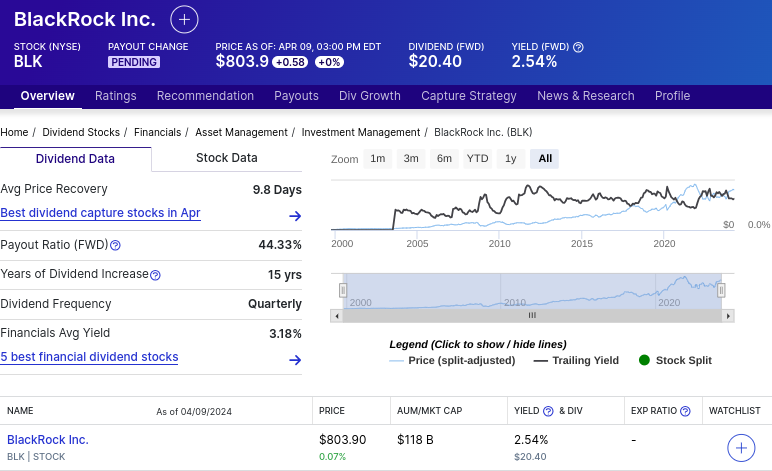
Dividend Summary
BLK offers a dividend yield of 2.54%, with an annual payout of $20.40 and a payout ratio of 52.94%. The 5-year growth rate for dividends is 10.07%, and the company has maintained a consistent dividend growth for 15 years. These dividend metrics indicate that BLK is a dividend-paying stock with a moderate yield and a history of increasing payouts, appealing to income-oriented investors.
Source: Dividend.com
Analyst Forecasts and Ratings
Blackrock Stock Forecast:
According to CNN and WSJ data, analysts provide a range of forecasts for BLK's stock price over the next 12 months. The median forecast from both sources is around $916.50, representing a significant increase from the current price of $803.90. The high-end forecasts suggest even greater potential appreciation, with a high forecast of $1,030.00. These forecasts indicate positive sentiment among analysts regarding BLK's future stock price performance.
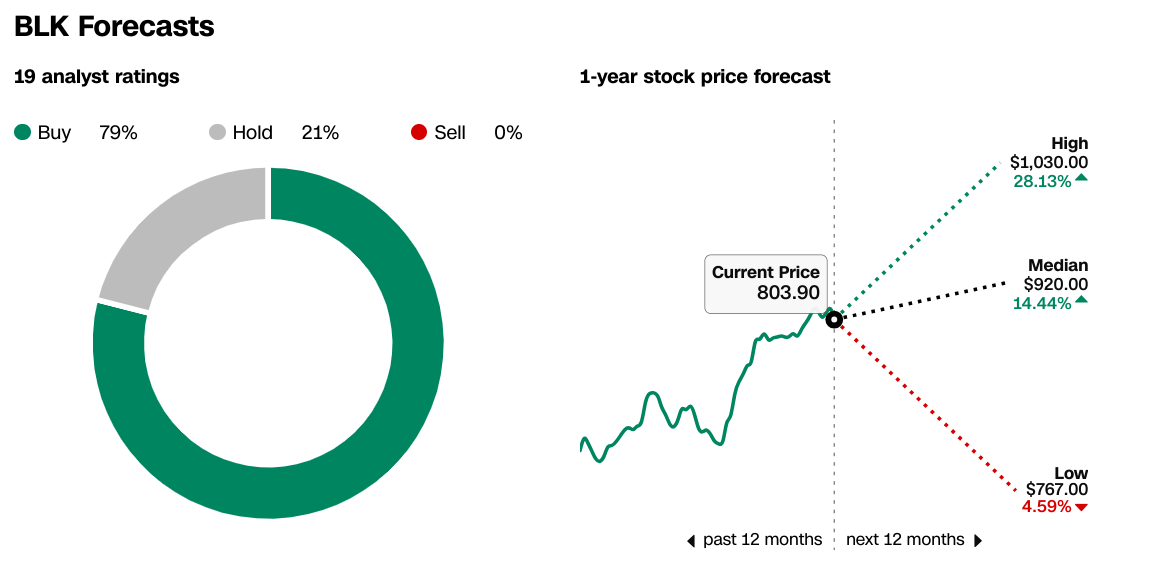
Source: CNN.com
Analyst Ratings:
Analyst ratings for BLK have remained relatively stable over the past three months, with a majority of analysts maintaining "Buy" or "Overweight" recommendations. This consistency suggests a consensus among analysts regarding the attractiveness of BLK as an investment. However, it's worth noting any shifts in ratings or sentiment, as changes in analyst recommendations can influence investor behavior and stock performance.
source: WSJ.com
BLK Stock Forecast Technical Take
BlackRock stock price may hit $983 by the end of 2024 based on a moderated estimate. Optimistically, the price may hit $1105 based on short-term price swings projected over Fibonacci retracement and extension levels. Similarly, the moderated price target of $983 is based on mid-term price swings. However, the attainability of a modest price target holds a major probability. Currently, the price is at a major support zone ($801.35–$790.65). This support zone is the upper bond of the current horizontal price channel. On the down side, $717.10 serves as a critical support level by being the pivot of the price channel.
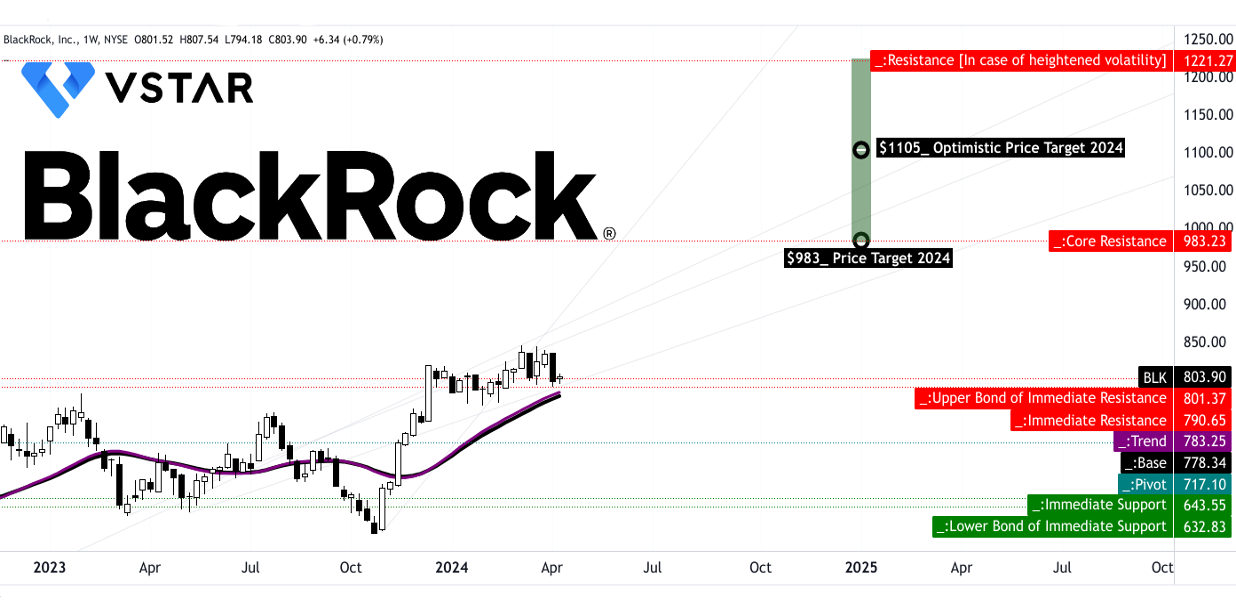
Source: tradingview.com
Looking at the relative strengths index (RSI), standing at 56, the price may take support at the current level with the RSI at 50 and reverse upward since the RSI is hovering below the current regular-bullish level of 64 after forming a bearish divergence at the top of the current price swing. However, moving average convergence or divergence (MACD) signifies a possible correction in the stock price. MACD line has just breached down the signal line, with the histogram singling exhaustion of current bullish momentum. In short, long-term positions can be established between $801.35 and $717.10 based on the dollar cost average methodology.
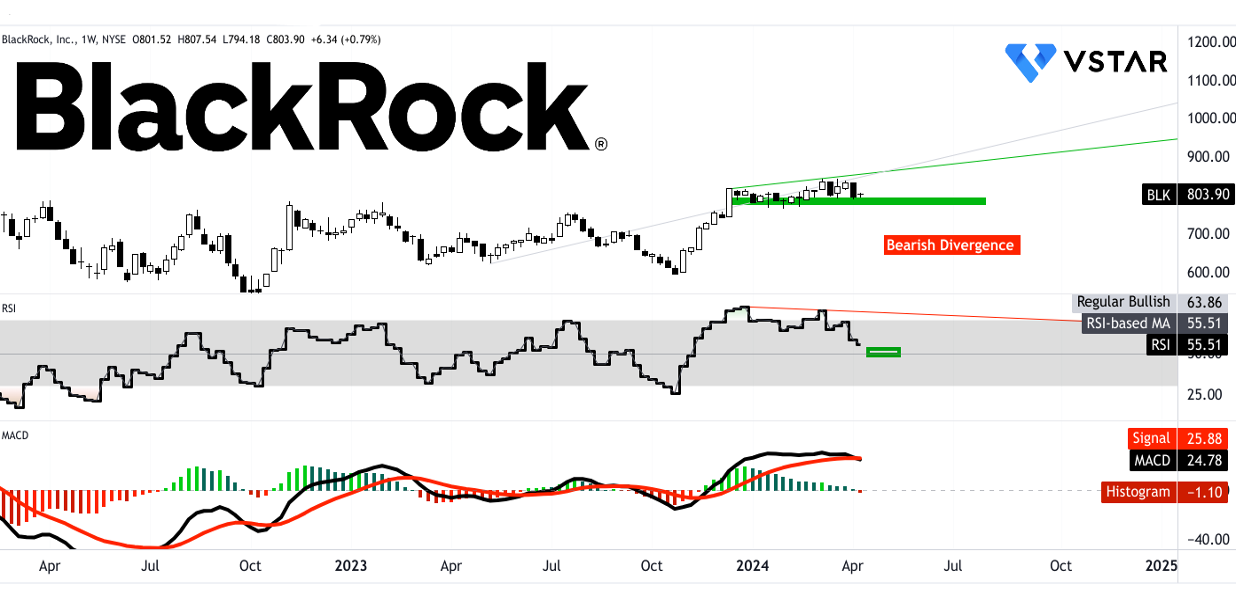
Source: tradingview.com
In conclusion, despite intermittent underperformance against the S&P 500, BlackRock demonstrates resilience and growth potential over longer periods. Fundamental strengths like robust financial performance and strategic acquisitions counterbalance challenges such as slow base fee growth. Positive EPS and revenue estimates, alongside analyst sentiment and industry projections, suggest a favorable outlook. However, technical indicators like MACD signal potential corrections in the stock price. Considering this, cautious monitoring within specified support zones is prudent for long-term investors, while recognizing BlackRock's overall trajectory remains positive amidst market fluctuations.


