


US Copper fell below the 3.700 psychological line in February, the lowest level in nearly three months and indicative of a monthly decline of more than 5%. The decline in value was ascribed to a confluence of elements, encompassing a strong US dollar and a prevailing pessimistic industrial sentiment in China.
Chinese Data Pushed Copper Decline
China, as the foremost consumer of copper globally, persistently encountered macroeconomic obstacles that continued to obstruct the positive trajectory of base metals. Unexpectedly, deflation in the nation reached a 14-year high in January. Moreover, the official manufacturing Purchasing Managers' Index (PMI) indicated contraction for the fourth consecutive month.
A sustained decline in the Yangshan copper premium accompanied these developments, as industrial entities abstained from acquiring the metal. In the interim, year-to-date inventories in significant Chinese warehouses have increased by more than 120 percent, reaching nearly 70,000 tonnes.
Strong US Dollar Index (USDX) Is Positive For Copper Bears
The USDX appreciated on Thursday after unemployment data that emphasized the tenacity of the US labor market and confirmed the Federal Reserve's position on preserving interest rates.
According to the Labor Department, the number of newly filed claims for unemployment benefits in the US decreased by 9,000 to a seasonally adjusted 218,000 for the week ending February 3. The recorded amount fell short of the 220,000 predicted by economists, indicating a strong bullish factor for the US Dollar.
Thierry Wizman, a global FX and interest rates strategist at Macquarie in New York, observed that the data supports the notion that the United States labor market is strong, notwithstanding the marginal decline in initial claims. This has played a role in the dollar's recent strength.
US Copper Technical Analysis

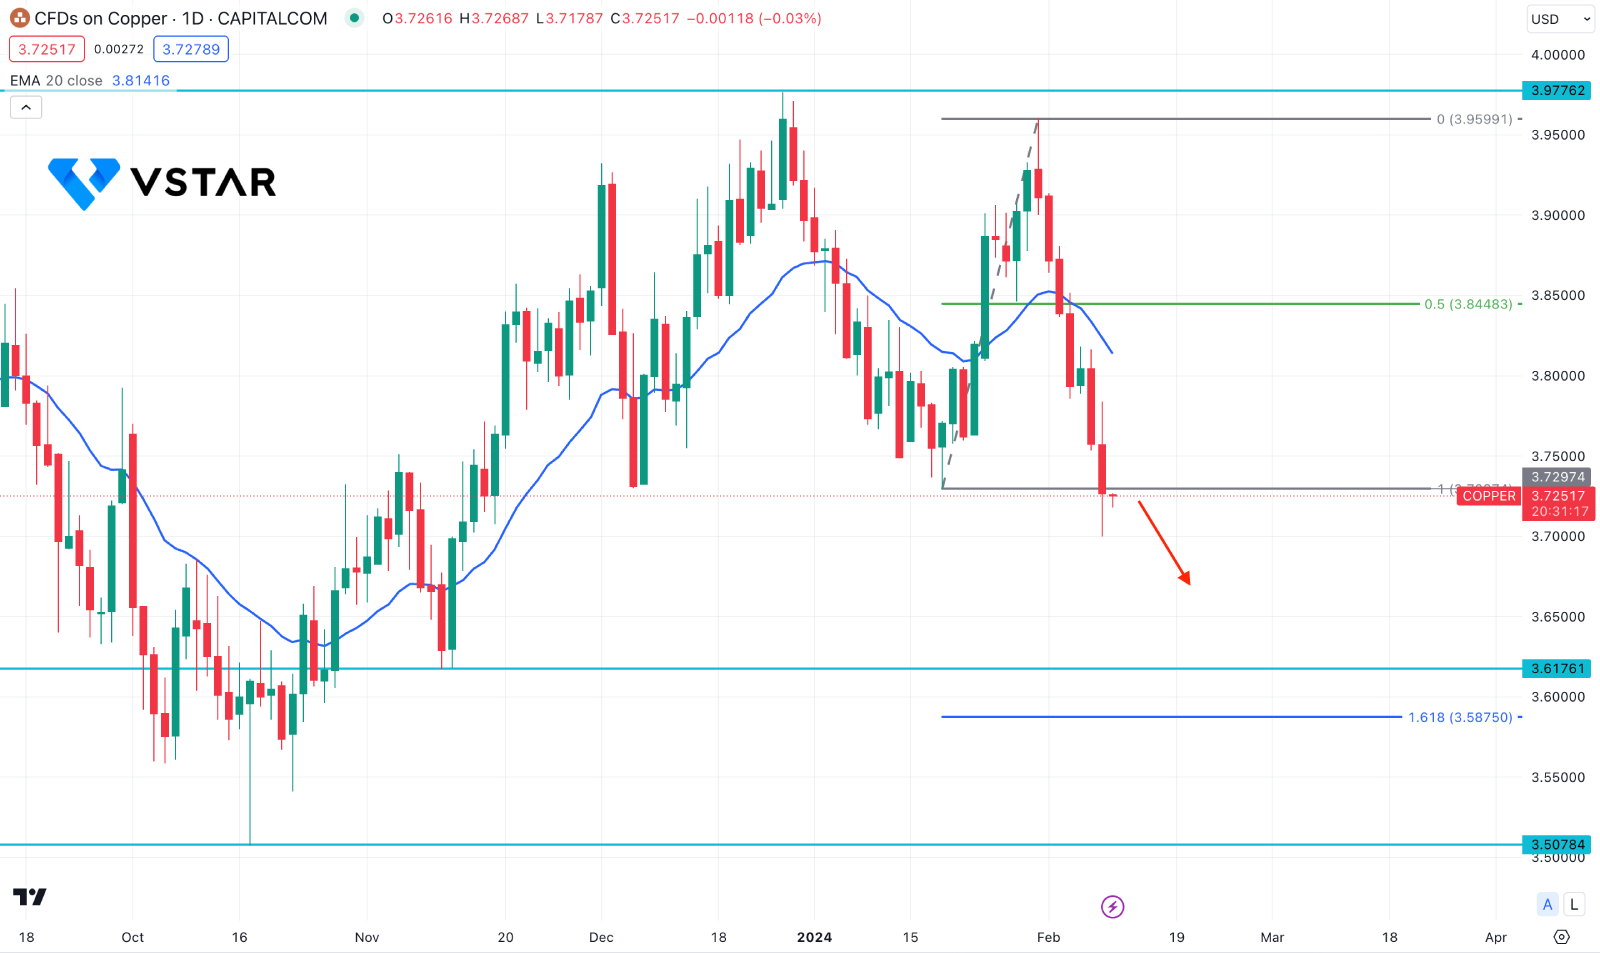
In the daily chart, Copper is trading below the dynamic 20-day EMA with an impulsive bearish pressure and found support at the 3.7297 level. Now, investors should closely monitor how the price trades at this line.
Based on the Fibonacci Extension level, the current 161.8% Fibonacci Extension level from 3.7297 low to 3.3599 is at 3.5878 level, which could be the extreme point of the current bear run.
As the Copper price moved below the 3.7297 support level, a bullish rebound with a daily candle could indicate a sell-side liquidity order grabbing. In that case, a long opportunity might open after having a daily close above the dynamic 20-day EMA.
On the bearish side, the ongoing selling pressure is valid, and investors might expect it to reach the 3.6176 support level.


