Over the years, people worldwide have developed an interest in digital assets, which has led to tremendous growth in the crypto industry. Crypto trading is one of the ways investors generate revenue from this industry: approximately $112 billion is traded in cryptocurrency daily. Are you probably wondering whether cryptocurrency trading is profitable? Yes, it’s a profitable venture if done correctly and strategically. There is a potential for high returns trading cryptocurrencies, especially in crypto CFDs trading.
For most beginner traders, crypto trading can seem complex. However, it doesn’t have to be while you can apply trading techniques and strategies that have already worked for millions of profitable traders over the years. To increase your chances of success in crypto trading, you need to know the trading principles, practice risk management and understand market analysis. This article is a comprehensive guide that outlines all you need to move from a beginner trader to a consistently profitable trader in the crypto market. Let’s get started.
Unsplash
Develop a Trading Strategy
As a beginner trader, you should never jump into the markets without knowing how you’ll identify trading opportunities and how you trade them. For this reason, you need a trading strategy. What is it anyway? It’s a systematic methodology (usually based on predefined rules or criteria) used for buying and selling crypto assets/instruments in the market.
Before developing your strategy, you must set clear and realistic goals and objectives for your trading. It will help you stay on track once you start executing your trading strategy.
To develop a sound trading strategy, you’ll need to answer the following questions:
A. What is your preferred trading time frame?
Different traders have different trading styles. You can be a scalper, day trader, swing trader or position trader. All this boils down to timeframes to your preferred time frame for trading and your availability to watch the market.
Here is what suits each of the above trading styles:
1. Best time frame for scalpers- 1 minute to 15 minutes time frame
2. Best time frame for day traders- from 15 minutes to 4 hours time frame
3. Best time frame for swing traders- from daily to weekly time frame
4. Best time frame for position traders- weekly to a monthly time frame
B. What is your risk appetite or tolerance?
Trading involves risk, and you’re likely to lose a trade at some point. Therefore, assessing your risk appetite or tolerance is key to developing your trading strategy. How much are you willing to lose while pursuing potential profits in a single trade?
To determine your risk tolerance level, you need to consider things such as your
● Goals
● Experience/trading skills
● Number of trades you take in a certain period
● Risk to reward ratio
Experts often recommend beginner traders risk only a small percentage of their capital, i.e. about 2% of the available account balance per trade. However, traders with a high-risk appetite go up to 5% per trade.
C. What crypto CFDs will you trade?
There are thousands of cryptocurrencies in the market, and trading them all is impossible. Having your watchlist filled with hundreds of instruments can be a distraction. Therefore, you need to identify crypto instruments that suit your trading style and often present you with the trading opportunities you’ll be looking for. The cost of the trade and volatility are also factors to consider.
D. What are your entry and exit rules?
One of the vital things when developing your trading strategy is to define your entry trigger and plan your exit trigger. When you’ve defined entry rules, it helps you enter the market without hesitation as soon as you identify a good trading opportunity.
It also applies to exiting your trades when you’re already in profit or loss.
E. What technical indicators do you need?
Indicators are significant tools in your technical analysis, thus making them a significant element of a trading strategy. They provide you with great insights into what is happening in the market. Above all, technical indicators are also helpful in identifying and timing good entries and exits in the market.
Some of the widely used indicators in the crypto trading space include:
Moving Averages (MAs) are significant in identifying trends, trend reversals and potential support and resistance levels. The most popular MAs are Simple Moving Averages (SMA) and Exponential Moving Averages (EMA)
Volume-based indicatorshelp you analyze the relationship between price movements and trading volume to determine the strength of a trend. Examples of such indicators include On-Balance Volume (OBM), Positive Volume Index (PVI), Money Flow Index,
Bollinger bands- it helps you identify periods of high or low volatility and potential price reversals in the market.
Relative strength index (RSI) helps you identify overbought or oversold conditions,ultimately showing a potential market reversal.
Fibonacci retracement lines help identify potential support and resistance levels where the price may reverse or consolidate.
Stochastic oscillator is a momentum indicator that helps identify potential trend reversals and overbought/oversold conditions in the market.
Unsplash
F. Backtest and improve your trading strategy
Once you’ve developed a trading strategy, you need to know how well it works in the market, and that’s why you need backtesting. It entails replaying market price action and recording your trades manually. With advanced technology, you can use a wide range of tools to backtest various instruments in the market.
As you backtest, you may identify some areas that need adjustments to make your trading strategy more profitable.
Learn Technical Analysis and Charts
Technical analysis is quite essential in crypto trading: it helps you identify patterns and determine probabilities of future movements in the market. Generally, a great understanding of technical analysis can help you identify high-potential trading opportunities on the charts using any timeframe.
What exactly should you learn and understand about technical analysis? Here are five key aspects to focus on:
A. Know different candlestick chart patterns
Candlesticks chart patterns are quite crucial in technical analysis. Wondering what it is? Let’s start by describing a candlestick for a clear and better understanding. It’s a bar displaying information about an asset’s price movement. Over time, candlesticks form patterns in a given timeframe. Often, it’s by default that light candles (green or white) represent buyers (bullish trend), and dark candles (red or black) represent sellers (bearish trend) in the market. You must understand that each candle gives a story. For this reason, knowing how to read candlesticks is extremely important.
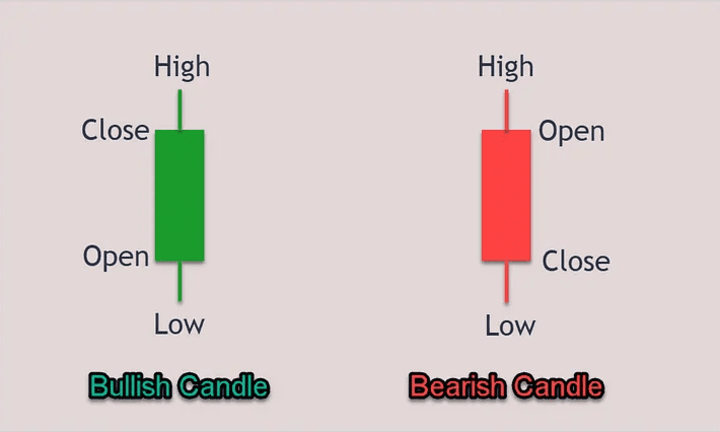
Source: InsiderFinance Wire
Now, you can define a candlestick pattern as a technical analysis tool that shows graphic representations of price movements in the market as presented on a candlestick chart. There are three types of candlestick patterns:
● Bearish Candlestick Patterns
This pattern forms after an uptrend where the closing price is lower than the opening price. They show a point of resistance and a high potential of price falling, thus signaling an entry point for sellers in the market.
Examples of common bearish candlestick patterns include:
Hanging man- it has a similar shape to a hammer followed and forms at the end of an uptrend. It shows that bulls (buyers) are losing control, and sellers are getting in the market.
Shooting star – you can identify it by a shape of an inverted hammer represented by a long upper wick and small lower body. It shows the potential of an uptrend reversing.
Dark cloud cover – it’s represented by two candlesticks, i.e. a red candlestick that opens above the previous green candlestick and closes below its midpoint. It indicates a bearish reversal pattern at the end of an uptrend.
Three black crows – This pattern comprises multiple (often three) consecutive long red candles with short wicks. It signals the start of a downtrend.
Evening star– it’s a three-candle pattern represented by a short candle sandwiched between long green and red candlesticks. It shows a potential reversal of an uptrend to a downtrend.
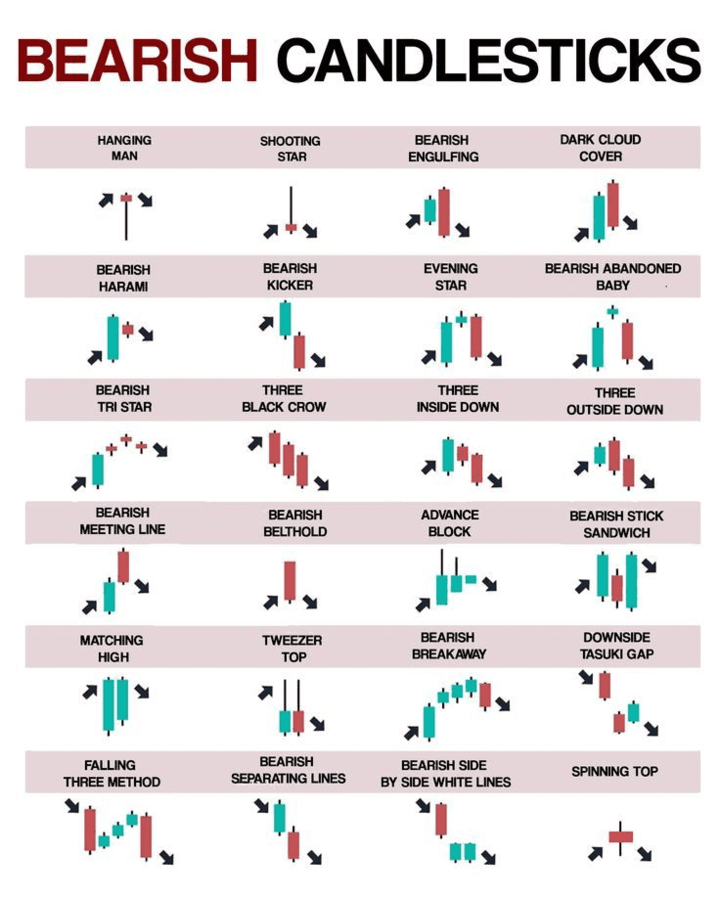
Bearish candlestick pattern chart (Source: Trading SeeNa)
● Bullish Candlestick Patterns
. This kind of candlestick pattern forms after a downtrend whereby the closing price is higher than the opening price. They signal a price reversal to the upside; thus, buyers should consider opening long positions.
Examples of common bullish candlestick patterns include:
Hammer – it’s represented by a short body candle with a long lower wick, usually at the bottom of a downtrend. It signals a strong uptrend is about to start.
Inverse hammer – it’s represented by an inverted hammer (long upper wick and short body). It suggests that buyers are about to take control of the market.
Bullish engulfing – it’s a two candles pattern represented by one short red body that is completely engulfed by a large green candle.
Three white soldiers- it’s the straight opposite of the above-outlined three black crows.
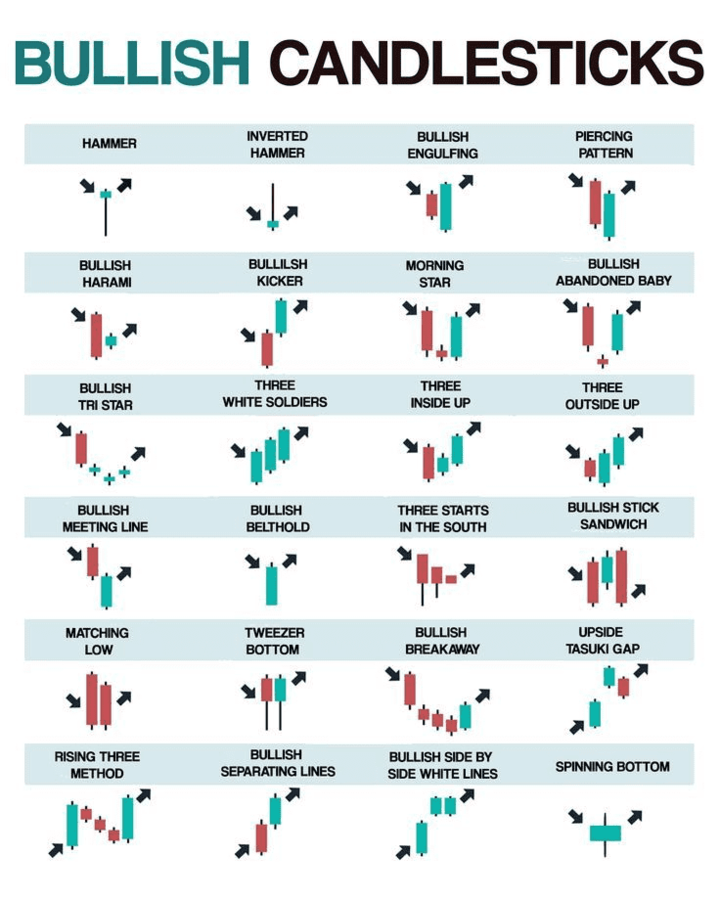
Bullish candlestick pattern chart (Source: Trading SeeNa)
● Continuation Candlestick Patterns
This kind of candlestick pattern shows no change in market direction/trend. This pattern often forms when the market price is neutral or indecisive. This particular type of candlestick pattern helps you filter out the noise on the charts and focus on the prevailing market direction.
Examples of common continuation candlestick patterns include:
Doji – it’s represented by a candlestick resembling a plus or cross sign. It shows a struggle between buyers and sellers; thus, the price ends up closing at the same point it opened.
Falling three methods/ rising three methods – this pattern consists of one large body candle followed by three smaller body candles in the opposite direction and another large candle.
Separating lines – this pattern is formed by two opposite candlesticks whereby the first candle is a long candle counter to the prevailing trend, and the second candle matches the trend and opens with a gap or at the same level as the previous closing price.
Freepik
B. Understand technical indicators
Technical indicators are another set of tools in technical analysis, and a trader need to understand how they work. They’re mathematical calculations based on trading instruments’ past and current price or volume activity. There are four types of indicators, i.e. trend, momentum, support/resistance and volatility indicators.
What is the point of using technical indicators in crypto trading?
As outlined earlier, technical indicators help a trader see past trends and anticipate future moves in the market. But there are more benefits to using technical indicators. They include:
● Helps in identifying high probability trade entry and exit points.
● Helps a trader make more informed decisions (to some extent, it even helps filter out emotions in your trade decisions).
● Enables you to improve your overall trading strategy.
How to use technical indicators properly
There are hundreds of technical indicators, but you don’t need all of them: you need to use indicators purposefully. Usually, indicator overload can do more harm than good by creating confusion on your chart.
Choosing the ideal indicator involves understanding how specific indicators function under different market conditions.
In brief, you should answer the following questions when choosing an indicator:
A. What do you want to use the indicator for?
B. Do you understand how that particular indicator works?
C. What settings should you use?
D. When does the indicator fail?
Examples of common indicators
Here are examples of common indicators based on 4 different types of indicators:
1. Trend indicators
These indicators work best in a trending market. They’re used to identify the direction of a trend and tell whether a trend still exists. They include Moving Averages (MA), Average Direction Index (ADX) and Ichimoku Kinko Hyo.
2. Momentum indicators
They’re essential in identifying the strength of a trend and identifying trend reversals. They include Stochastic Oscillator, MACD and RSI indicator.
3. Volatility indicators
Volume indicators show how much an asset changes over a given period. They include Bollinger Bands, Standard Deviation and ATR indicator.
4. Support and resistance indicators
They help identify the price barrier of an asset at certain levels towards a given direction. They include Fibonacci, Wolfe Waves, Camarilla Pivots and Murrey Math Lines.
C. Identify trends and trend reversals.
Trends are a core aspect of technical analysis. A trend is the overall direction (upward, sideways or downward) of the market for a certain period. You may have heard professional and profitable traders state, “Move with the trend and not against the trend”. Well, it’s not by mistake: they understand that riding with the trend until data suggests trend reversal is one way to be profitable.
How do you identify a trend?
There are different ways of identifying a trend. They include:
Connecting a series of highs or lows-For instance, consecutive high tops and high bottoms suggest an uptrend, while low tops and low bottoms suggest a downtrend
Drawing a trendline-ensure you have at least two connecting points and a third touch point to be a valid trendline.
Using technical indicators (as outlined above)
What are the benefits of identifying a trend?
● It helps estimate the future price trajectory of a cryptocurrency
● It gives you an idea of where trend reversal is likely to happen
● It enables you to trade with the direction of the trend, which maximizes your chances of winning a trade.
● It helps you plot support and resistance levels with better precision.
What is a trend reversal, and how do you identify one?
A trend reversal is when the price of a cryptocurrency changes direction. Generally, it marks the end of an existing trend and the beginning of a new trend.
It’s important to differentiate between a reversal and a retracement. Reversals are long-time price movements and are more likely to occur anytime. Conversely, retracements are short-term and tend to occur after massive directional price movements (small changes like pullbacks).
Unsplash
There are different ways to identify trend reversals. They include:
Using trendlines – often, touch points of the trendlines act as support and resistance levels. If the price breaks out of a trendline and starts moving in the opposite direction, that suggests a trend reversal. However, combining trendlines with other technical tools is important to confirm reversals and avoid fake breakouts.
Using technical indicators – technical indicators such as MAs, MACD, Parabolic, Stochastic, and Ichomoka indicators can help you spot trend reversals
Using price patterns – you use certain patterns to identify a trend reversal. However, you need to be patient for a pattern to form completely. Examples of typical reversal patterns include:
1. Double tops/ Double bottoms
2. Triple tops/ Triple bottoms
3. Head and shoulders/ Inverse head and shoulders
4. Wedge
5. V-reversal pattern
6. Engulfing candlestick pattern
7. Pin bar candlestick pattern
D. Utilize Support and Resistance levels.
Are you wondering why support and resistance levels matter so much in technical analysis? These are the price points you’re more likely to see a lot of buying and selling pressure on a certain timeframe.
What is a support level? It’s defined as the price point below the current market price and shows buying interest/pressure. It’s usually the previous swing lows.
What is a resistance level? It’s the price point above the current market price and suggests selling interest/pressure. It’s usually the previous swing highs.
Why are support and resistance levels important in technical analysis?
You can use these levels to plan your entry and exit points in the market. For instance, traders buy at the support level and take profits at the resistance level or sell at the resistance level and take profits at the support level.
They’re also vital points when determining market psychology and supply and demand.
How do you find support and resistance levels?
Below are common ways to find support and resistance levels in the market:
Use trendlines-you can draw a trendline from a low point connecting other high lows to find support levels in an uptrend. For a downtrend, you can draw a trendline from a high point connecting other lower highs to find resistance levels.
Use technical indicators – Fibonacci and Pivot Points indicators can help you identify support and resistance levels in the market.
Identify highs and lows on your charts – higher highs and lower highs act as resistance levels, while lower lows and higher lows act as support levels.
Pexels
Master Risk and Money Management
You should acknowledge that trading involves risk; therefore, losses should be valued as much as profits/gains. Generally, it means that losses are intrinsic in trading, and you should embrace them to be a successful trader.
However, you need to ensure you can control how much you risk or lose. It’s only possible through proper money and risk management. It’s considered the cornerstone of success in trading. Surprisingly, this is one of the most crucial skills in trading yet the most overlooked.
Why is money and risk management so important in trading?
It helps you protect your capital from significant losses: you can hardly blow your account. It also enables you to maximize profits while minimizing losses. Lastly, with proper risk management, a trader’s psychology tends to be in a better state to mitigate their fears and greed in the market.
Effective risk and money management techniques
A. Only risk what you can afford to lose.
Risking what you can afford to lose ensures you don’t interfere with your financial stability. Also, you're more likely to stay focused on your long-term trading goals.
B. Follow the golden rule of risk management.
Usually, the rule of thumb in trading is to risk 1-2% of your account equity on a single trade. With this golden rule, you’re more likely to remain afloat even after losing trades consecutively. Above all, ensure you maintain a positive risk-to-reward ratio.
Suppose your risk appetite is higher; you may risk more. However, be prepared to accept the outcome of significant losses like you’d accept the high returns.
C. Set stop loss and take profit targets.
Setting a stop loss at predetermined optimal levels helps limit losses before they escalate if a trade moves against you. Similarly, a take profit allows you to automatically close your trade in profit at a predetermined price if the trade played out according to your analysis. Generally, setting these targets helps eliminate overconfidence while trading.
D. Limit leverage and margin trading.
While margin increases your purchasing power, allowing you to open a larger position (ultimately magnifying your profits) in the market, it also amplifies your losses when your analysis is wrong. To minimize the intensity of your losses, consider limiting the leverage you use.
E. Diversification
It’s a good idea you diversify your portfolio across multiple cryptocurrencies. Therefore, when one cryptocurrency is a loss, another can profit, thus compensating for the loss. Consider choosing cryptocurrencies with a low correlation for better results and reduced risk.
Develop Discipline as a Crypto Trader
Discipline is also a fundamental part of trading. You could have incredible technical analysis skills, proper risk management rules and big capital, but if you lack discipline, you still not be profitable in the long run. To be a successful trader, you need to master your discipline.
How can you develop discipline as a trader? Here are a few tips to help you master and maintain discipline as a trader:
A. Develop a trading plan and stick to it
Having a trading plan builds the foundation of your being a disciplined trader. With a trading plan, you have guidelines/rules outlining the specific trading opportunities you’ll be looking for, how you’ll execute your trades, a defined risk and how you’ll exit your trades. Therefore, you’re less likely to engage in impulsive trading.
B. Journal your trades and learn from your mistakes.
By journaling your trades, you can easily identify patterns in your trading behavior. Consequently, you can easily reflect on your trading mistakes and make adjustments.
C. Control emotions by automating processes
Automating your trading strategies is one way to remove emotions in crypto trading. It’s also called algorithmic trading. With today’s advanced technology, you can easily find programs/software to help you in this process: no coding skills are needed. The program can identify a trading opportunity that meets your criteria, it executes the trade without hesitation.
D. “Don’t marry your trades.”
If your trade analysis is wrong and the market is already moving against you, and you don’t have a stop loss in pace, don’t hold on to the trade for too long in the hope it will reverse in your favor. Similarly, if your trade is already in great profits and your risk-to-reward ratio is met, don’t hold on to the same trade for long, hoping it will keep trending in the same direction.
E. Avoid revenge trading
The reality is that no one is immune to losses in trading. Therefore, avoid revenge trading because it might lead you to making irrational decisions hoping to recover your losses. In most cases, you may end up losing more.

Pexels
Identify Trading Opportunities
If you have a trading plan and have mastered technical analysis, identifying trading opportunities in the crypto CFD market shouldn’t be a hassle. It means you already know the cryptocurrencies you’ll be trading and are probably on your watchlist.
Since traders look for different things on the charts to enter a trade, there is no particular way to identify trading opportunities. What work for someone else may not work for you. However, there are various ways most traders use to spot trading opportunities in the market based on different trading strategies and styles. They include:
A. Look for a breakout of key levels
You can find great trading opportunities when breakouts happen in the market. To spot the trading opportunity, you can use the following:
Trendlines- drawing trendlines on the charts can help you see possible breakouts. Price could break out of the trendlines and continue with the trend. Alternatively, the price could break out of the trendline and then reverse.
Channels-drawing channels can help you spot breakout opportunities in either direction of the trend.
Triangles- market price tends to form a triangle pattern as it consolidates before a breakout occurs. It can be an ascending triangle, descending triangle or symmetrical triangle.
Chart patterns-chart patterns like double top/bottom and head and shoulders indicate reversal breakouts.
B. Spot chart patterns that indicate trends
In addition to the above-outlined chart patterns, traders use other patterns to spot trading opportunities in the market. Examples include of
● Engulfing pattern
● Rectangle chart pattern
● Doji star pattern
● Hammer and inverted hammer patterns
● Rising and falling wedges pattern
C. Monitor news and social sentiments
Keeping up with the latest crypto industry news and social media posts related to the crypto space can help you identify trading opportunities. While there is a specific way to gauge sentiments, you can use certain things on top of social media to measure market mood. They include community analytics, funding rates and sentiment index. With crypto market sentiment, you can forecast a cryptocurrency’s future momentum.
Major crypto-related news from trusted platforms tends to impact cryptocurrencies' prices negatively or positively. As a result, you can easily identify short-term trading opportunities.
Execute Trades Efficiently
Your ability to execute trades according to your trading plan is quite essential in the market. Your execution determines the kind of results you get. Based on the analysis, how well can you enter and exit trades at the optimal timing price? How fast and accurately can you execute trades? Can you execute trades without fear or greed? Proper trade execution revolve around these questions.
Why does proper trade execution matter in your trading?
Proper execution in trading can make the difference between being profitable or losing consistently. In addition, it helps you enter the market at the best possible price, where you can maximize your profits. Above all, it enables you to execute trades with control and calmness without being affected by emotions and opinions.
Here are tips that can help you execute trade more efficiently in crypto trading:
A. Prepare and practice
Before getting into the market, you need to practice your execution skills before opening live trades. It can be done on a free demo account. Alternatively, you can use backtesting or replay tools for the same. Practice helps you with building your confidence and consistency in trade execution.
Another key aspect is the preparation of your trading environment and yourself. Your mind, location, trading tools and internet speed must be well set before entering the market. Remember, preparation is half the battle!
B. Choose suitable trading platforms and tools
Consider trading platforms and tools that suit your trading style, goals and strategy. This is where factors such as subscription fees, features, functionality, ease of use, security and reliability matter.
C. Use market and limit orders
Market orders are among the vital tools you need to execute your trades efficiently. Use market orders when you want to execute a trade fast at the current price. Limit orders are the best for executing a trade at a specified price: just set the order, and it will be triggered once the level is reached.
D. Automate part of your strategy
There is a wide range of customizable computer programs (trading systems) that you can utilize to enhance your trade execution process, including executing trades at the best possible prices. More importantly, there is minimal error, especially those that could be triggered by human emotional and psychological factors. You only need to set the predetermined parameters based on your trading strategy, and the program handles the rest.
Continuous Learning and Improvement


Commitment to continuous learning and willingness to improve is a must-have trait if you look forward to being a successful trader over time. When getting into this industry, you must come to terms with the reality that crypto trading isn’t a one-time event. The crypto market is constantly evolving, new trends are emerging, and your strategy may stop giving you the same results as market conditions change. For this reason, you must keep learning and adapt appropriately: become a student of the market.
Tips for continuous learning and improvements
A. Read crypto trading books and blogs
You can easily improve your trading knowledge and stay motivated by reading crypto books and blogs. As a result, it enhances your decision-making in the market. Additionally, you can learn techniques to help improve parts of your trading strategy. Read the blogs on various crypto topics such as crypto news, technical analysis, trading strategies and trading psychology on VSTAR’s blog.
B. Look into case studies of experienced traders
Looking at case studies of other experienced and successful traders can help you get different perspectives and lessons that would be significant in your trading and life in general.
C. Backtest strategies using historical data
Backtesting is the best way to assess the effectiveness of a strategy and identify areas that need improvement. It also helps generate new ideas so you can optimize your trading strategies.
D. Keep up with the latest crypto news and tech advancements
As a trader, you must keep up with the best market developments and trends. The best way to do it is by following crypto news and technology advancements updates.
E. Join and participate in online trading communities
Connecting with other traders on chat rooms, social media groups, forums, and seminars can benefit you. You get to share experiences, insights and learn from others. You can also ask questions and discuss trading ideas or strategies.

Unsplash
Summary
Crypto trading has proved to be profitable for most individuals, but it comes at a price. It requires you to invest time to master this art. Is it possible for most beginners to reach the same level? It’s possible.
To start with, you need to create a well-outlined trading plan and strategy that suits you. These two will guide you on how you approach the market. You also need to master skills such as technical analysis and identifying trading opportunities in the market. These are critical elements in critical crypto trading.
You must also be a disciplined trader. Without discipline, you can hardly succeed in crypto trading because you won’t follow your trading plan and will likely break your trading rules. Considering the crypto market is sometimes volatile, you should have a substantial risk and money management strategy. It helps you minimize losses.
Finally, you should continuously learn from various sources, such as trading books, blogs, and seasoned traders, to add to your trading knowledge. More importantly, keep improving your trading skills and strategies to remain profitable.