


- Delta stock shows mixed short-term and long-term performance against the S&P 500 and industry benchmarks, reflecting broader industry challenges.
- The company maintains industry-leading operational performance, showcasing record completion factors and on-time arrivals, leading to higher capacity growth and cost favorability.
- Despite challenges, Delta achieves record revenue, profitability, and free cash flow, prioritizing debt reduction and aiming for an investment-grade rating.
- Delta's revenue streams diversify across corporate, domestic, international, and premium markets, bolstered by loyalty programs and strategic growth initiatives.
- DAL stock appears undervalued relative to its peers based on metrics like P/E ratio and PEG ratio with a technical price target of $58.5.
Delta Air Lines (NYSE: DAL) emerges as a compelling stock amidst the turbulence of the airline industry. This analysis delves into the multifaceted fundamental and technical assessment of Delta, spotlighting key opportunities amidst its varied price performances, operational triumphs, and strategic maneuvers. Read more to discern the winds of change shaping Delta's stock valuation and the price projections.
Delta Stock Price Performance
Delta Air Lines has demonstrated varied price performance across different time frames. In the short term (1 month), Delta also outperformed the S&P 500, gaining 9.59% against the index's -1.00%.
Over longer periods, Delta's performance becomes more nuanced. In the 6-month and year-to-date (YTD) periods, Delta's performance surpasses the S&P 500, indicating relative strength within its industry. However, when observing the performance over the past three and five years, Delta has underperformed both the S&P 500 (SPX) and its industry benchmark, the U.S. Global Jets ETF (NYSEARCA:JETS). This could reflect broader challenges faced by the airline industry, such as fuel costs, regulatory changes, or competitive pressures.
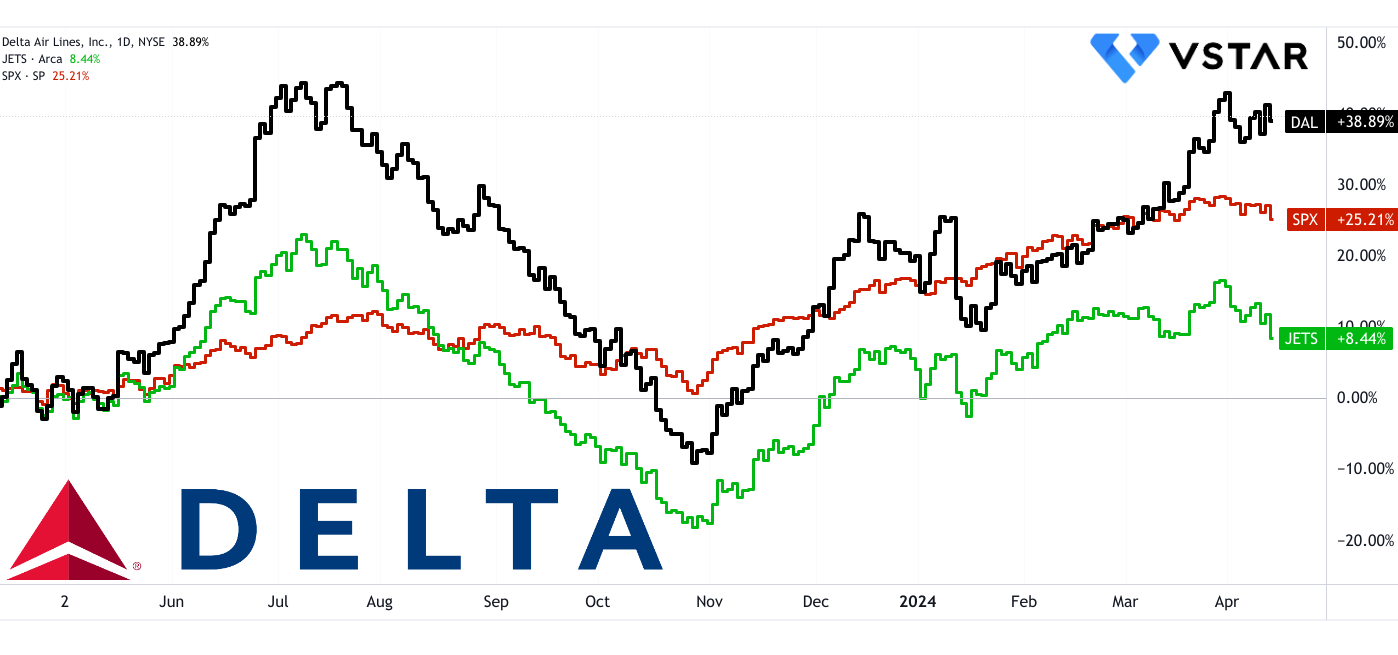
Source: tradingview.com
Delta's 10-year performance stands out with a significant price return of 44.10%, indicating long-term growth potential. However, this needs to be considered alongside its total return, which accounts for dividends and other distributions. Delta's total return over 10 years is 62.25%, suggesting that dividends have played a significant role in its overall returns. However, the stock has drastically underperformed against the S&P 500 over the decade.
Comparing Delta's performance with the U.S. Global Jets ETF, Delta generally outperforms in short-term and mid-term periods, the ETF has had better long-term performance. This indicates that investing in the broader airline industry through an ETF may provide more stable returns over extended periods, while Delta may offer more potential for short to mid-term gains.
Delta Airlines Fundamental Strengths
Operational Excellence and Reliability:
Delta Air Lines (NYSE:DAL) has consistently demonstrated industry-leading operational performance, as reflected in its record completion factor and on-time arrivals. Specifically, in the March quarter, Delta achieved a completion factor that set a new benchmark for reliability. This operational reliability translates into tangible benefits, such as higher capacity growth and unit cost favorability, ultimately contributing to improved financial performance.
The reduction in mainline cancellations by 85% from the previous year highlights Delta's commitment to operational excellence. This reduction not only enhances customer satisfaction but also minimizes disruptions and costs associated with flight cancellations.
Operational metrics play a crucial role in driving financial outcomes. Delta's operational excellence resulted in an incremental point of capacity growth and unit cost favorability, leading to a significant improvement in pre-tax income by $163 million over the previous year. Furthermore, the operational efficiency reflected in the completion factor contributed to a higher operating margin, which increased by 0.5 points year-over-year.
Financial Performance:
Delta's financial performance in the March quarter highlights its resilience and adaptability in navigating challenging market conditions. The company achieved record revenue of $12.6 billion, representing a 6% year-over-year increase. This revenue growth was driven by industry-leading operational performance and strength in close-in bookings, indicating Delta's ability to capitalize on market opportunities.
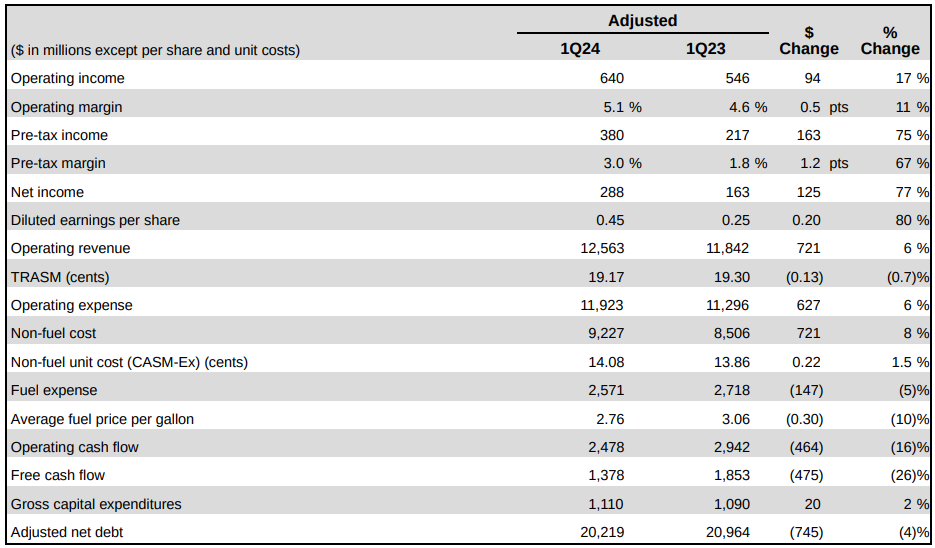
Source: Q1 2024 Earnings
Profitability metrics also demonstrate Delta's financial strength. The company reported a pre-tax income of $380 million and earnings per share of $0.45, showcasing an improvement over the previous year. Despite facing headwinds such as higher-than-expected fuel prices, Delta's operational efficiency and strong demand mitigated these challenges, contributing to positive financial outcomes.
Free cash flow generation is another key aspect of Delta's financial performance. Despite significant investments in profit-sharing payouts to employees and business reinvestment, Delta generated $1.4 billion in free cash flow in the March quarter. This robust cash flow generation reflects Delta's ability to efficiently manage its capital and invest in growth initiatives while rewarding its employees for their contributions.
Debt reduction remains a top priority for Delta, as evidenced by its efforts to strengthen its balance sheet. The company reduced its adjusted net debt by $1.2 billion from the end of 2023, signaling a commitment to improving financial flexibility and reducing leverage. Positive outlook updates from rating agencies such as Moody's and Fitch further validate Delta's progress towards an investment-grade rating, enhancing investor confidence in the company's financial stability.
Revenue Diversification and Growth Strategies:
Delta's revenue diversification and growth strategies are key drivers of its success in the airline industry. The company's ability to generate revenue from multiple sources, including corporate travel, domestic and international markets, and premium services, enhances its resilience and competitiveness.
Corporate travel demand has been a significant contributor to Delta's revenue growth, with managed corporate sales growing by 14% year-over-year. This growth is particularly notable in sectors such as Technology, Consumer Services, and Financial Services, indicating Delta's strong relationships with corporate clients and its ability to meet their travel needs effectively.
Domestic and international markets represent significant revenue opportunities for Delta. The company achieved record domestic unit revenues, with a 3% year-over-year growth rate in the March quarter. Additionally, international passenger revenue increased by 12% compared to the previous year, driven by strong demand in key markets such as the Transatlantic region.
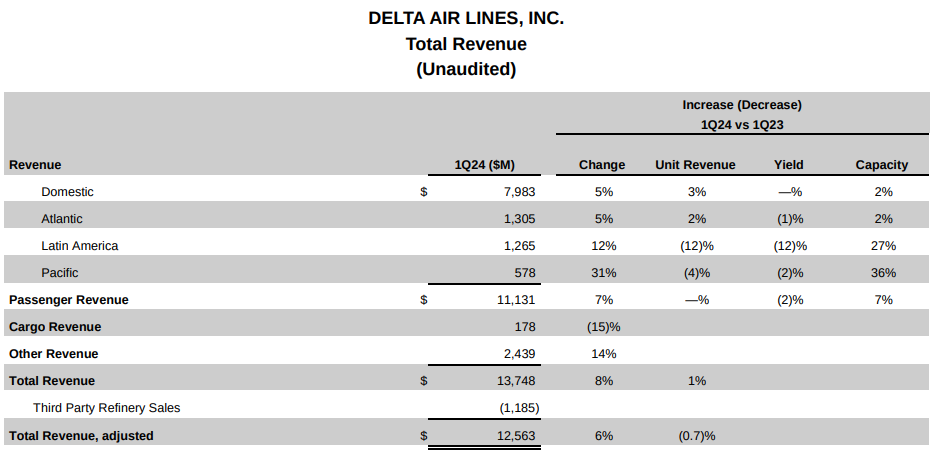
Source: Q1 2024 Earnings
Delta's revenue streams are diversified across various segments, including Loyalty, Premium, Cargo, and Maintenance, Repair, and Overhaul (MRO) services. These segments comprised 57% of total revenues in the March quarter, highlighting Delta's focus on generating revenue from high-margin sources. Premium revenue, in particular, grew by 10% year-over-year, outperforming Main Cabin revenue and underscoring Delta's success in capturing demand for premium services.
Loyalty programs, such as the American Express co-brand portfolio, play a significant role in driving revenue growth for Delta. The company achieved record quarterly remuneration of $1.7 billion from American Express, reflecting the success of its co-brand partnership and the attractiveness of its loyalty offerings to customers.
Cost Management and Efficiency:
Delta's focus on cost management and efficiency is instrumental in maintaining profitability and financial sustainability. Despite facing challenges such as higher fuel prices, the company has demonstrated effective cost control measures and operational efficiencies, resulting in positive financial outcomes.
In the March quarter, Delta managed its operating expenses effectively, with adjusted non-fuel costs amounting to $9.2 billion. Non-fuel cost per available seat mile (CASM) increased by 1.5% year-over-year, which was within expectations and indicative of disciplined cost management practices.
Fuel efficiency improvements have also contributed to cost savings for Delta. The company achieved a 1.9% year-over-year improvement in fuel efficiency, driven by fleet renewal efforts and sustainability initiatives. This improvement helped offset the impact of higher fuel prices, with adjusted fuel expense declining by 5% year-over-year.
Delta's guidance on cost management provides further insight into its financial strategy. The company expects non-fuel unit costs to increase approximately 2% for the June quarter, consistent with the full-year outlook for a low single-digit increase in non-fuel unit costs over 2023. This disciplined approach to cost management ensures that Delta remains competitive while maintaining financial flexibility and profitability.
Delta Air Lines Fundamental Weakness
Cost Performance and Efficiency Optimization:
Delta Air Lines reported a 1.5% increase in non-fuel unit costs year-over-year for the March quarter of 2024. Despite achieving operational excellence, this rise indicates challenges in managing costs effectively. To address this, Delta should analyze specific cost drivers and implement targeted cost-saving measures. For instance, investing in technology to improve productivity and renegotiating supplier contracts could help lower expenses. Additionally, workforce training and process improvements may enhance efficiency, ultimately reducing non-fuel unit costs.
Debt Repayment and Leverage:
Delta Air Lines had total debt and finance lease obligations of $19.4 billion at the end of the March quarter in 2024. While the company aims to repay at least $4 billion of debt in 2024, further reductions are necessary to improve its leverage ratio. Despite achieving a leverage ratio of 2.9 times, accelerated debt repayment is crucial for enhancing financial flexibility and reducing interest expenses. Delta could allocate a significant portion of its cash flows towards debt reduction and explore opportunities for debt refinancing to lower interest costs.

Source: Q1 2024 Earnings
Fuel Price Volatility and Efficiency:
Delta Air Lines faces fuel price volatility, with fuel prices expected to range from $2.70 to $2.90 per gallon in the June quarter of 2024. Despite a 1.9% year-over-year improvement in fuel efficiency, rising fuel prices pose challenges to profitability. To mitigate this, Delta should focus on further enhancing fuel efficiency and implementing fuel hedging strategies. Investing in fuel-efficient aircraft and optimizing flight operations can help minimize fuel consumption, while diversifying fuel procurement sources and negotiating favorable contracts can mitigate price risk.
Delta Air Lines Outlook
Consensus EPS Estimates:
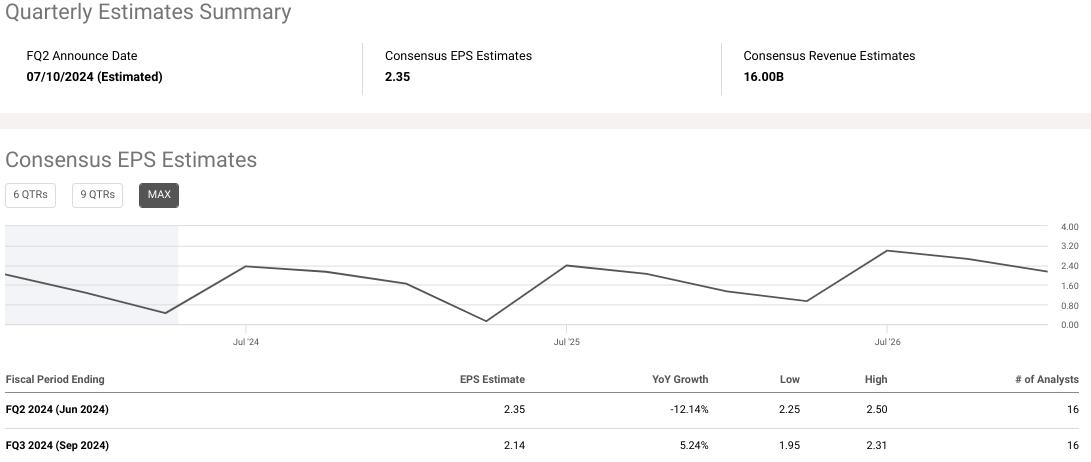
Delta Air Lines' consensus EPS estimates provide valuable insights into analysts' expectations regarding the company's earnings per share for the fiscal periods ending in June 2024 (FQ2 2024) and September 2024 (FQ3 2024). In FQ2 2024, analysts anticipate an EPS of $2.35, reflecting a year-over-year (YoY) decline of 12.14%. This estimate falls within a range of $2.25 to $2.50, as suggested by 16 analysts. The EPS estimate for FQ3 2024 is $2.14, with a YoY growth of 5.24%, ranging between $1.95 and $2.31, based on assessments from 16 analysts.
The consensus estimates indicate a decline in EPS for FQ2 2024 compared to the previous year, which may raise concerns among investors and stakeholders. The YoY growth rates of -12.14% for FQ2 2024 and 5.24% for FQ3 2024 suggest a mixed outlook, with FQ2 experiencing a decline while FQ3 anticipates growth. However, it's crucial to consider the context behind these estimates, including industry trends, macroeconomic factors, and specific challenges or opportunities facing Delta Air Lines.
Source: seekingalpha.com
Consensus Revenue Estimates:
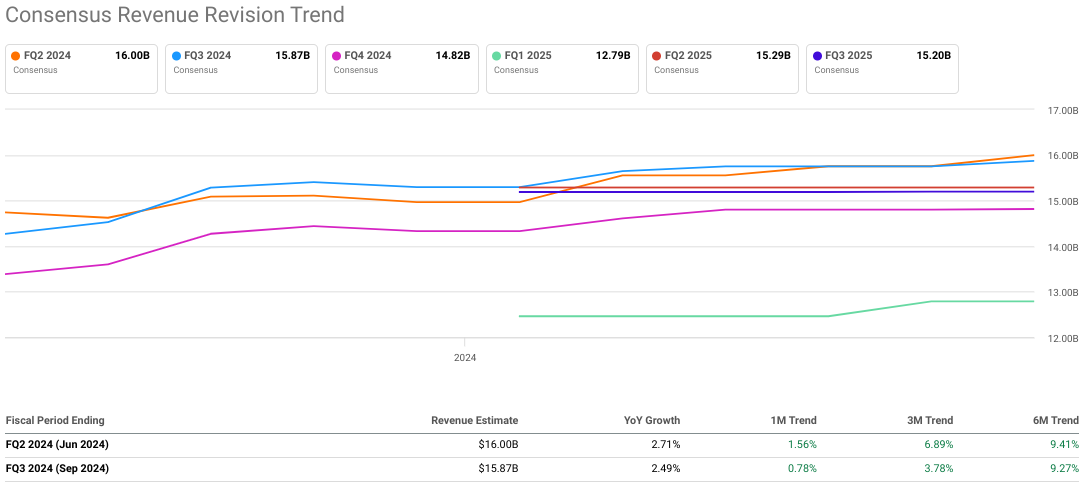
In FQ2 2024, analysts estimate revenues of $16.00 billion, indicating a YoY growth of 2.71%. The revenue estimate ranges from $15.46 billion to $16.47 billion, as provided by six analysts. Similarly, for FQ3 2024, the revenue estimate is $15.87 billion, with a YoY growth of 2.49%, within a range of $15.41 billion to $16.38 billion, based on assessments from six analysts.
The consensus estimates reveal modest revenue growth expectations for both FQ2 and FQ3 2024, with YoY growth rates of 2.71% and 2.49%, respectively. Despite the anticipated decline in EPS for FQ2, the revenue estimates suggest that Delta Air Lines may still experience top-line growth during this period. However, the narrower range of revenue estimates compared to EPS estimates indicates a higher level of consensus among analysts regarding revenue projections.
Consensus EPS and Revenue Revision Trends:
The revision trends track the changes in EPS and revenue estimates over time, providing insights into analysts' evolving perceptions of Delta's financial performance. For FQ2 2024, although the EPS estimate remained constant at $2.35, the YoY growth saw fluctuations in the 1-month, 3-month, and 6-month trends, indicating some volatility in analysts' outlook. Similarly, the revenue estimate for FQ2 2024 remained at $16.00 billion, with varying trends in YoY growth over different periods, suggesting fluctuations in analysts' expectations.
For FQ3 2024, the EPS estimate of $2.14 showed minor fluctuations in the 1-month, 3-month, and 6-month trends, indicating a relatively stable outlook. Likewise, the revenue estimate of $15.87 billion exhibited consistent trends in YoY growth over the specified periods, reflecting a steady outlook among analysts.
This highlights the dynamic nature of analysts' perceptions and expectations, with revisions occurring over different time frames. Fluctuations in revision trends may stem from various factors, such as changes in market conditions, industry dynamics, company-specific developments, or revisions to underlying assumptions used in financial forecasting models.
Source: seekingalpha.com
WSJ Estimates:
The Wall Street Journal (WSJ) estimate trends provide additional perspectives on analysts' expectations for Delta's EPS in Q2 and Q3 2024. In Q2 2024, the current EPS estimate of $2.35 slightly increased from $2.31 one month ago and $2.32 three months ago. Conversely, in Q3 2024, the EPS estimate remained constant at $2.12 over the past month and three months, suggesting a stable outlook among analysts for this period.
The WSJ estimate trends corroborates with the consensus EPS estimates, indicating a relatively stable outlook for FQ3 2024 and a slight upward revision for FQ2 2024. Consistency in EPS estimates over consecutive months may indicate a higher level of confidence among analysts regarding their projections for FQ3 2024. However, it's essential to consider other factors influencing analysts' estimates, including industry trends, company guidance, and macroeconomic conditions.

Source: WSJ.com
Internal Estimates from Delta Air Lines:
In Q2 2024, Delta anticipates the highest quarterly revenue in its history, with a mid-teens operating margin and earnings per share (EPS) of $2.20 to $2.50. This outlook reflects the company's expectations for continued strong demand, particularly in corporate travel and premium services, which are expected to drive revenue growth. The company's full-year guidance reaffirms its commitment to delivering earnings of $6 to $7 per share and free cash flow of $3 to $4 billion. These targets demonstrate Delta's confidence in its ability to capitalize on market opportunities, optimize its operations, and generate sustainable growth over the long term.

Source: Investor Presentation
Furthermore, Delta's investment in fleet renewal, including the introduction of fuel-efficient aircraft such as the A321neo and A220-300, enhances its competitive advantage and supports its long-term growth strategy. These modern aircraft not only improve fuel efficiency but also enhance the customer experience, contributing to higher customer satisfaction and loyalty.
Moreover, Delta anticipates a 5 to 7% growth in total revenue compared to June 2023, with TRASM expected to be flat to down 2%. Notably, the company expects all geographic entities to achieve unit revenue approximately flat to last year, except Latin, where a double-digit decline is anticipated due to strong performance in the previous year and ongoing investments in the network.
Regarding cost performance, the company has an operational edge in delivering a pre-tax income of $380 million in the March quarter, representing a significant improvement over the previous year. Despite higher non-fuel unit costs, Delta achieved favorable results due to operational efficiency and capacity growth. Looking ahead to the June quarter, Delta expects non-fuel unit costs to increase by approximately 2%, in line with the full-year outlook for a low single-digit increase over 2023.
To sum up, Delta Air Lines' internal estimates underscores the company's optimistic outlook for revenue growth in the June quarter, driven by strong demand for travel. Despite challenges such as declining unit revenue in certain regions and increasing non-fuel unit costs, Delta remains focused on optimizing its operations and delivering efficiency gains.
Delta Airlines Stock Dividend Summary
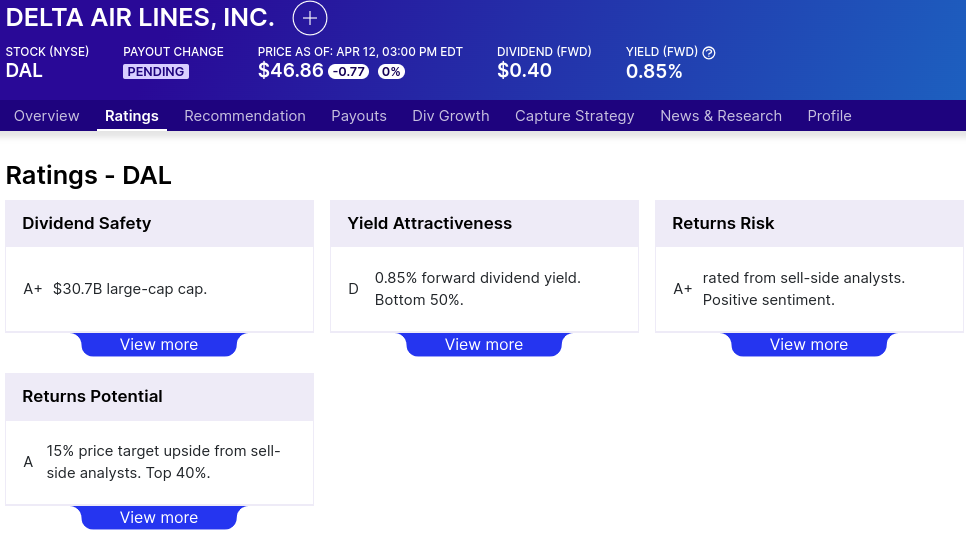
Delta Air Lines' forward dividend yield is 0.85%, with an annual payout of $0.40 per share. However, the 5-year growth rate for dividends stands at -33.21%, indicating a decline rather than growth in dividend payments over the past five years. Additionally, Delta has not shown any growth in dividends over this period. This may raise concerns among income-oriented investors who prioritize a consistent and growing dividend stream.
Source: dividend.com
DAL Stock Valuation
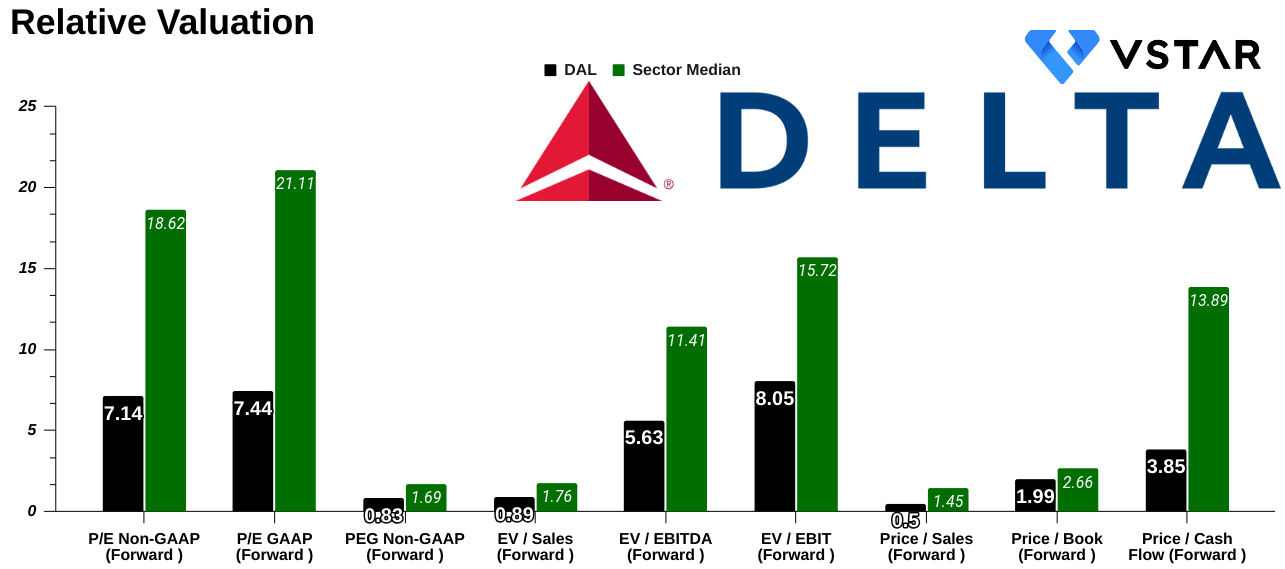
The Price/Earnings (P/E) ratio is a fundamental metric used to assess the valuation of a company's stock. For Delta Air Lines (DAL), the forward P/E ratio stands at 7.14. This figure represents the ratio of the company's current stock price to its estimated earnings per share (EPS) for the next twelve months. Comparing this to the sector median P/E ratio of 18.62, we see a significant deviation of -61.65%. In essence, investors are willing to pay less for each dollar of Delta Air Lines' earnings compared to the average company in the sector. This suggests that the market may perceive Delta Air Lines as undervalued relative to its peers.
Furthermore, by examining Delta Air Lines' 5-year average forward P/E ratio, which is 9.41, we note that the current ratio of 7.14 is lower by -24.10%. This implies that the stock is trading at a cheaper valuation compared to its own historical performance. Investors might interpret this as an opportunity to invest in Delta Air Lines at a lower price relative to its long-term average valuation.
On the other hand, the PEG (Price/Earnings to Growth) ratio provides a more nuanced view of a company's valuation by factoring in its growth prospects. For DAL, the forward PEG ratio is calculated at 0.83. This indicates that investors are paying $0.83 for each unit of Delta Air Lines' expected earnings growth. Comparing this to the sector median PEG ratio of 1.69, we observe a deviation of -50.76%. In simpler terms, Delta Air Lines appears undervalued relative to its growth potential when compared to the average company in the sector.
Similarly, the Enterprise Value to Sales (EV/Sales) ratio measures the valuation of a company relative to its revenue. For DAL, the forward EV/Sales ratio is 0.89. This implies that investors are paying $0.89 for each dollar of Delta Air Lines' projected sales in the next twelve months. Comparing this to the sector median EV/Sales ratio of 1.76, we observe a deviation of -49.68%. In essence, Delta Air Lines is trading at a discount relative to the average company in the sector based on its sales performance.
Moreover, when considering Delta Air Lines' 5-year average forward EV/Sales ratio, which is 1.3, the current ratio of 0.89 represents a lower valuation by -31.87%. This suggests that the stock is trading at a more attractive valuation relative to its historical sales performance. Investors may view this as a positive indicator of Delta Air Lines' potential for future growth and profitability.
Source: Analyst's compilation
Delta Air Lines' EV/EBITDA ratio of 5.63 indicates that investors are paying $5.63 for each dollar of the company's projected EBITDA in the next twelve months. Compared to the sector median of 11.41, this represents a deviation of -50.70%, suggesting a cheaper valuation for Delta Air Lines relative to its earnings.
Additionally, the EV/EBIT ratio for Delta Air Lines is 8.05, indicating that investors are paying $8.05 for each dollar of the company's projected EBIT in the next twelve months. Compared to the sector median of 15.72, this represents a deviation of -48.82%, implying a discounted valuation for Delta Air Lines relative to its earnings.
Finally, Delta Air Lines' Price/Sales ratio is 0.5, indicating that investors are paying $0.5 for each dollar of the company's projected sales in the next twelve months. Compared to the sector median of 1.45, this represents a deviation of -65.28%, indicating a significantly cheaper valuation for Delta Air Lines based on its sales performance.
Analyst Price Forecasts and Ratings
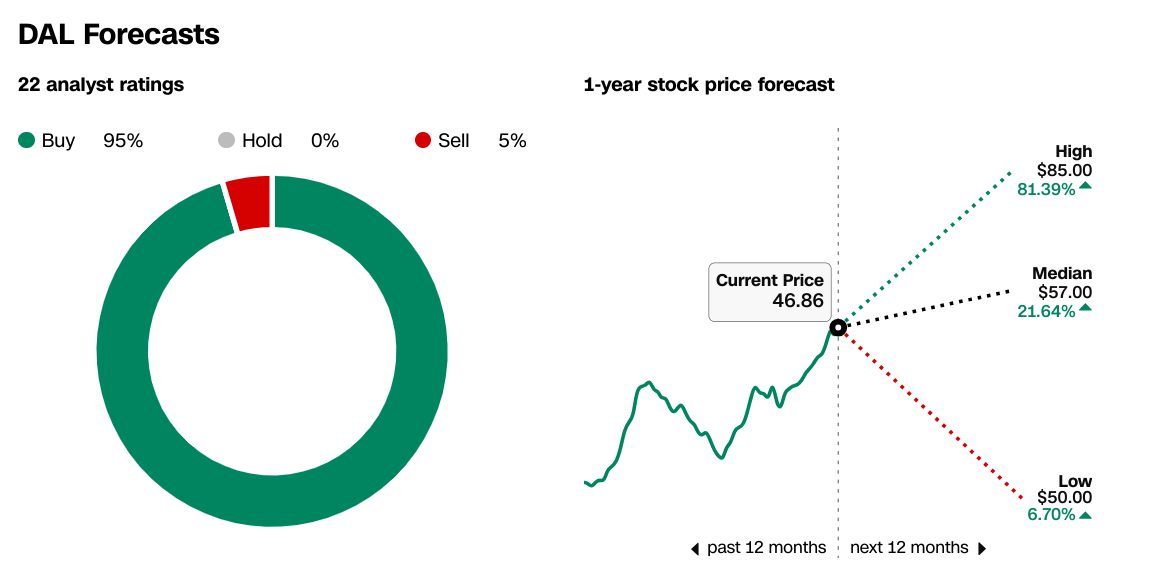
According to CNN, out of 22 analyst ratings, 95% suggest buying Delta Air Lines stock, while 5% recommend selling. This strong buy sentiment reflects positive outlooks from analysts regarding the future performance of Delta Air Lines. Analysts' recommendations can influence investor sentiment and affect stock prices.
1-Year Stock Price Forecast (CNN):
- High: $85.00 (81.39% increase)
- Median: $57.00 (21.64% increase)
- Low: $50.00 (6.70% increase)
- Current Price: $46.86
Source: CNN.com
Analyst ratings from the Wall Street Journal (WSJ) indicate a shift towards more positive sentiments over the past three months, with an increasing number of analysts recommending buying or overweighting Delta Air Lines stock. Currently, there are no hold or sell recommendations from analysts surveyed by WSJ.
1-Year Stock Price Targets (WSJ):
- High: $85.00
- Median: $57.00
- Low: $50.00
- Average: $58.41
- Current Price: $46.86

Source: WSJ.com
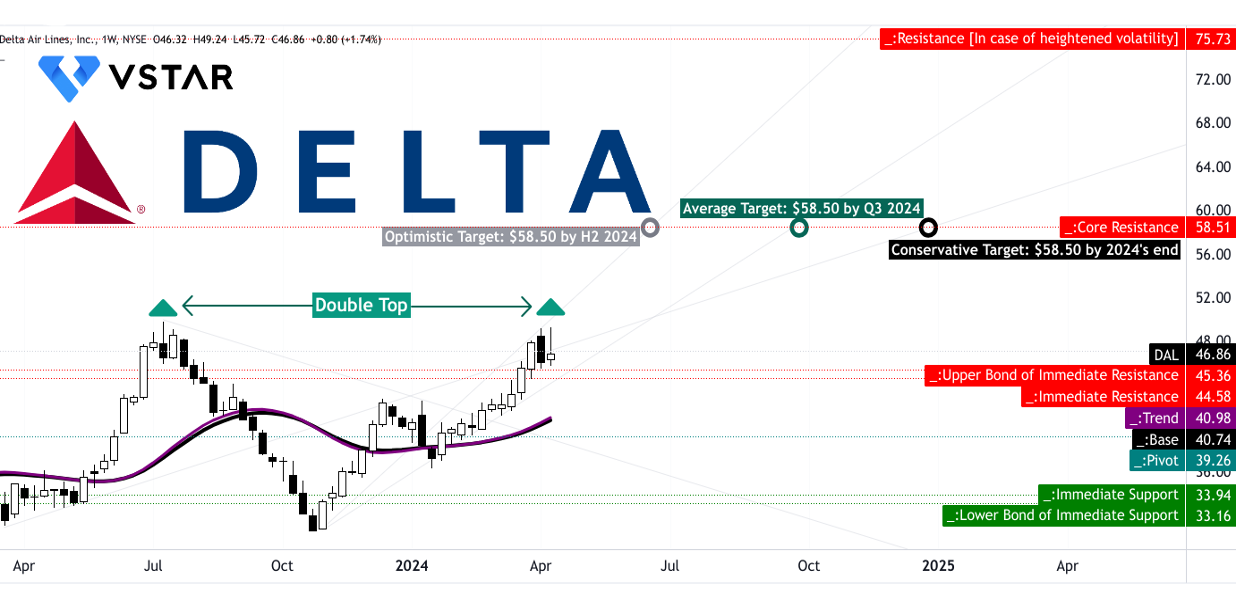
DAL Stock Forecast Technical Take
Delta Airlines stock price may hit $58.5 by the end of 2024. The price target is based on the mid-term momentum of the change in polarity projected over Fibonacci retracement and extension levels. This is a conservative projection. Interestingly, the average and optimistic scenarios indicate an early hit to the price target. The average scenario projects the attainment of the price target by Q3 2024, whereas the optimistic scenario reflects that the price target may be attained by the end of H1 2024. So it is a matter of time, technically.

Source: tradingview.com
DAL stock price is currently forming a double-top candlestick pattern, and with a relative strength index (RSI) above 70, there are possibilities of a price correction. On the downside, $45.35–$44.60 (the upper bound of the current horizontal price channel) and $39.25 (the pivot of the channel) serve as critical support levels. However, hitting the pivot has fewer possibilities.
In short, considering the constant improvement in the diluted EPS (on a trailing twelve-month basis), the stock price has a higher possibility of hitting new highs. With that, the stock may hit the target within the above-mentioned time frames.

Source: tradingview.com
In conclusion, Delta Air Lines presents a complex narrative, with its stock exhibiting both short-term volatility and long-term potential. The mixed price performance against benchmarks underscores industry headwinds, yet Delta's robust financials and analyst sentiment hint at underlying strength. While short-term fluctuations may occur, Delta's trajectory, bolstered by operational excellence and growth strategies, suggests a favorable long-term outlook. Delta's undervalued position relative to peers, coupled with optimistic analyst forecasts, indicating potential for upward price movement in the coming quarters.


