Introduction to Gold Price Charts
When it comes to trading gold, understanding price charts is crucial for making informed decisions and maximizing profits. Gold price charts provide a wealth of information, showing live gold prices as well as historical data. By utilizing these charts, you can track gold prices in real-time and analyze long-term price trends.
There are several types of gold price charts available, each offering its own unique benefits. Line charts provide a simple visual representation of price movements over time. Candlestick charts offer more detailed information, displaying the opening, closing, high, and low prices for a given period. Bar charts provide similar data but in a different visual format, while point & figure charts focus on price reversals and trends.
To successfully navigate gold trading, it's essential to have a deep understanding of price charts and how to interpret them. In the following sections, we will explore insider gold trading strategies that will empower you to use price charts like a pro and maximize your profits.
Key Components of a Gold Price Chart
To effectively utilize gold price charts for trading, it's essential to understand their key components. Understanding the key components of a gold price chart empowers you to identify patterns, spot potential opportunities, and manage risks effectively.
A gold price chart typically consists of a vertical (y) axis representing the gold price and a horizontal (x) axis representing time. By examining the price movements plotted on the chart, you can gain valuable insights into market trends and make informed trading decisions.

Image Source: Unsplash
Moreover, the chart displays important data points for each time period, including the high, low, and closing prices. These values provide a comprehensive view of how gold prices fluctuate within a specific timeframe. For short-term trading, intraday charts are available, showing price movements in minutes or hours. Daily charts provide a broader perspective by displaying prices for each day, enabling traders to identify patterns and trends over a longer period.
In addition to intraday and daily charts, there are also weekly, monthly, and yearly charts available. These charts offer a more extended timeframe for analysis, allowing you to assess gold price trends and make strategic trading decisions accordingly.
Looking at recent data, gold prices in 2022 experienced volatility due to various factors such as inflation concerns and geopolitical tensions. However, in 2023, gold prices have shown signs of stabilization and gradual growth.
By closely monitoring the most recent gold price charts, you can stay informed about the latest market trends and adapt your trading strategies accordingly. In the next section, we will delve into insider strategies that will help you harness the power of price charts to maximize your profits in gold trading.
Understanding Gold Price Trends

Image Source: Unsplash
Understanding gold price trends refers to the ability to analyze and interpret the historical and current movements in the price of gold in order to identify patterns, predict future movements, and make informed investment decisions
To effectively utilize gold price charts for trading, it's essential to understand the different types of price trends and how they impact your trading decisions. By recognizing and analyzing these trends, you can position yourself strategically to maximize your profits.
Uptrend: An uptrend is characterized by a series of higher highs and higher lows in the gold price over time. This indicates a bullish market where buyers are in control, and the price of gold is rising. Identifying an uptrend allows you to take advantage of buying opportunities and ride the upward momentum.
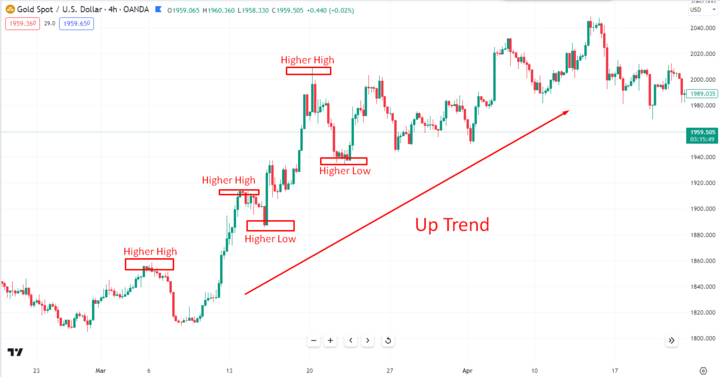
Image Source: TradingView
Downtrend: A downtrend is the opposite of an uptrend, with lower highs and lower lows in the gold price. It indicates a bearish market where sellers dominate, and the price of gold is declining. Recognizing a downtrend enables you to consider selling or shorting opportunities, capitalizing on downward price movements.
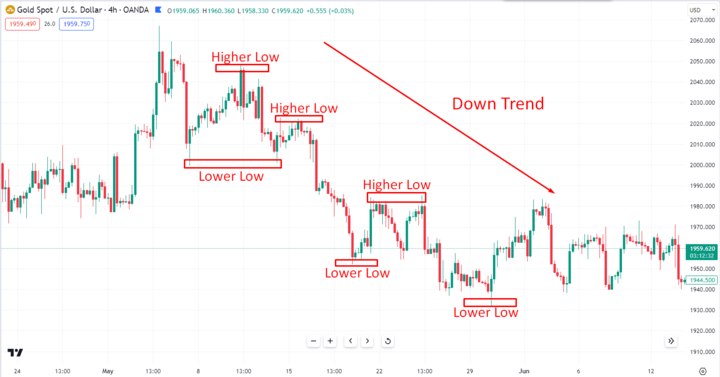
Image Source: TradingView
Trading Ranges: Trading ranges occur when the price of gold moves horizontally within a specific range, bounded by support and resistance levels. In this scenario, the market is indecisive, and neither buyers nor sellers have a significant advantage. Understanding trading ranges helps you identify potential buying and selling opportunities at support and resistance levels.
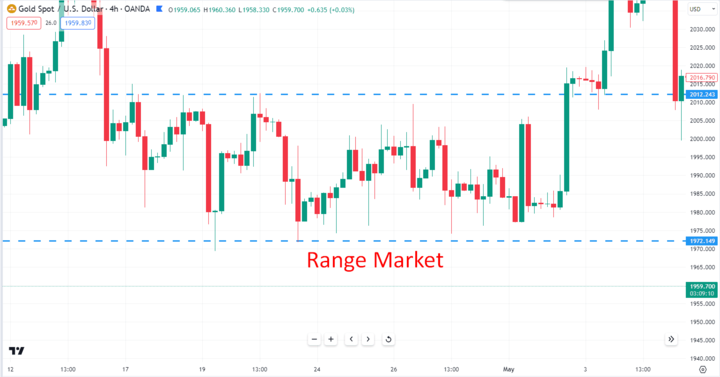
Image Source: TradingView
In terms of recent trends, gold prices experienced volatility in 2022 due to economic uncertainties, inflation concerns, and fluctuating investor sentiment. However, in 2023, gold prices have shown signs of stabilization and gradual growth, driven by factors such as safe-haven demand and central bank policies. By keeping a close eye on the latest gold price charts, you can adapt your trading strategies based on the prevailing trends.
Now that you understand the importance of recognizing gold price trends, let's explore major gold chart patterns that can help you make profitable decisions in the market.
Major Gold Chart Patterns
In addition to understanding price trends, recognizing chart patterns is crucial for successful gold trading. Chart patterns are visual representations of price movements that help identify potential trading opportunities. Major gold chart patterns refer to recurring formations or configurations observed in the price charts of gold, such as head and shoulders, triangles, and flags, which can provide valuable insights for technical analysis and trading decisions.
Here are some major gold chart patterns that can assist you in maximizing your profits:
Head and Shoulders: This pattern is a reversal pattern that signals a potential trend change. It consists of three peaks, with the middle bottom (the head) being lower than the two surrounding bottoms (the shoulders). A break above the neckline of the pattern indicates a bullish trend reversal and an opportunity to buy.
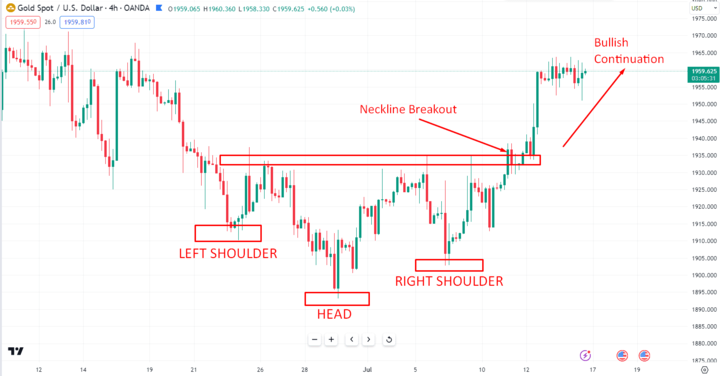
Image Source: TradingView
Flags and Pennants: Flags and pennants are temporary consolidations that occur within ongoing trends. Flags are rectangular patterns, while pennants are triangular. These patterns indicate a brief pause in the price movement before the trend resumes. Traders can enter positions in the direction of the prevailing trend after the pattern's breakout.
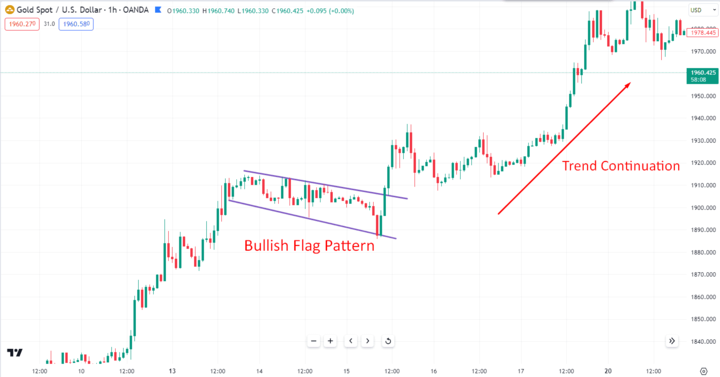
Image Source: TradingView
Wedges: Wedges are characterized by a narrowing price range, forming either an ascending or descending wedge. These patterns suggest an imminent breakout as the price approaches the apex of the wedge. Traders can position themselves for potential profit by entering trades in the direction of the breakout.
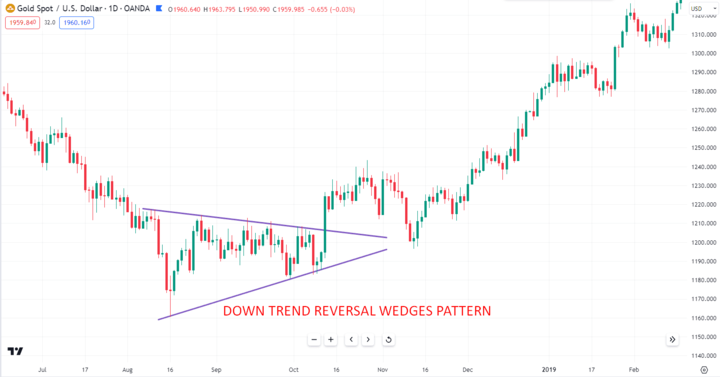
Image Source: TradingView
Triangles: Triangles are contracting price patterns that can be ascending, descending, or symmetrical. They represent a period of consolidation before a breakout or breakdown. Traders can take advantage of the triangle pattern by entering trades after a confirmed breakout.
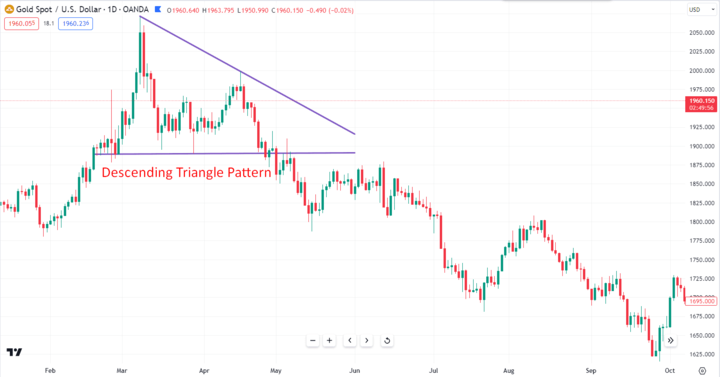
Image Source: TradingView
Support and Resistance Levels
Support and resistance levels are key concepts in gold trading that can greatly assist you in making profitable trading decisions. Understanding these levels and their significance can help you identify potential entry and exit points in the market.
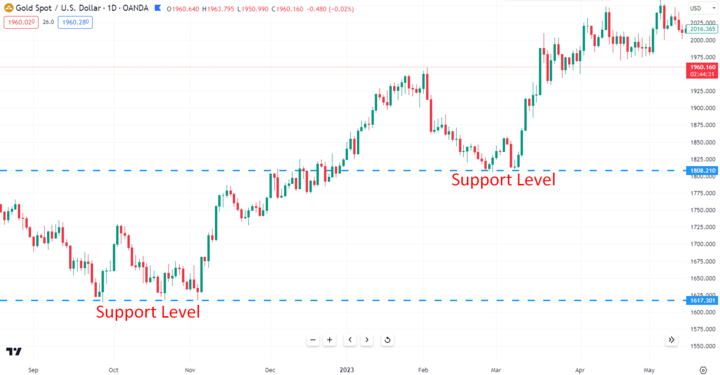
Image Source: TradingView
Support is a price level at which buying interest is strong enough to halt a decline in the gold price. It acts as a price floor, preventing further downward movement. When the price approaches a support level, it may bounce back, presenting an opportunity for traders to enter long positions.
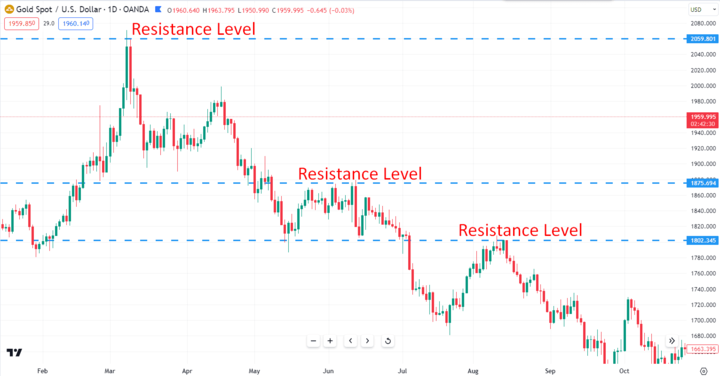
Image Source: TradingView
Resistance, on the other hand, is a price level at which selling interest is significant enough to prevent the price from advancing further. It acts as a price ceiling, limiting upward movement. When the price nears a resistance level, it may encounter selling pressure and reverse its direction. Traders can consider shorting or exiting long positions near resistance levels.
Support and resistance levels can serve as valuable reference points on price charts. They can be identified by observing areas where the price has historically struggled to move beyond (resistance) or where it has found buying support (support). These levels can reverse or pause trends, and their significance increases when multiple technical indicators align with them.
Moreover, support and resistance levels are dynamic and can change over time. In 2022, gold prices experienced fluctuations, testing various support and resistance levels amidst economic uncertainties and market volatility. In 2023, gold prices have shown signs of stabilization and gradual growth, with new support and resistance levels emerging.
Using Volume Analysis
Volume analysis is one valuable tool in analyzing price charts is volume analysis, which provides insights into the amount of trading activity during different time periods. It is a powerful tool that can enhance your gold trading strategies. By analyzing the volume bars on price charts, you can gain valuable insights into the strength and validity of price movements. Here's how to leverage volume analysis effectively:
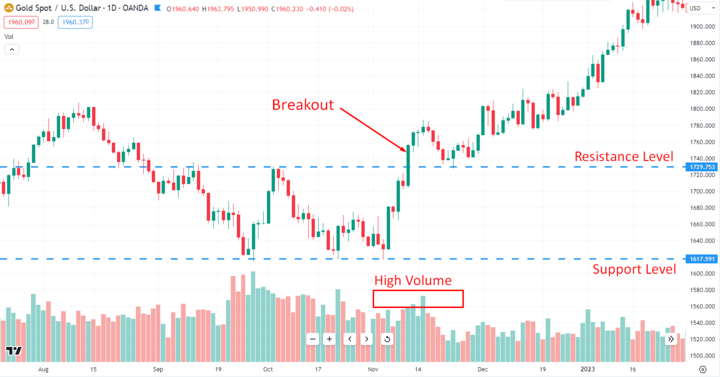
Image Source: TradingView
Volume bars displayed on price charts represent the level of trading activity accompanying each price movement. By paying attention to volume, traders can gain valuable information about the strength and reliability of price breakouts or breakdowns. When a breakout occurs with high volume, it confirms the authenticity of the breakout, indicating strong market participation and increasing the probability of a sustained price movement in that direction.
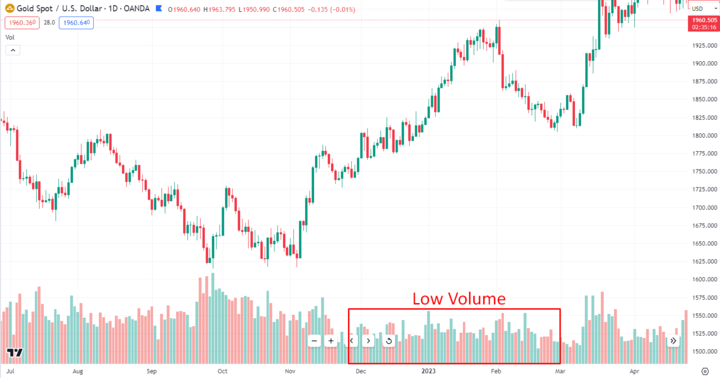
Image Source: TradingView
Conversely, low volume during a price move suggests a lack of commitment from market participants. It indicates that the price move may lack conviction and could potentially reverse or be short-lived. Traders should be cautious when interpreting price moves with low volume and consider waiting for confirmation through increased volume before taking significant trading actions.
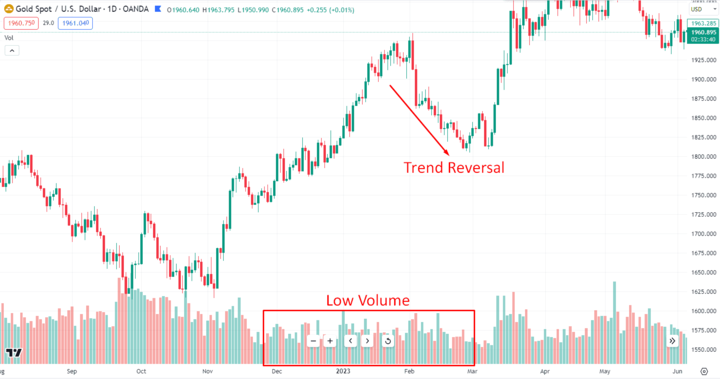
Image Source: TradingView
To effectively utilize volume analysis, you can look for patterns or divergences between price movements and corresponding volume levels. For example, if the price is making higher highs, but the volume is declining, it could indicate weakening momentum and a potential trend reversal.
Technical Indicators for Gold Trading
Technical indicators for gold trading are tools used to analyze price charts and provide insights into market trends, momentum, and volatility. They include MACD, RSI, Bollinger Bands, and more.
To optimize your gold trading strategies, it's crucial to leverage technical indicators that provide valuable insights into market trends, momentum, and volatility. Here are a few key indicators to consider when analyzing gold price charts:
MACD and RSI: The Moving Average Convergence Divergence (MACD) and Relative Strength Index (RSI) are momentum oscillators that help identify overbought and oversold conditions. They can indicate potential reversals or continuation of trends, allowing you to make timely trading decisions.
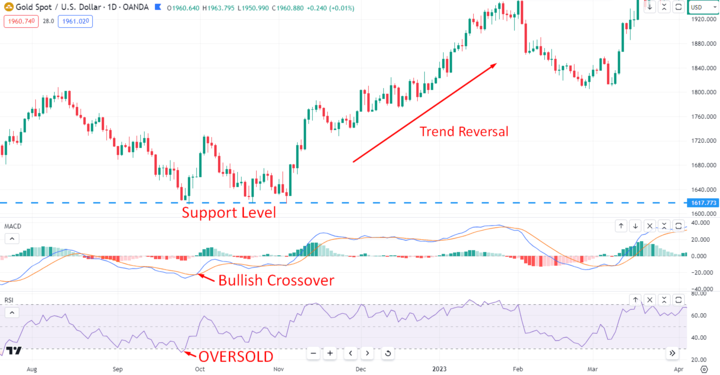
Image Source: TradingView
Bollinger Bands: Bollinger Bands consist of volatility bands plotted around a moving average. They provide insights into price volatility and potential pricing anomalies. When the bands contract, it suggests lower volatility, while expansion indicates increased volatility.
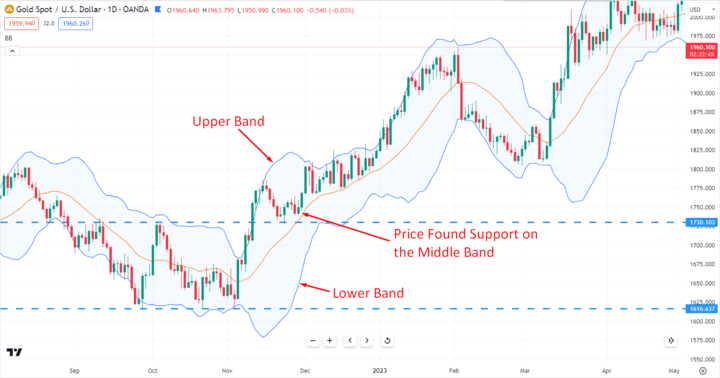
Image Source: TradingView
By incorporating these technical indicators into your analysis, you gain a more comprehensive understanding of the gold market and increase your chances of maximizing profits. However, it's essential to use these indicators in conjunction with other analysis techniques, such as price patterns and fundamental factors, to make well-informed trading decisions.
Remember, successful trading requires a disciplined approach, risk management, and continuous learning. Regularly monitor and adapt your strategies to changing market conditions to stay ahead in the dynamic world of gold trading.
Timing Gold Trades Using Charts


Mastering the art of timing is essential for maximizing profits in gold trading. Price charts provide valuable insights into market trends, support, and resistance levels, allowing you to time your trades effectively. Here are some key strategies to consider:
Enter Long Trades: In uptrends, look for opportunities to enter long trades near support levels or on upside breakouts. Support levels act as a floor that can provide buying opportunities when the price bounces off them. Upside breakouts above resistance levels indicate a potential trend continuation, presenting favorable entry points.
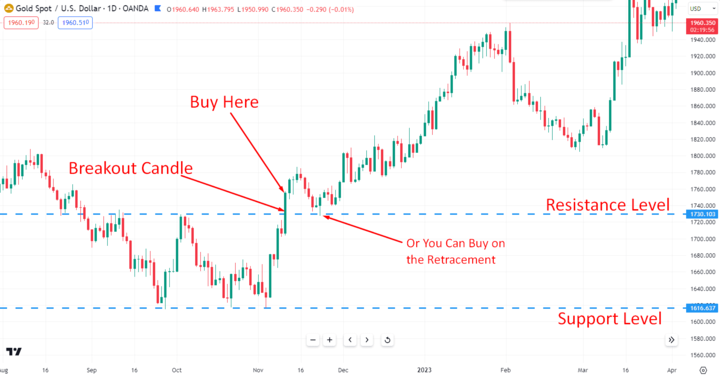
Image Source: TradingView
Go Short: In downtrends, consider going short near resistance levels or on downside breakdowns. Resistance levels act as a ceiling that can offer selling opportunities when the price pulls back from them. Downside breakdowns below support levels suggest a potential trend continuation to the downside, presenting favorable short-selling opportunities.
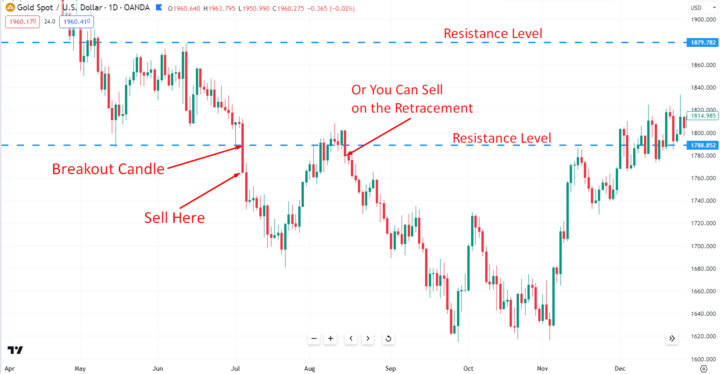
Image Source: TradingView
Set Stop Losses: To manage risk, set stop-loss orders beyond key support or resistance levels. This helps protect your capital if the price moves against your trade. Placing stops beyond these levels allows for a buffer in case of false breakouts or breakdowns.
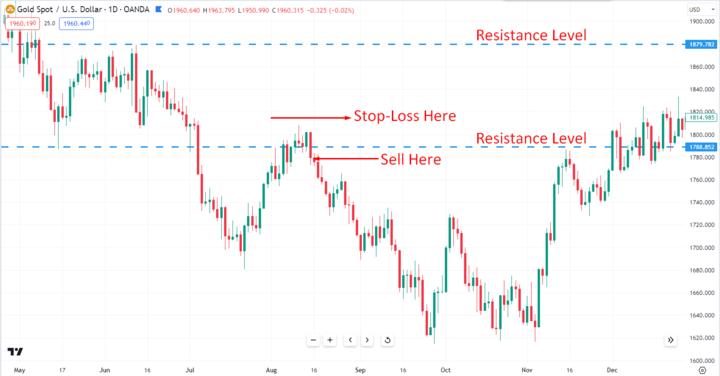
Image Source: TradingView
Book Profits: When booking profits, consider taking them near historical or technical resistance or support levels. These levels may present obstacles that could reverse or pause the trend. Booking profits at these points allows you to lock in gains and potentially re-enter trades at more favorable prices.
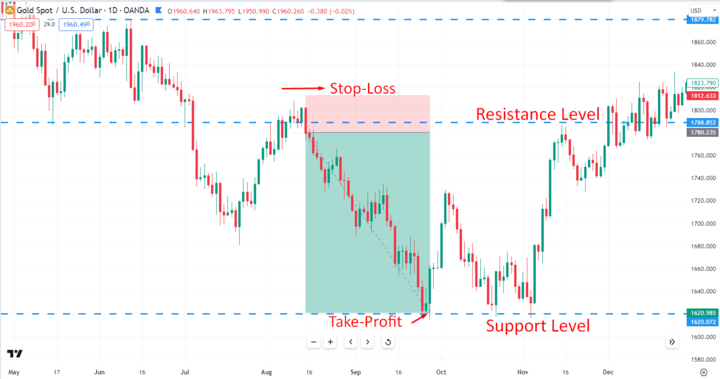
Image Source: TradingView
In recent years, gold prices have experienced volatility due to economic uncertainties, geopolitical tensions, and changes in investor sentiment. Staying up-to-date with the latest price charts and implementing these timing strategies can help you make well-informed trading decisions in line with the prevailing market conditions.
Conclusion
Gold charts provide traders with a wealth of valuable price data and trends that can be used to their advantage. The key to success lies in integrating chart patterns, technical indicators, and volume analysis.
By mastering the art of chart analysis, you can develop a deeper understanding of market trends, support and resistance levels, and key patterns. Remember to combine this knowledge with proper risk management techniques to protect your capital and optimize your trading outcomes.
Start leveraging price charts like a pro and unlock the potential of gold trading. With practice and a disciplined approach, you can enhance your trading skills and increase your chances of success in the exciting world of gold trading.