The total market capitalization of the large U.S. tech companies (AAPL, MSFT, GOOG, AMZN, NVDA, TSLA, META, NFLX) rebounded by $4.7 trillion in 2023 (67% growth rate); the largest contributors were Apple AAPL ($980bn), Microsoft MSFT ($89bn), and Nvidia NVDA ($810bn) . This week (July 31-August 4), the U.S. stock market will usher in the quarterly earnings day of a number of large technology companies, including Apple (AAPL) and Amazon (AMZN) will be announced on Thursday after the U.S. stock market earnings, in addition to investors are concerned about the AI hot stocks such as Super Micro Semiconductor (AMD), Qualcomm (QCOM) and so on.

Chart: This week's earnings calendar
Source: twitter@investingcom
Apple's main revenue from mobile phone product sales and seasonal changes are more obvious, the end of the second quarter to the third quarter is usually a relatively low revenue fiscal quarter, despite the launch of a variety of personal computer products this year, but analysts still predict that Apple's revenue ring downward trend. Bloomberg analysts predicted that Apple's third quarter 2023 adjusted revenue of $ 81.824 billion, adjusted expected net income of $ 188.19.
In addition to earnings, there are heavy labor market data releases, including Friday's U.S. nonfarm payroll data, Wednesday's ADP employment data, Tuesday's job openings data and Thursday's initial jobless claims.
The labor market has been the Federal Reserve's monetary policy focus of the data, but also an important indicator to reflect the economic barometer. Since the Fed raised interest rates, a wave of layoffs at large technology companies has prevailed. In the last seven months of 2023, tech companies have laid off 223,000 workers - that's 60,000 more tech layoffs than in all of 2022.
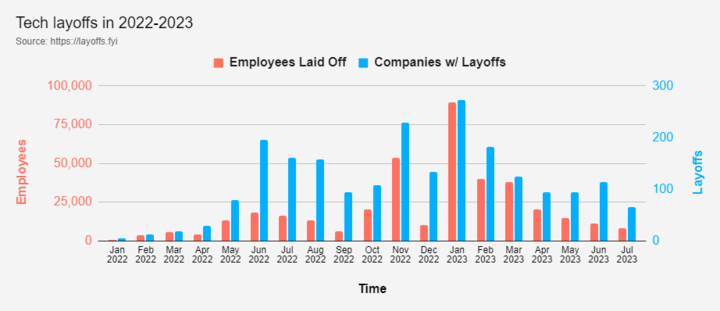
Chart: Number of departures and layoffs at tech companies
Source: twitter@KobeissiLetter
Technology companies are cyclical, growth-oriented businesses that invest in the future development of the company and are therefore more sensitive to changes in interest rates. When interest rates rise, companies find it difficult to raise capital, and high inflation causes salaries and operating costs to rise, so they reduce operating expenses, invest less, and make layoffs. For the average investor, tracking changes in labor market data over time can help predict economic trends and inflation, and thus the direction of the Federal Reserve's monetary policy, in order to make investment decisions.
Key Labor Market Indicators
Nonfarm Payrolls and Unemployment
- The U.S. labor market indicators of nonfarm payrolls and the unemployment rate are two important economic indicators used to describe and measure the state of employment in the United States. Among them:
- Nonfarm payrolls, the total number of people employed in all nonfarm industries in the United States, excluding agriculture. Nonfarm payroll is an indicator of economic activity and the overall state of the labor market. Its growth is usually considered an indication of economic growth and a healthy labor market.
- The unemployment rate, the ratio of the number of people in the labor force who are looking for work but are not currently employed to the total labor force. The labor force consists of the employed population and the unemployed population that is looking for work. The unemployment rate is a measure of the tightness of the labor market because it reflects the proportion of the labor force that is idle and not being absorbed by the labor market.
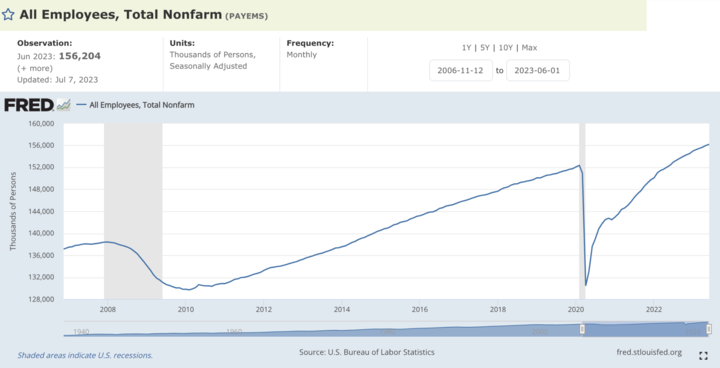
Chart: Nonfarm payrolls have been on an accelerating upward trend since the end of the recession in 2020
Source: FRED
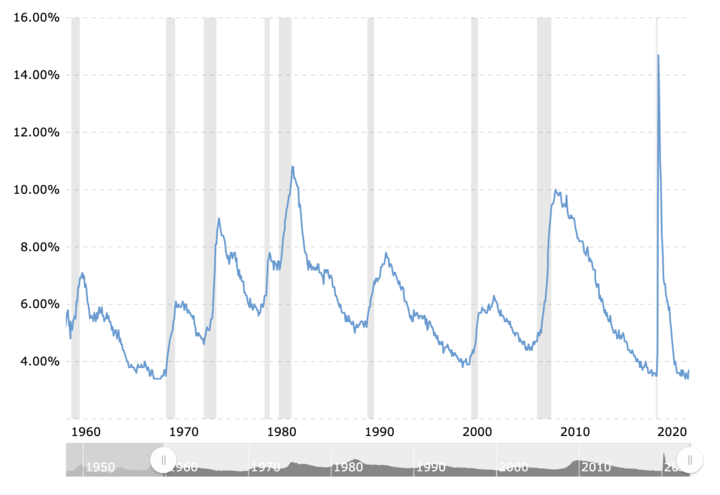
Chart: The U.S. unemployment rate has fallen to historic lows since the 1970s
Source: macrotrends
Economic growth and a booming labor market are often accompanied by an increase in nonfarm payrolls and a decline in the unemployment rate as more people are absorbed into the labor market. Sometimes, however, there can be a divergence between the two; for example, the unemployment rate may rise but nonfarm payrolls continue to grow, possibly because the labor force is growing faster than the labor market's absorption capacity.
Number of job openings
The number of job openings is one of the key economic indicators released monthly by the U.S. Department of Labor and measures the ratio of the number of unfilled jobs in the labor market to the total number of jobs. This indicator can be used to analyze the balance between supply and demand for talent. A high vacancy rate means that companies are having difficulty finding the right talent to fill positions and may reflect a lack of supply or skill-matching problems in the labor market. A lower vacancy rate, on the other hand, may indicate that the labor market is relatively well-supplied and that it is easier for firms to find suitable employees. The number of vacancies is usually monitored together with the turnover rate. A low turnover rate tends to indicate a relatively robust economy, as workers are more inclined to stay in their current jobs rather than take the risk of looking for new employment opportunities. Conversely, a higher turnover rate may reflect economic turmoil or uncertainty about prospects.
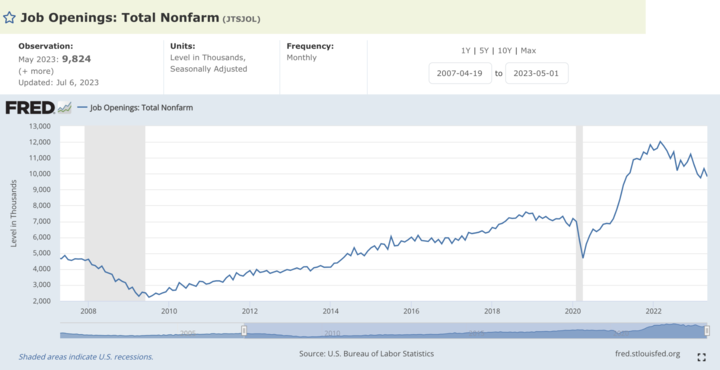
Chart: Latest May job openings down from early 2022 highs, but still at all-time highs
Source: FRED
ADP Employment
The U.S. ADP Employment data is published by ADP Inc. and provides an estimate of private sector employment in the United States. The data is derived from employer reports and payroll data processed by ADP, Inc. and focuses primarily on private-sector employment, excluding government employment data. Typically, ADP's employment data is released on the first Wednesday of each month, while the U.S. Department of Labor's nonfarm payroll data is released on the first Friday of each month. As a result, the ADP employment data is usually released before the nonfarm payroll data, providing an early indication of what is happening in the U.S. labor market.
Weekly Initial Jobless Claims
Weekly initial jobless claims, the number of people filing for unemployment benefits each week, is a measure of unemployment trends and labor market volatility. Because it is released weekly, it provides a real-time, frequent indicator of the labor market. Compared to the monthly release of nonfarm payrolls, initial jobless claims reflect the dynamics of the labor market more quickly.
To fully understand the state of the U.S. labor market, additional data indicators are needed, such as the long-term unemployment rate (which is the percentage of the total unemployed population that has been unemployed for more than 27 weeks, reflecting the persistence and complexity of the unemployment problem); the average wage growth rate (which is the average rate of growth in hourly earnings of U.S. workers, reflecting the wage level of the labor force and the wage pressures on the labor force); and the labor productivity rate (which is the ratio of output produced by the labor force to the labor force used). Labor productivity is a key economic indicator that reflects the efficiency of the labor force and the productivity of the economy), which together provide a comprehensive view of U.S. labor market conditions.
Phillips Curve
The Federal Reserve considers the relationship between inflation and unemployment when setting monetary policy, and the theory it follows is the Phillips curve. The Phillips curve is an economic theory proposed by economist William Phillips in the 1950s, which suggests that there is a negative relationship between the inflation rate and the unemployment rate.
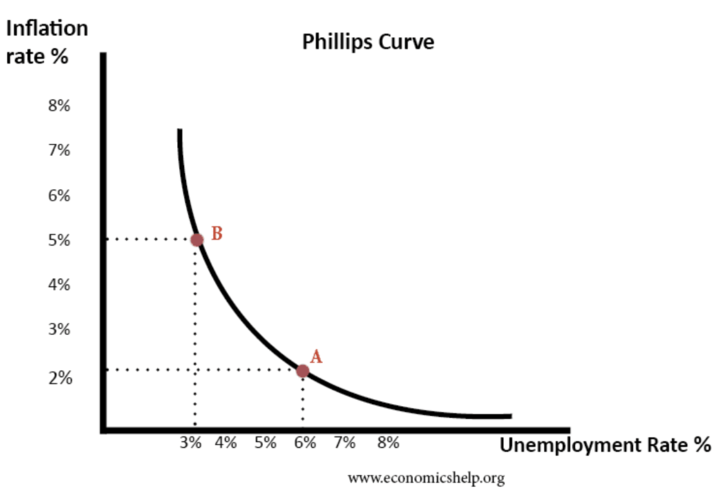
Figure: Phillips Curve
Source: economicshelp
According to the theory of the Phillips curve, when the unemployment rate is low, firms may face greater labor supply constraints, leading to wage increases, and firms will pass on cost increases to consumers, ultimately leading to higher inflation. Conversely, when the unemployment rate is high, there is an oversupply of labor and less upward pressure on wages, and firms may lower prices to attract consumers, leading to a decrease in the inflation rate.
Based on the theory of the Phillips curve, the Federal Reserve will consider the following scenarios when setting monetary policy:
Inflation-unemployment trade-off: The Federal Reserve must balance the relationship between inflation and unemployment. If unemployment is too low, it can lead to an acceleration of inflation, so a tight monetary policy is needed to keep inflation in check. On the other hand, if unemployment is high, it may signal an economic downturn and require easy monetary policy to stimulate economic growth and employment.
Long-run stable inflation objective: The Federal Reserve typically sets a long-term inflation target, such as an annual inflation rate of 2 percent. By controlling the money supply and interest rates, the Fed attempts to stabilize inflation around the target level while promoting maximum employment.
It should be noted that the Phillips curve is not always stable and accurate in the real economy, and the relationship between real inflation and unemployment is affected by many other factors, such as supply and demand conditions, price changes, and productivity. For example, during the economic recovery following the Great Crisis, the Phillips curve flattened and inflation became less sensitive to changes in the unemployment rate during the 2012-2019 period, as a result of "sustained declines in unemployment and relatively weak inflation".
Therefore, the Federal Reserve considers other economic indicators and market conditions in formulating monetary policy to achieve the goals of sound economic growth and price stability.


Conclusion
Studying the U.S. labor market has several instructive values for stock investing:
- Economic cycle forecasting: The U.S. labor market is one of the most important indicators of economic activity. By focusing on labor market indicators such as employment data, the unemployment rate, and the number of job openings, investors can better predict the direction of the economic cycle. There is a correlation between the state of the economy and the performance of the stock market; when the labor market is healthy and employment is good, it usually means that the economy is growing, which helps the stock market perform better.
- Prospects for corporate profitability: The state of the labor market affects the profitability prospects of companies. When the labor market is booming, the supply of labor may be tighter, leading to higher hiring costs for companies and hurting profitability. Investors can examine labor market data to assess corporate profitability and cost pressures to better select investment targets.
- Inflation expectations: A tight labor market could lead to higher wages, which in turn could cause inflation to accelerate. The level of inflation is an important indicator for investors to watch, as it typically means higher asset prices. Understanding labor market conditions can help investors predict the likely path of inflation and make investment decisions accordingly.
- Selection of industries and stocks: The degree to which the labor market affects different industries and stocks varies. Certain industries are more sensitive to the labor market, such as retail, restaurants, and other labor-intensive industries. Investors can study labor market data to select industries and stocks that will benefit from the improving labor market.
- Direction of monetary policy: The Federal Reserve also looks at the performance of the labor market when setting monetary policy. Often, a labor market boom can lead to rising inflation, and the Fed may adopt a tight monetary policy to control inflation. Investors need to pay attention to the labor market data to understand the possible direction of the Fed's monetary policy and make investment decisions accordingly.
Overall, studying the U.S. labor market for stock investing helps to better understand the performance of the economy and companies, which helps investors make informed investment decisions, find potential investment opportunities, reduce risk, and optimize investment portfolios. However, there are many factors to consider when investing in stocks, and the labor market is only one of them. Investors must also consider other macroeconomic indicators and market dynamics to make more accurate investment decisions.