


EURUSD
Fundamental Perspective
A modest increase in December inflation caused a minor depreciation in the value of the U.S. dollar against the Euro. This information suggested that the Federal Reserve would likely continue implementing interest rate cuts by mid-year.
As investors prepared for a busy week, trading activity diminished towards the day's conclusion. Key events to look at are the Federal Open Market Committee meeting and the Treasury's refund announcement, which will provide a comprehensive breakdown of the government's borrowing requirements for the upcoming quarter—besides, significant U.S. economic reports, like January's non-farm payrolls, would grab massive investors' attention.
The Personal Consumption Expenditures (PCE) price index increased by 0.2% in December, following a 0.1% decline that remained unchanged in November. The yearly reading was increased by 2.6% but was consistent with the previous month's data and in line with market expectations.
The market sentiment has entirely accounted for the probability that the initial rate cut will take place at the May meeting, pessimizing it to approximately 90% from 94% on Thursday. Investors expect an average of five rate reductions, each amounting to 25 basis points, over the year.
In contrast to the dollar, the Euro gained 0.1% against the dollar, reaching 1.0856 EURUSD, after rebounding from a six-week low earlier.
Martins Kazaks, a policymaker at the European Central Bank (ECB), stated on Friday that although the ECB was making strides in its efforts to curb inflation, further time was required before a policy reversal could transpire.
Technical Perspective
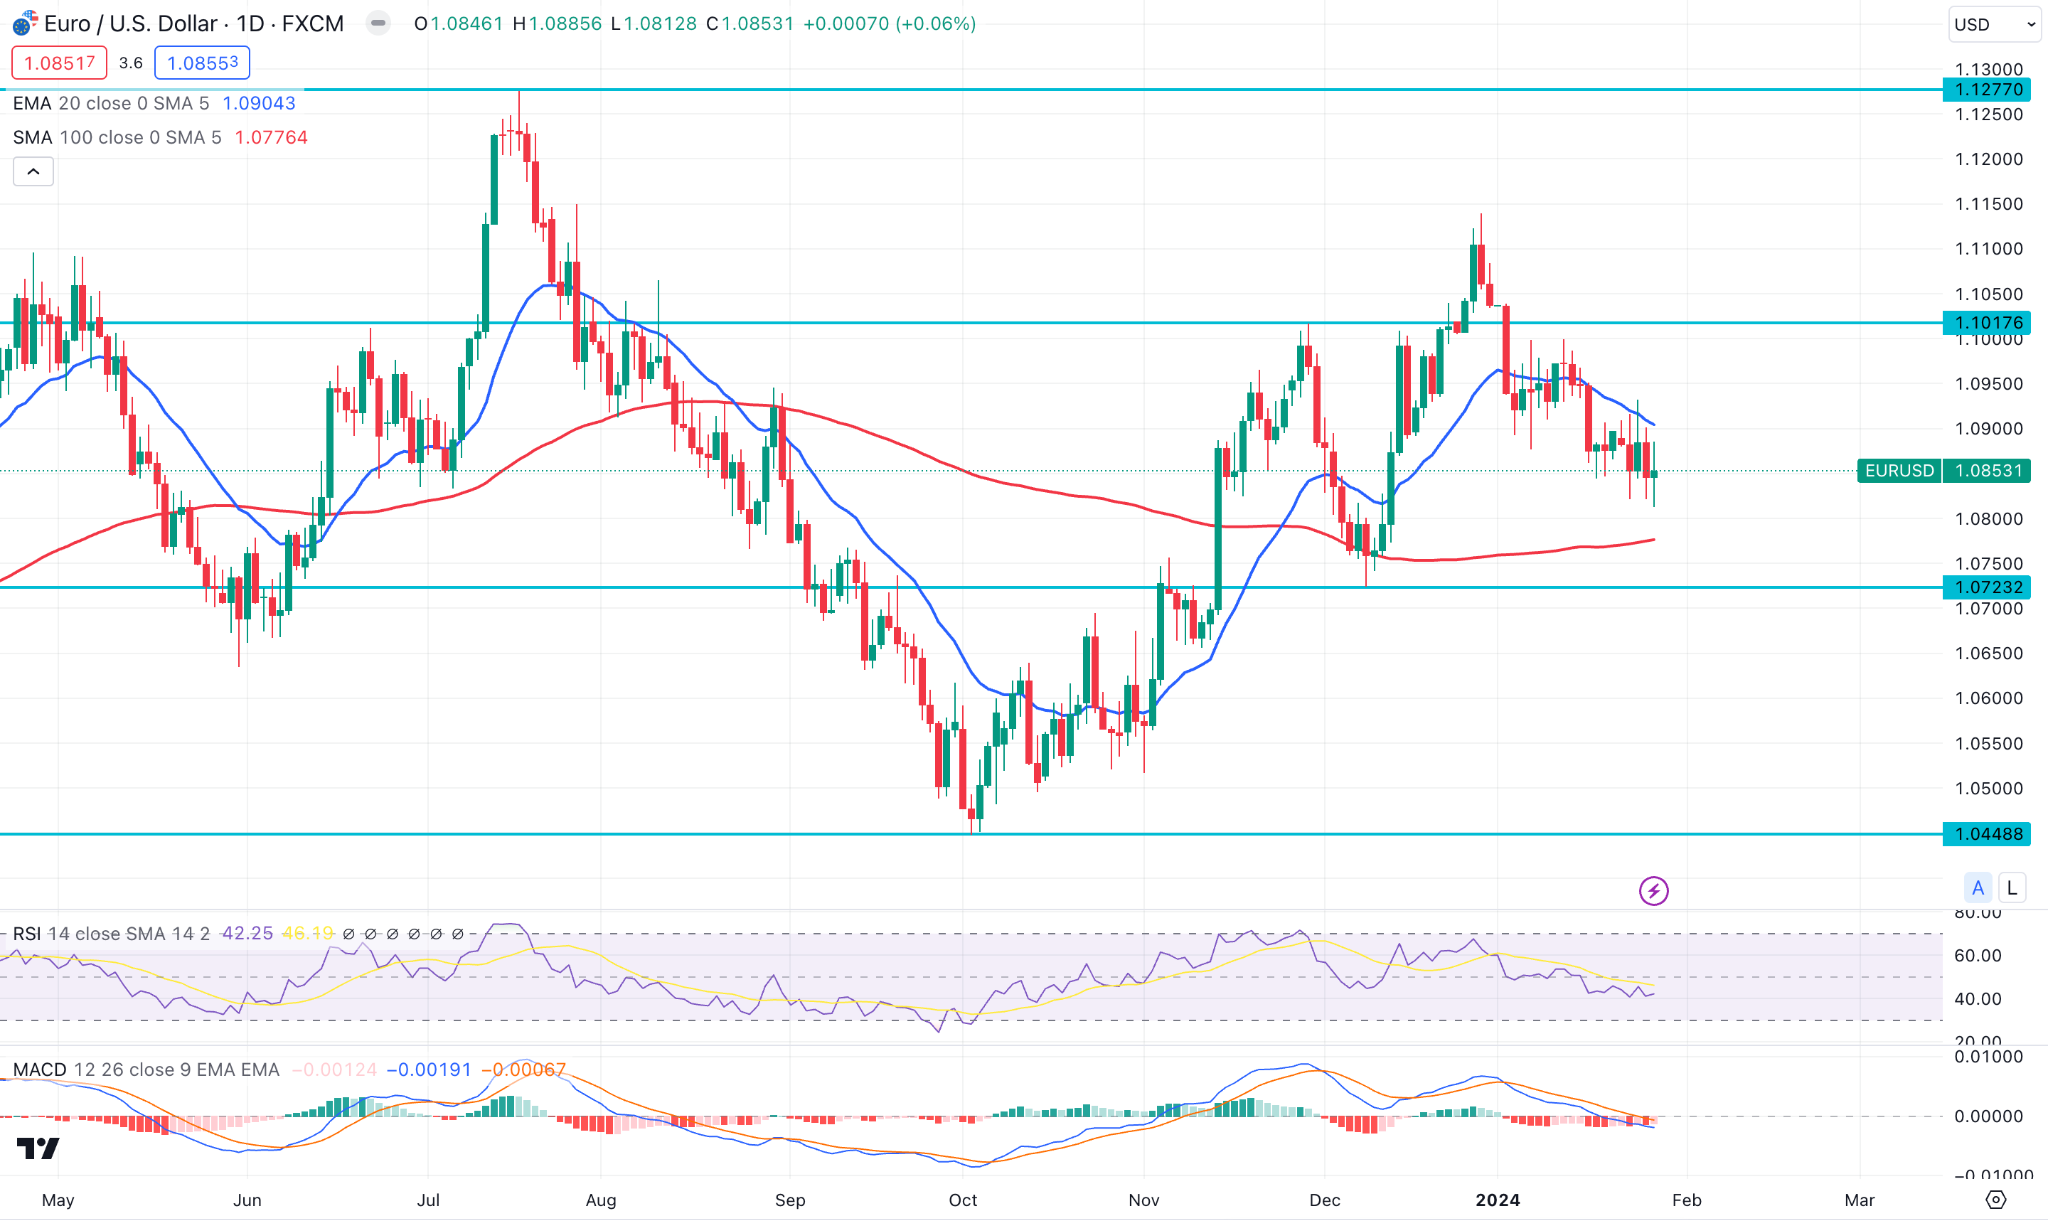
EURUSD showed a bearish continuation in the weekly chart, as four consecutive bearish candles are present.
The 100-day SMA is below the current price with an upward slope, while the 20-day EMA is an immediate resistance. The bearish RSI with a red MACD Histogram might offer a short opportunity in this pair, targeting the 100-day SMA.
On the bullish side, immediate buying pressure with a stable market above the 1.0950 level could activate the long-term bull run toward the 1.1200 area.
GBPJPY
Fundamentally, the GBPJPY pair trades bullish as sterling exhibits resilience while the yen encounters downward pressure. After lackluster inflation data, market participants anticipate an imminent interest rate increase from the Bank of Japan (BoJ).
Furthermore, the Bank of Japan (BoJ) disclosed its quarterly economic outlook, which projected inflation to approximately 1.9% in 2024, marginally lower than its target of 2%. This maintains optimism regarding the possibility of a rate increase if new data reveal an inflationary trend that persists beyond this critical threshold.
In contrast, it is widely anticipated that the Bank of England (BoE) will uphold its 5.25% bank rate on February 1. This is consistent with current market sentiment and consensus analysts' forecasts. Enthusiastically anticipating the revised projections and the subsequent press conference to obtain additional insights from investors.
Currently, the possibility of a dovish tone by the Bank of England has decreased, given signs suggesting a more prudent approach for GBPJPY bulls.
Technical Perspective
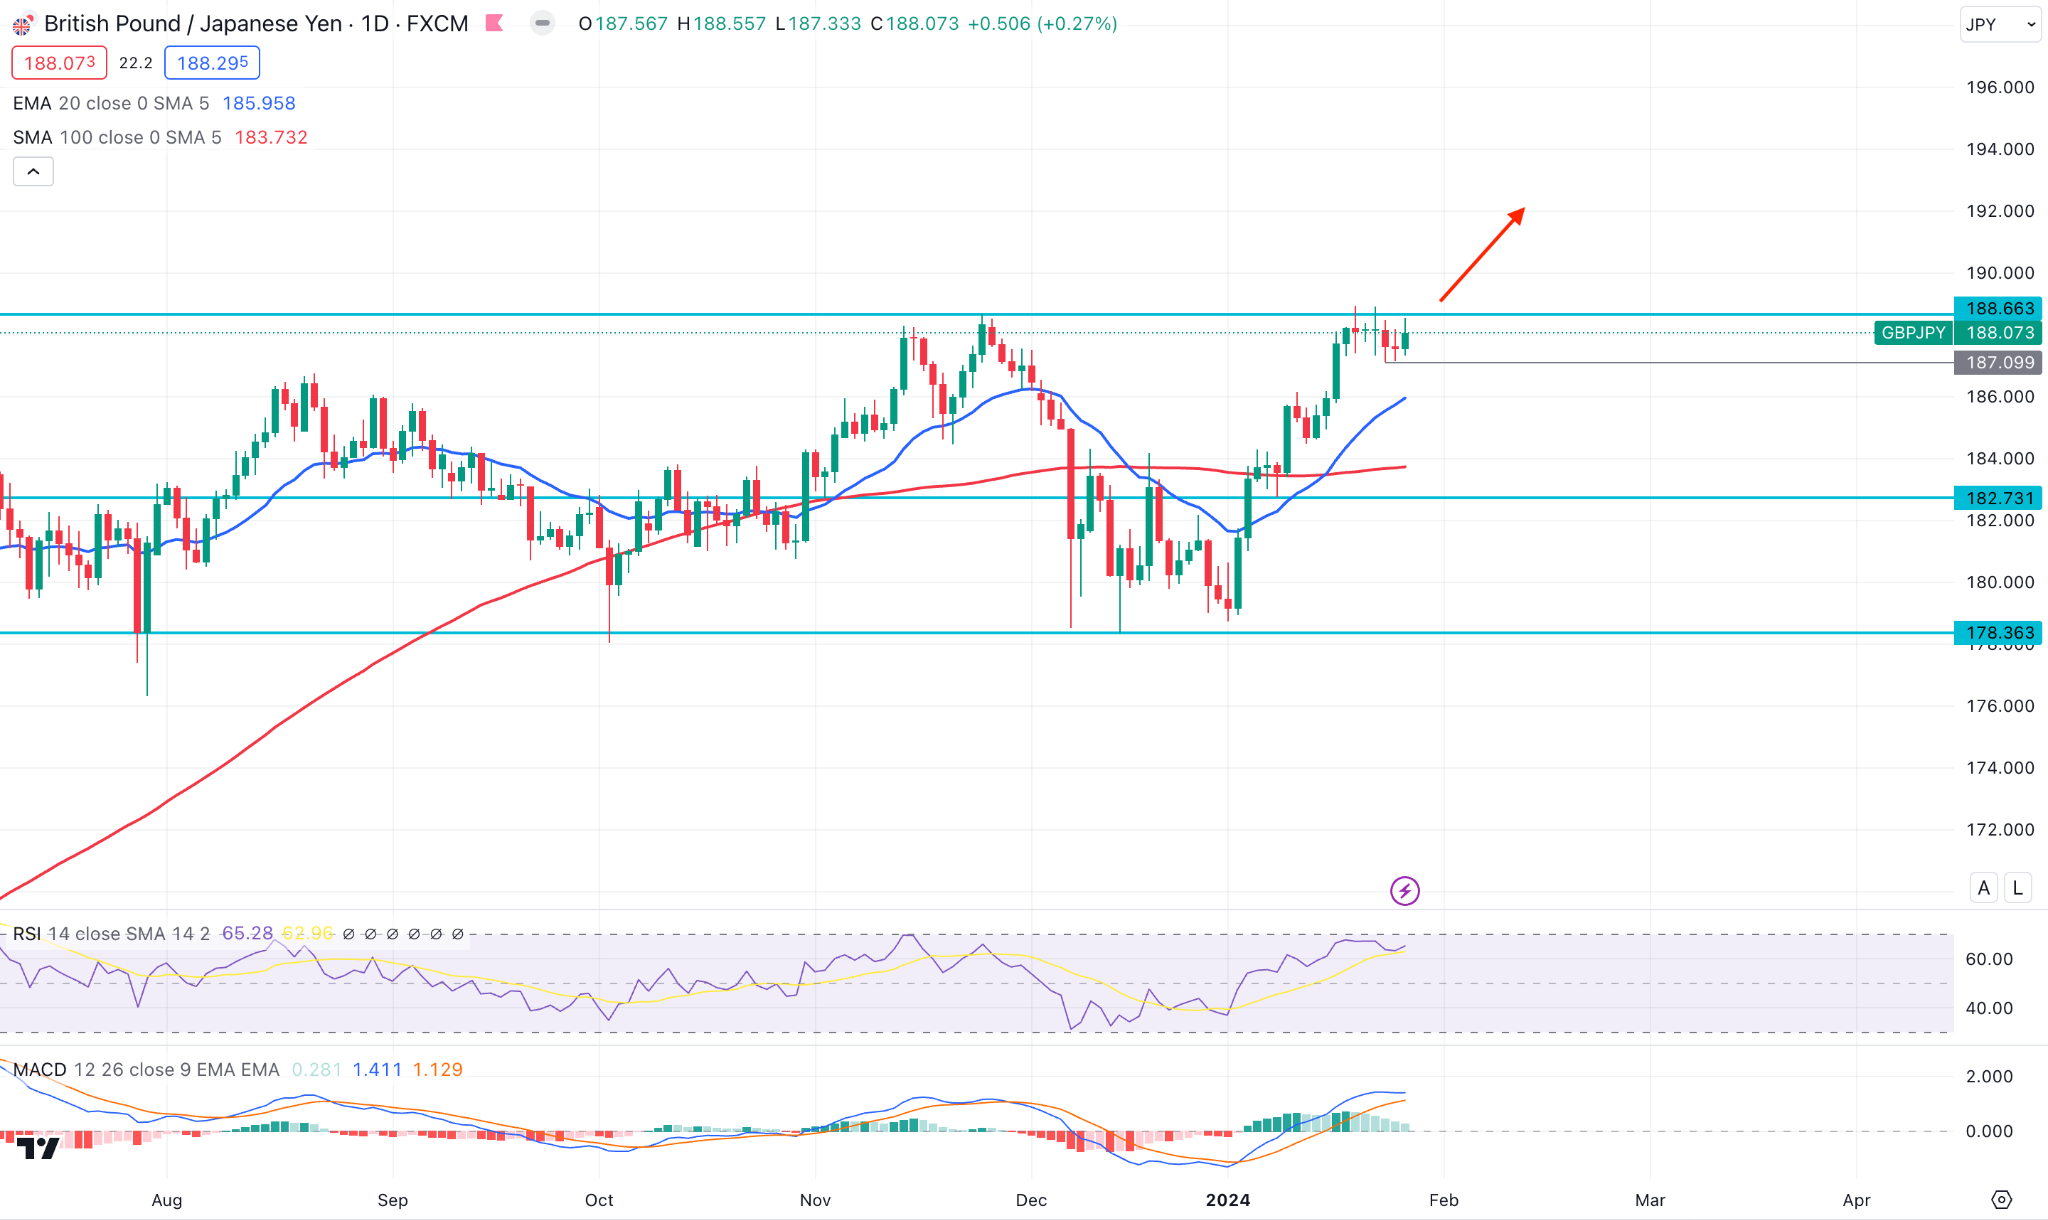
The last week closed sideways after a strong bullish Marubozu candlestick, which suggests a long-term bullish continuation.
In the daily chart, a bullish crossover among 100 and 20 MA suggests an active bullish pressure, supported by the upward Relative Strength Index.
Based on this outlook, a daily close above the 188.70 high could be a probable long opportunity in this pair, targeting the 192.00 psychological level. The alternative approach is to find an immediate selling pressure below the 20 DMA before anticipating a bearish signal.
Nasdaq 100 (NAS100)
Fundamental Perspective
The Nasdaq 100 fell on Friday, with Intel's post-earnings downturn being the primary contributor. Since reaching their lowest points due to the pandemic, all three primary indices have increased by more than 100 percent.
Although the major indices exhibited a mixed performance on Friday, the week came to a positive conclusion. The S&P 500 and Nasdaq ended a six-day winning streak with losses on Friday.
The December PCE data fell marginally short of annualized forecasts but met the monthly expectations of economists. The Federal Reserve closely monitors this index to gain an understanding of inflation, which in turn affects decisions regarding monetary policy.
The PCE report was released the day after gross domestic product (GDP) data for the fourth quarter revealed economic growth that exceeded expectations.
Among Nasdaq 100 performers, Intel's stock fell by approximately 12% on Friday, after the company released an unfavorable forecast for the fiscal first quarter.
Investors might expect a volatile week as top-tiered Nasdaq companies like Apple Inc, Microsoft, Google, Meta, and Amazon.com are set to release quarterly earnings reports this week.
Technical Perspective
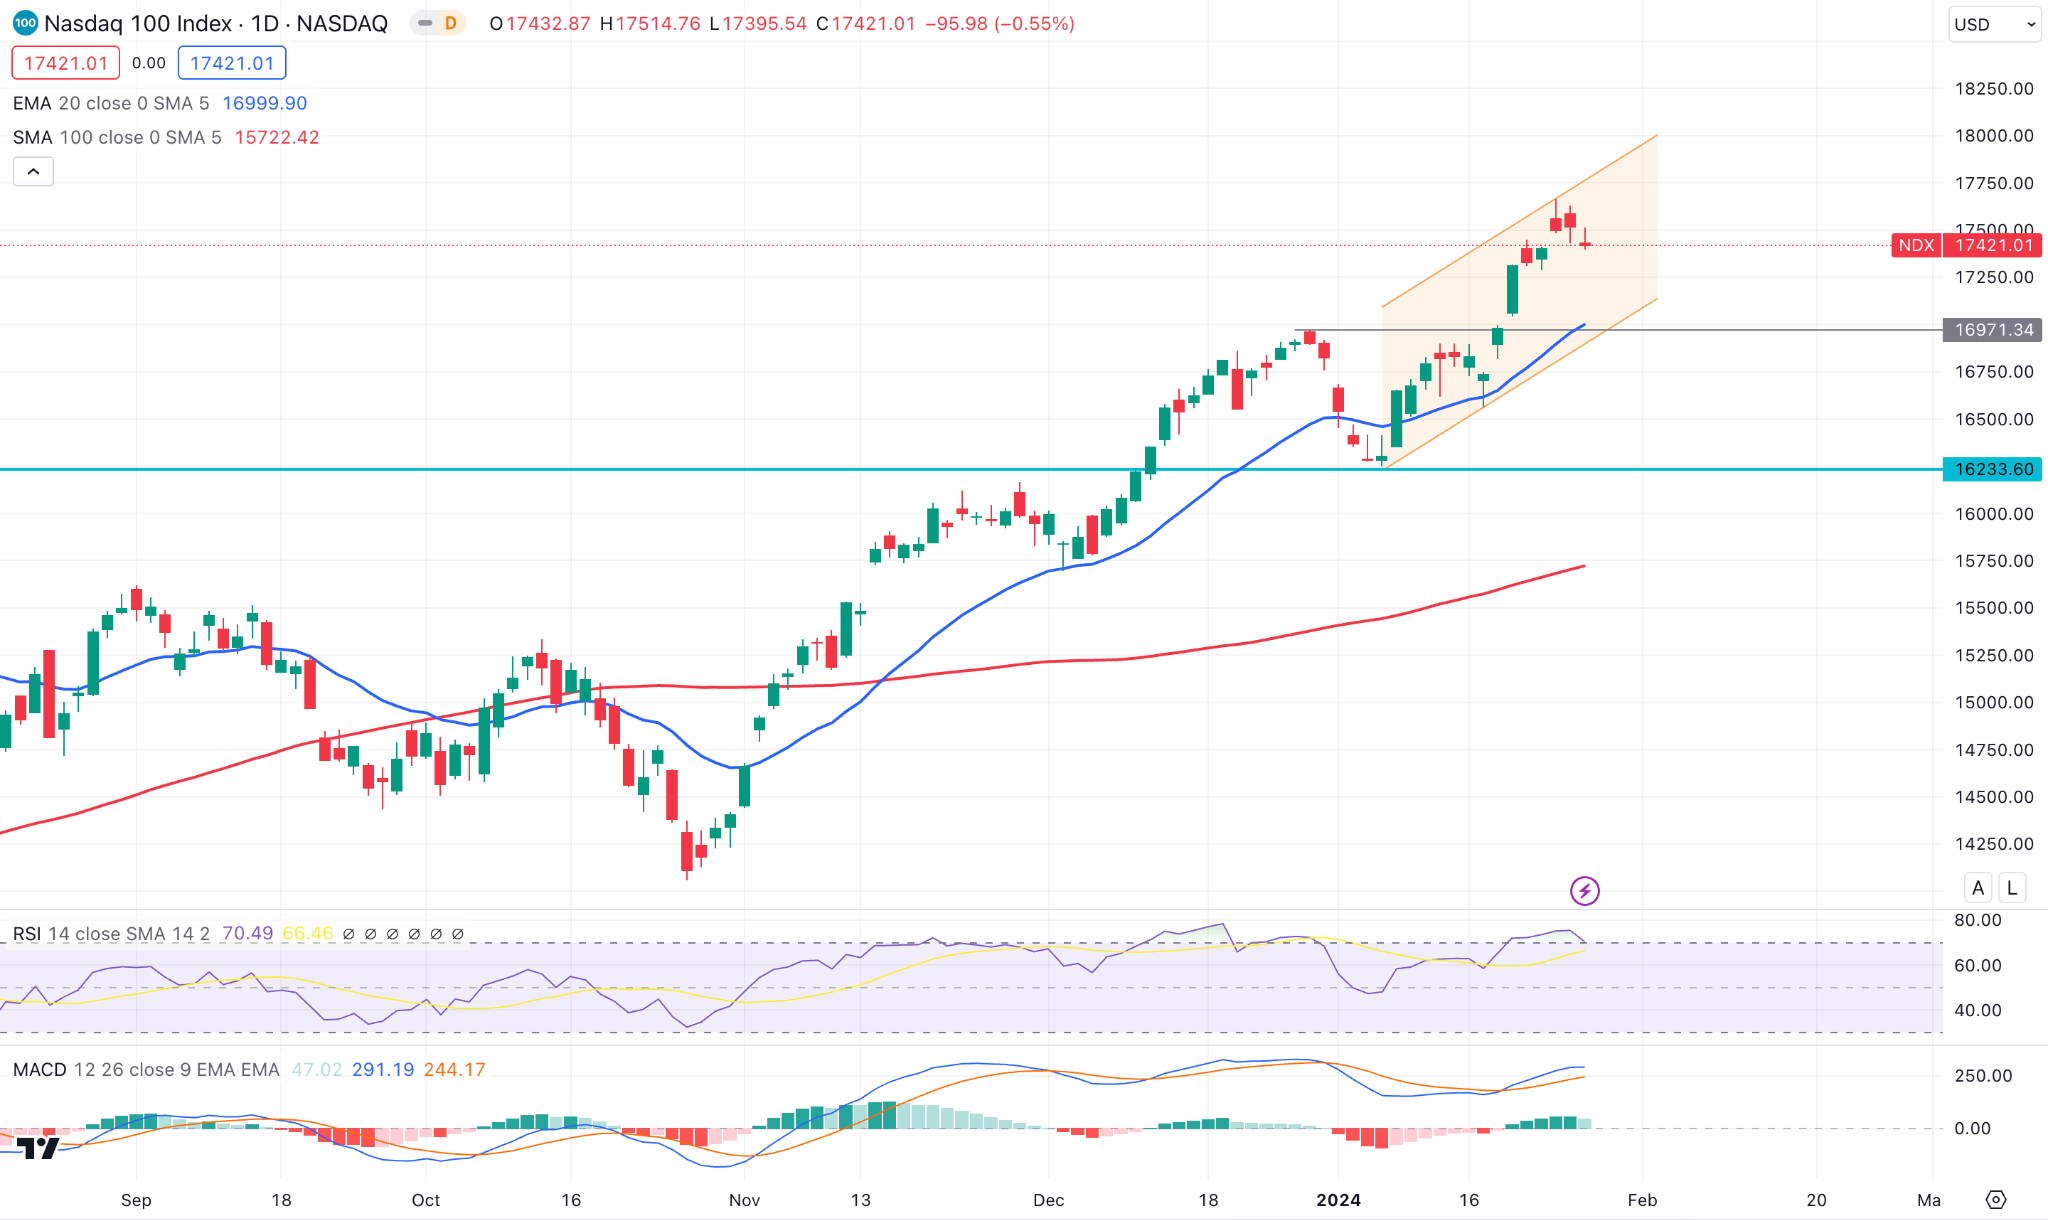
The weekly candle closed sideways after a strong bullish candle, which suggests ongoing upward pressure.
Although the 100-day SMA is bullish with the 20-day EMA, investors might expect a minor downside correction from the channel resistance. The ideal long approach in this index is to find a bullish rebound from the 17200.00 to 16971.99 level, targeting the 18250.00 level.
S&P500 (SPX500)
Fundamental Perspective
The S&P 500 ended its five-session run of record highs on Friday, despite Intel's disappointing revenue forecast and U.S. economic data indicating a moderation in inflation.
The personal consumption expenditure index expanded moderately in December, resulting in the annual inflation rate remaining below 3% for the third consecutive month.
The volume of shares traded on U.S. exchanges remained comparatively low at 9.6 billion, compared to the average of 11.6 billion shares traded during the previous two sessions. A ratio of 1.2 to 1 also indicated that advancing issues were more than declining ones within the S&P 500.
Investors will closely monitor how the price trades during the high-voltage FOMC meeting and earnings releases from large-cap companies.
Technical Perspective
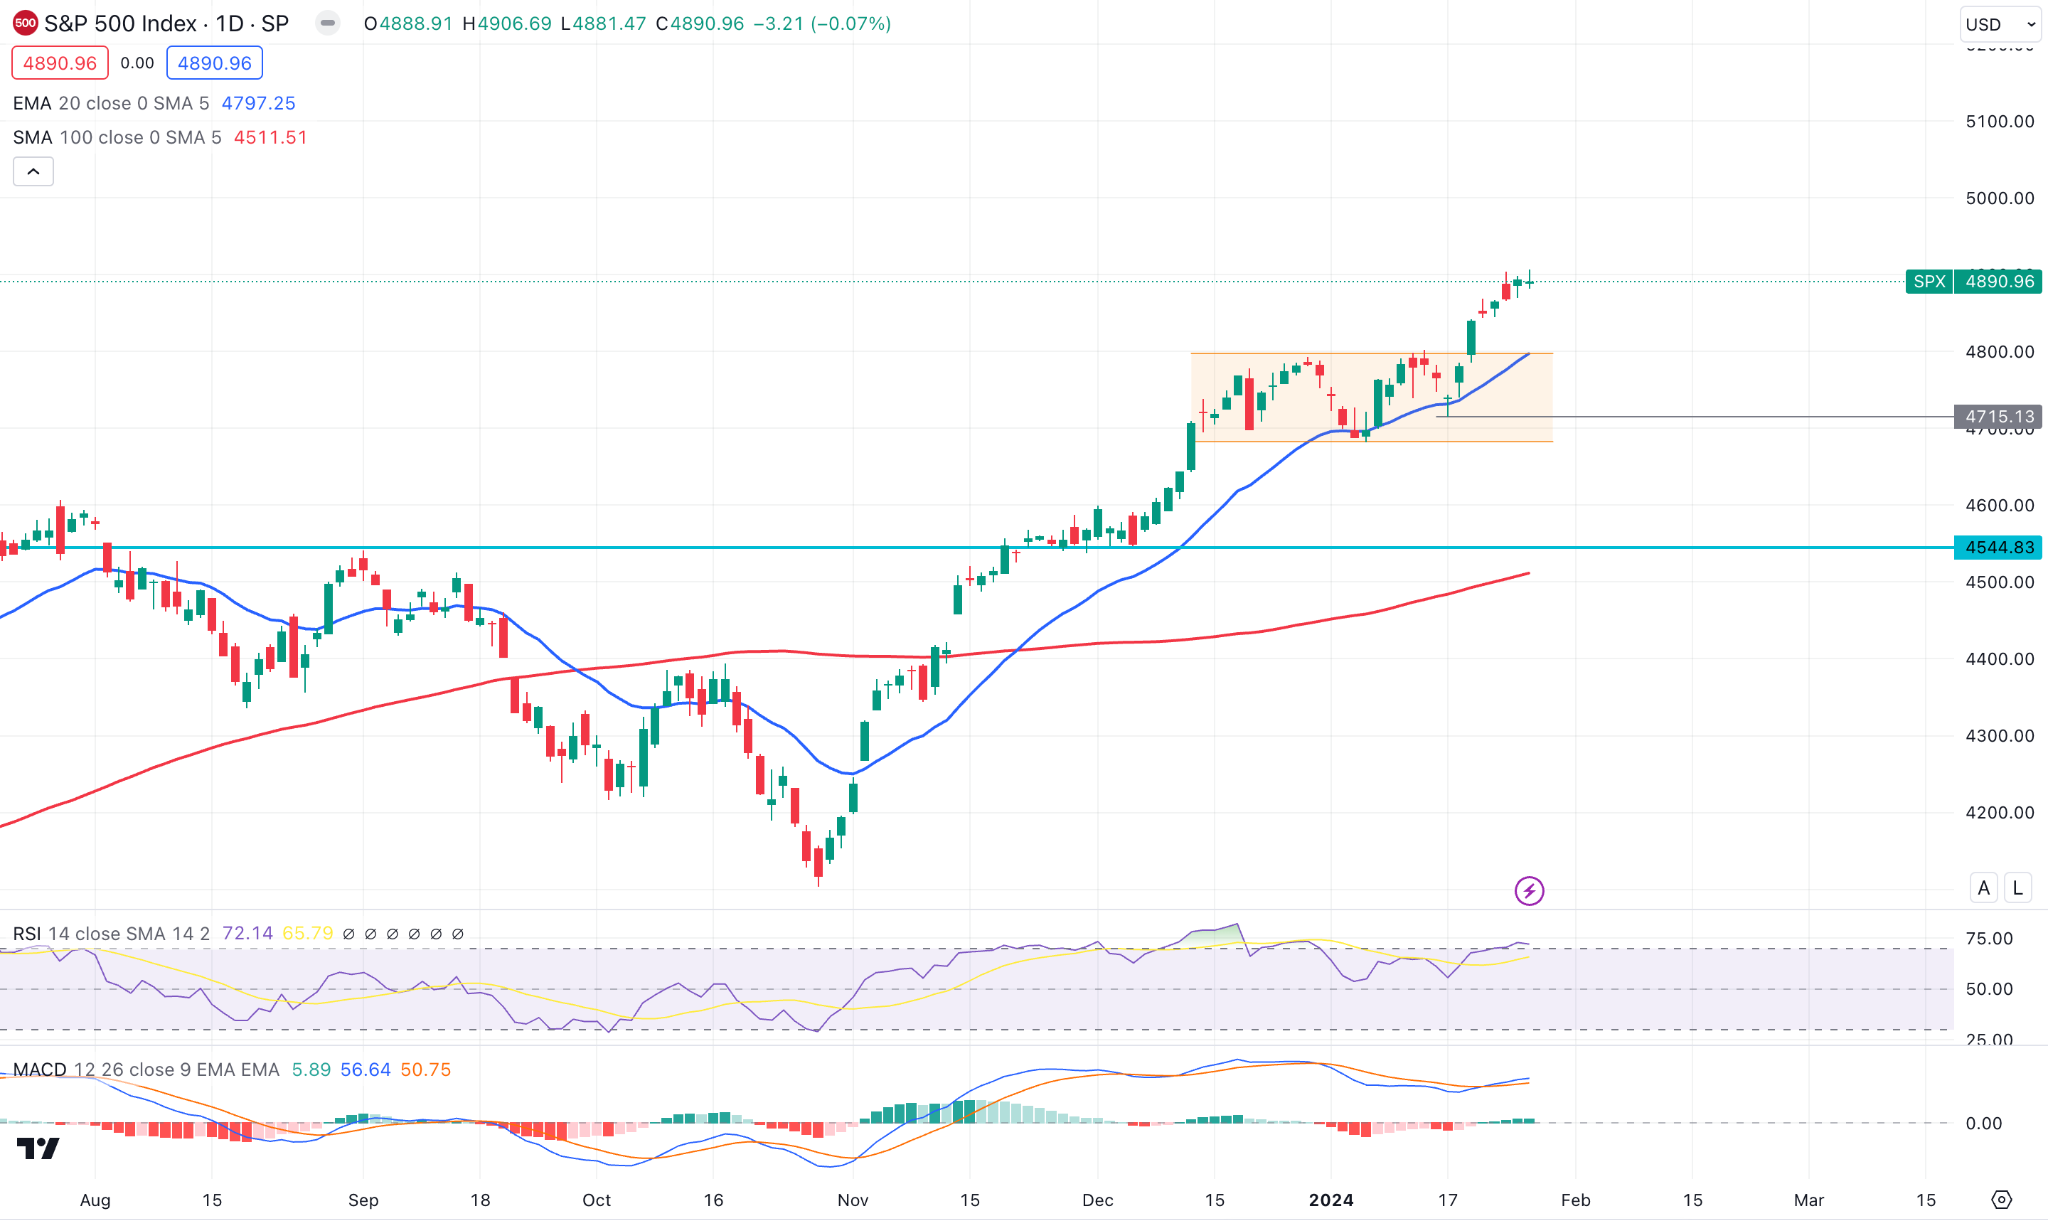
S&P 500 weekly price ended bullish with a new higher high formation. However, the recent candlestick pattern signals a considerable downside correction pending before the upward continuation.
The 20-day EMA shows upward traction, while the RSI is at the overbought 70.00 line. However, the ongoing bullish continuation from the rectangle breakout could resume after finding a downside correction to the range resistance.
Hang Seng Index (HK50)
Fundamental Perspective
Hong Kong exports expanded by 11.0% annually to HK$386.4 billion in December, following a 7.4% annual growth in the previous month.
Asia and the United States witnessed a surge in shipments by 10.9% and 26.5%, respectively. Conversely, exports to Germany encountered a decline of 9.7%.
Concurrently, during December 2023, the value of imports in the city reached HK$446.3 billion, representing an 11.6% increase compared to the previous year's period.
Significant increases in imports were observed in Thailand, Korea, and Vietnam, at respective growth rates of 17.33%, 42.3%, and 77.9%. Based on the most recent data on imports and exports, Hong Kong incurred a trade deficit of HK$59.9 billion in December 2023.
Technical Perspective
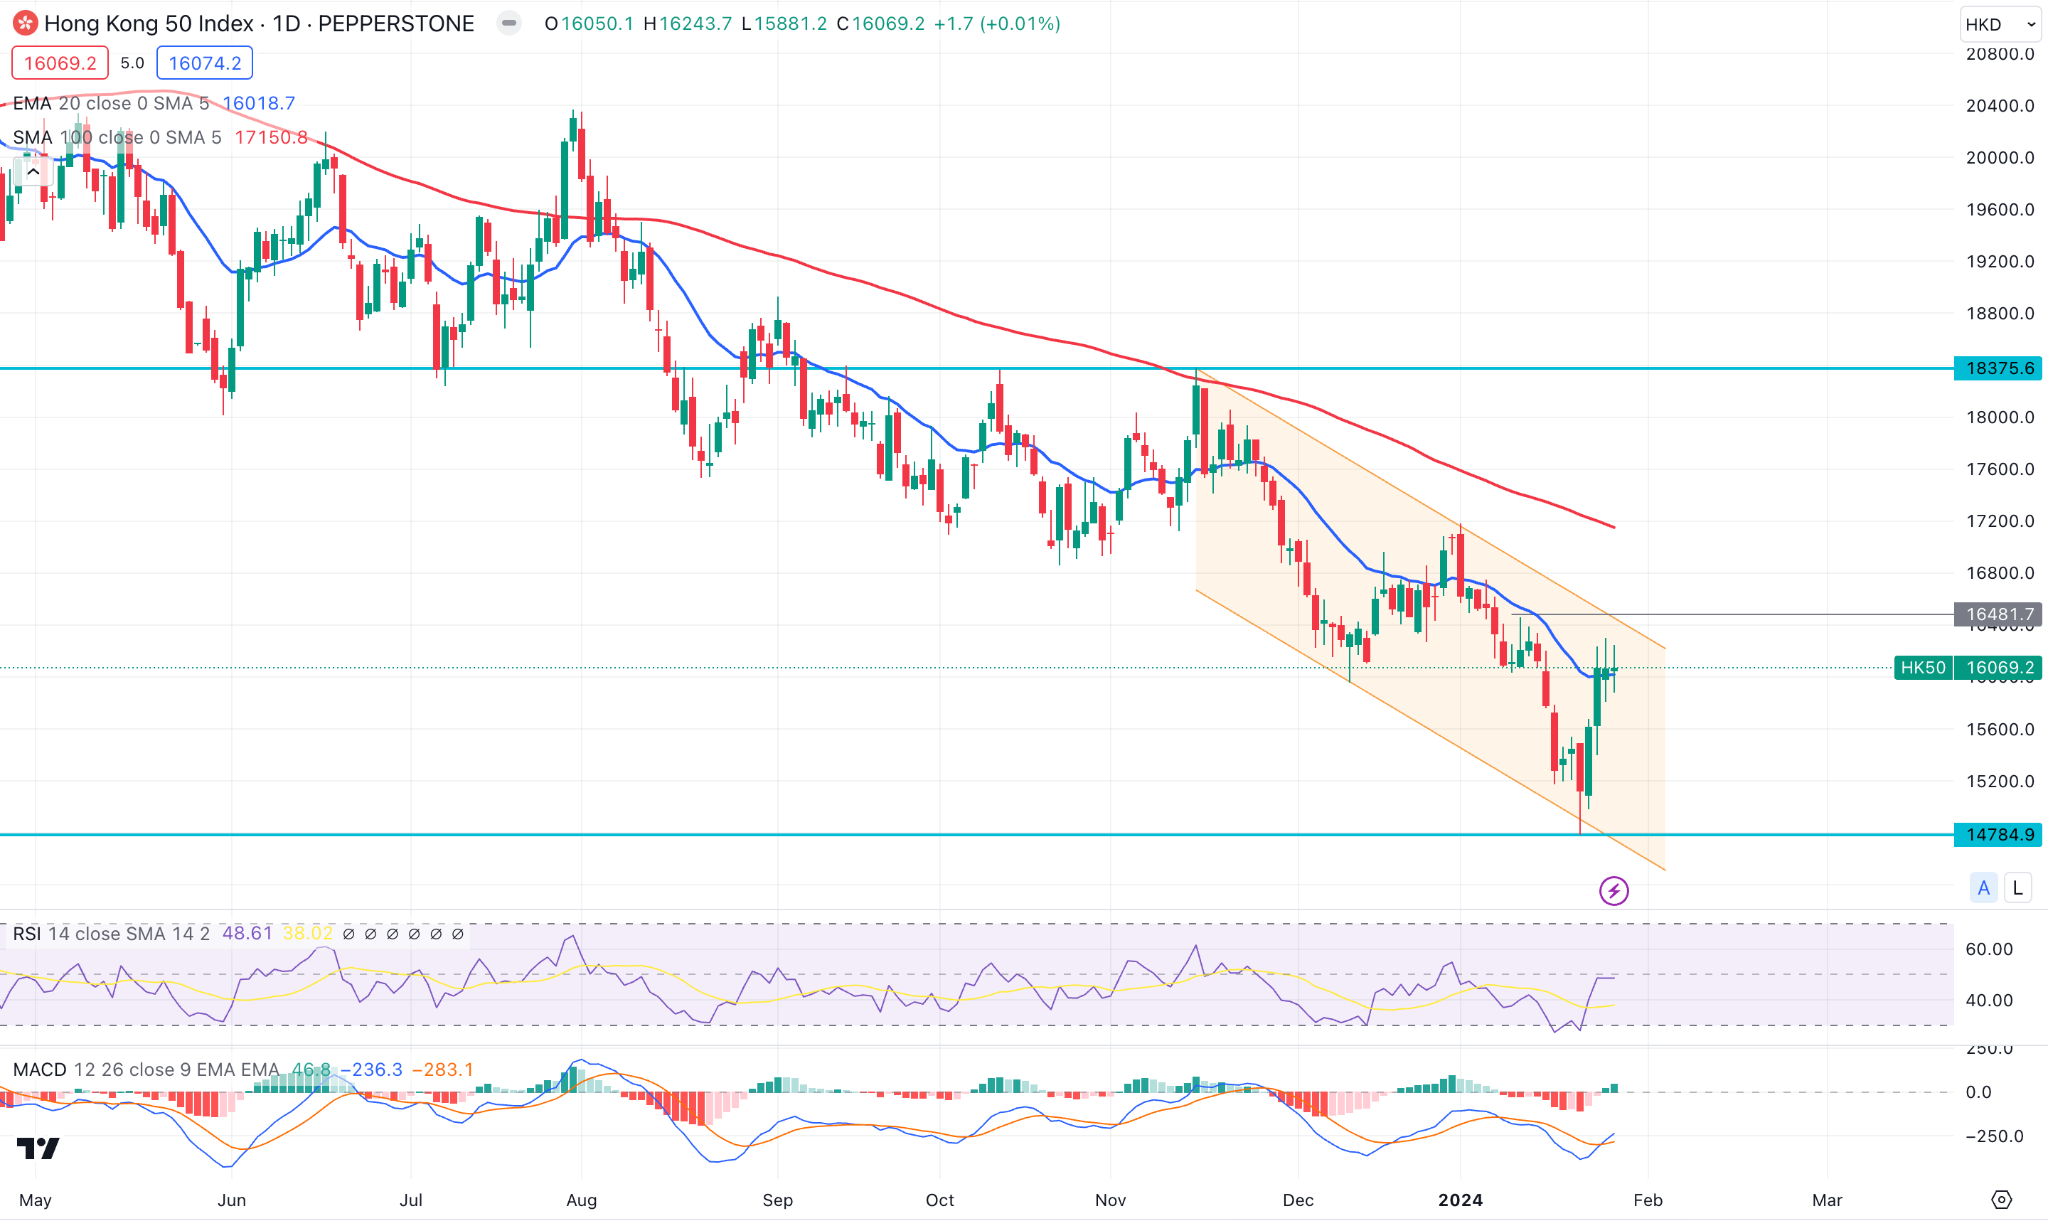
The recent price trades within the descending channel where the dynamic 20 EMA is the immediate resistance. As the current price consolidates at the dynamic level an immediate bullish breakout with a D1 candle above the 16481.67 level could indicate a bullish breakout.
As of now, the current 14-day RSI is at the neutral 50.00 line, where a bearish breakout below the 20 EMA level could resume the existing trend, towards the 14753.45 level.
Bitcoin (BTCUSD)
Fundamental Perspective
Particularly regarding Bitcoin, the cryptocurrency landscape experienced a significant development in January when the largest hedge funds and financial institutions globally adopted spot Bitcoin ETFs, signifying a turning point in the history of cryptocurrencies.
The price of Bitcoin experienced significant volatility in the span of 28 days, oscillating between 49K and 38K, as a result of these events. Notwithstanding this instability, Bitcoin concluded the month with a moderate increase of 0.7%, almost retracing its initial position.
As February commences, the focus shifts towards historical Bitcoin price data, which unveils thought-provoking patterns. Based on data from 2011 to 2023, Bitcoin has consistently demonstrated a noteworthy profitability level during February, averaging 14.5%.
A review of Bitcoin's price history reveals a recurring trend of increased activity and significant price fluctuations in February. Although recognizing the ever-changing nature of the cryptocurrency market, the ten-year history of Bitcoin as an exchange-traded asset provides investors and enthusiasts with invaluable guidance and insights.
Technical Perspective
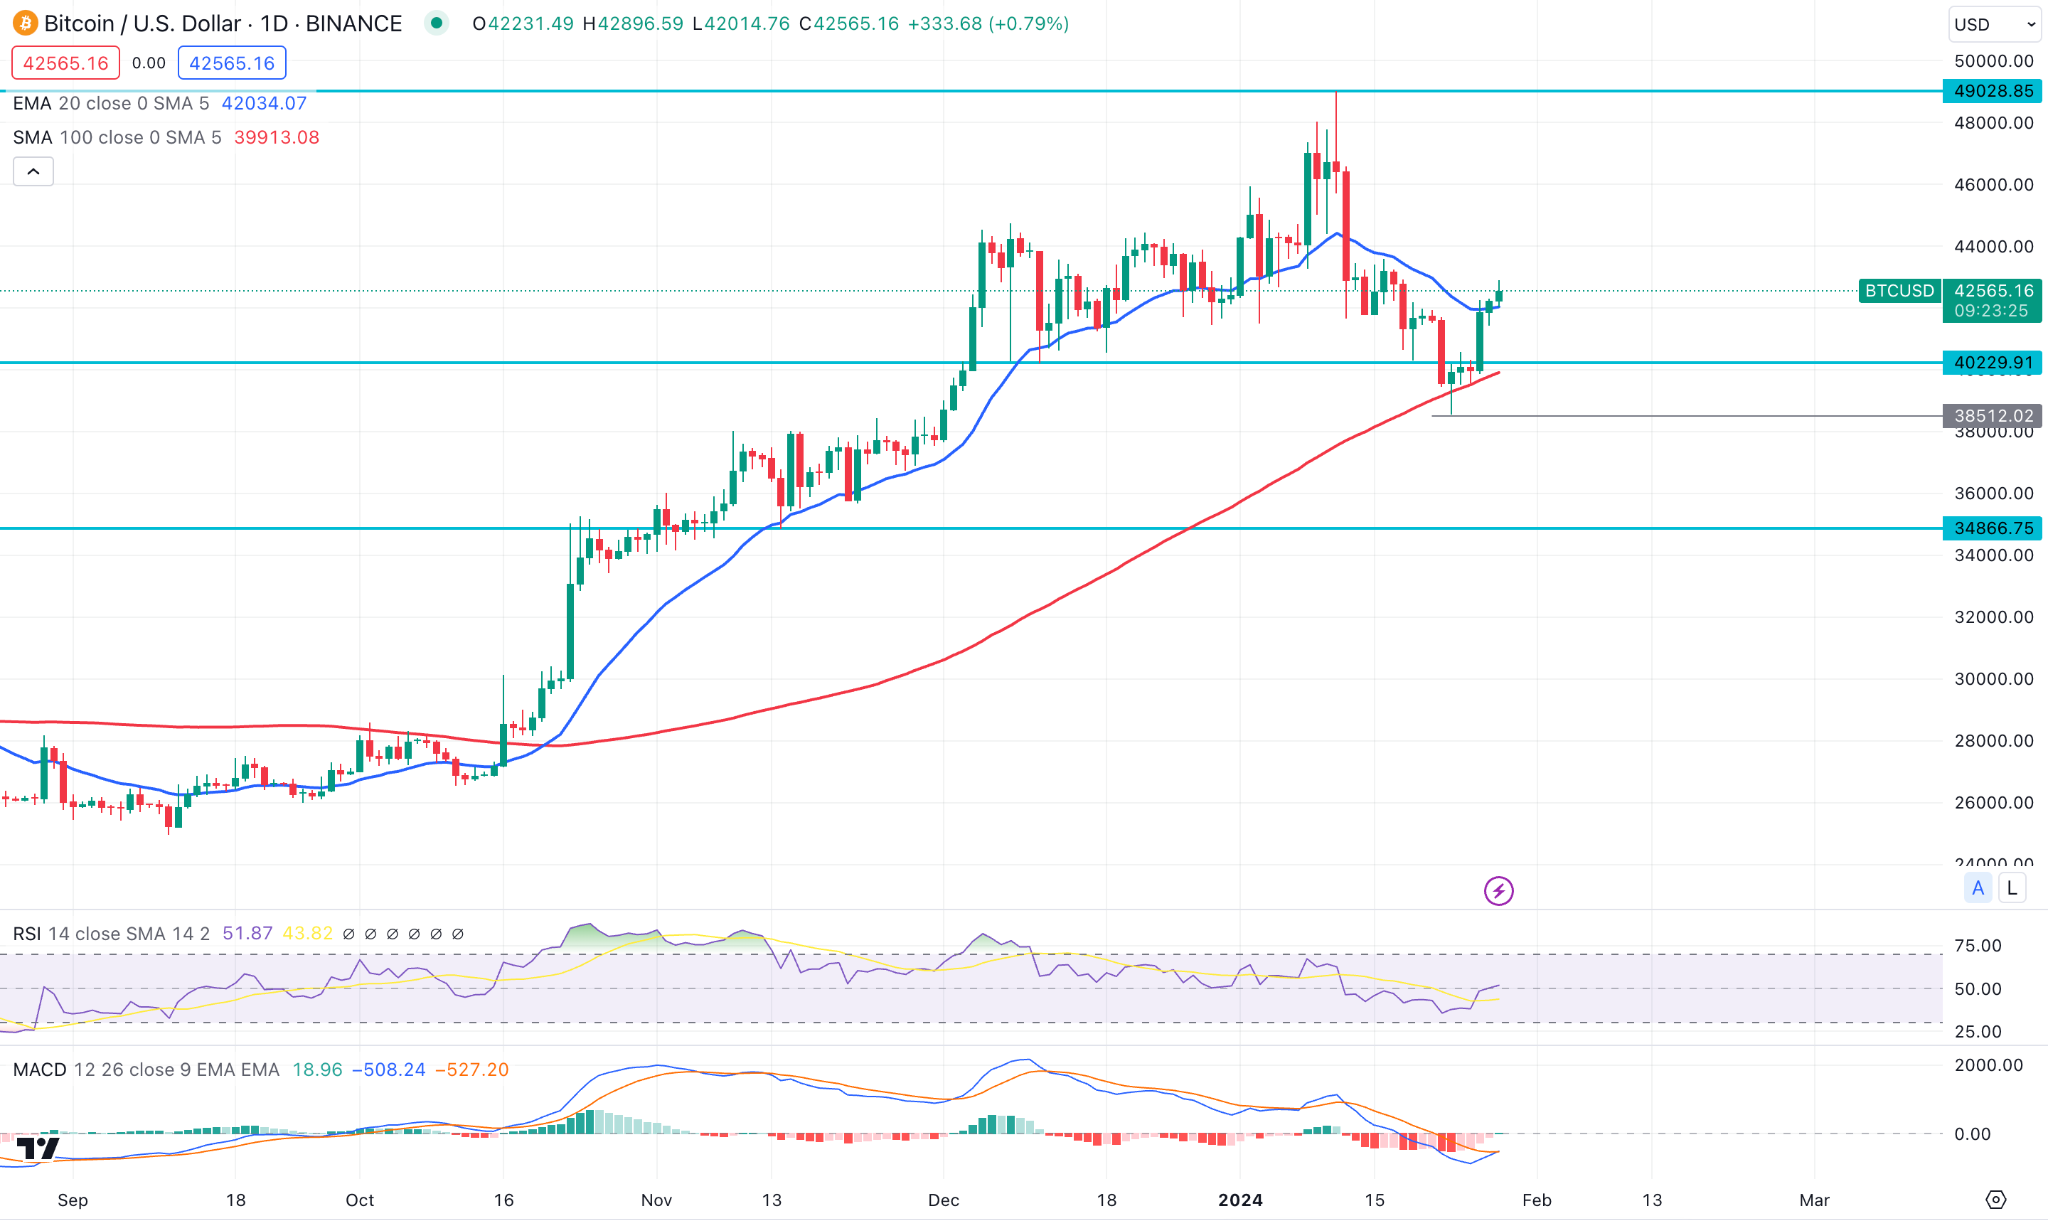
The weekly BTCUSD shows a strong bullish rebound, sweeping the sell-side liquidity from the 40,000.00 support level.
A bullish daily candle is visible above the 20-day EMA, while the 100-day SMA shows a bullish continuation signal by remaining below the current price. In that case, upward pressure is potent as long as the price trades above the 41,000.00 level.
On the bearish side, a strong downside pressure below the 100-day SMA is needed before aiming for the 36,000.00 level.
Ethereum (ETHUSD)
Fundamental Perspective
Lucas Kiely, Chief Investment Officer for Yield App recognized the recent authorization of a Bitcoin spot ETF, a significant development. In contrast to the lengthy and contentious procedure about the Bitcoin ETF, Kiely conveyed confidence in the ETH spot ETF's approval.
Kiely outlined seven ETH spot ETF applications presently undergoing SEC review, with May 23, 2024, being the deadline for VanEck's application. It is difficult for the regulator to deny VanEck's applications without affecting other pending applications, as evidenced by the SEC's proceedings.
In addition, the authorization of an ETH product would facilitate the introduction of a wide range of crypto-backed or linked Exchange-Traded Products (ETPs), including spot products and more complex instruments. Ethereum's shift to proof-of-stake is a remote possibility, analogous to the challenges equity markets face regarding liquidity.
Technical Perspective
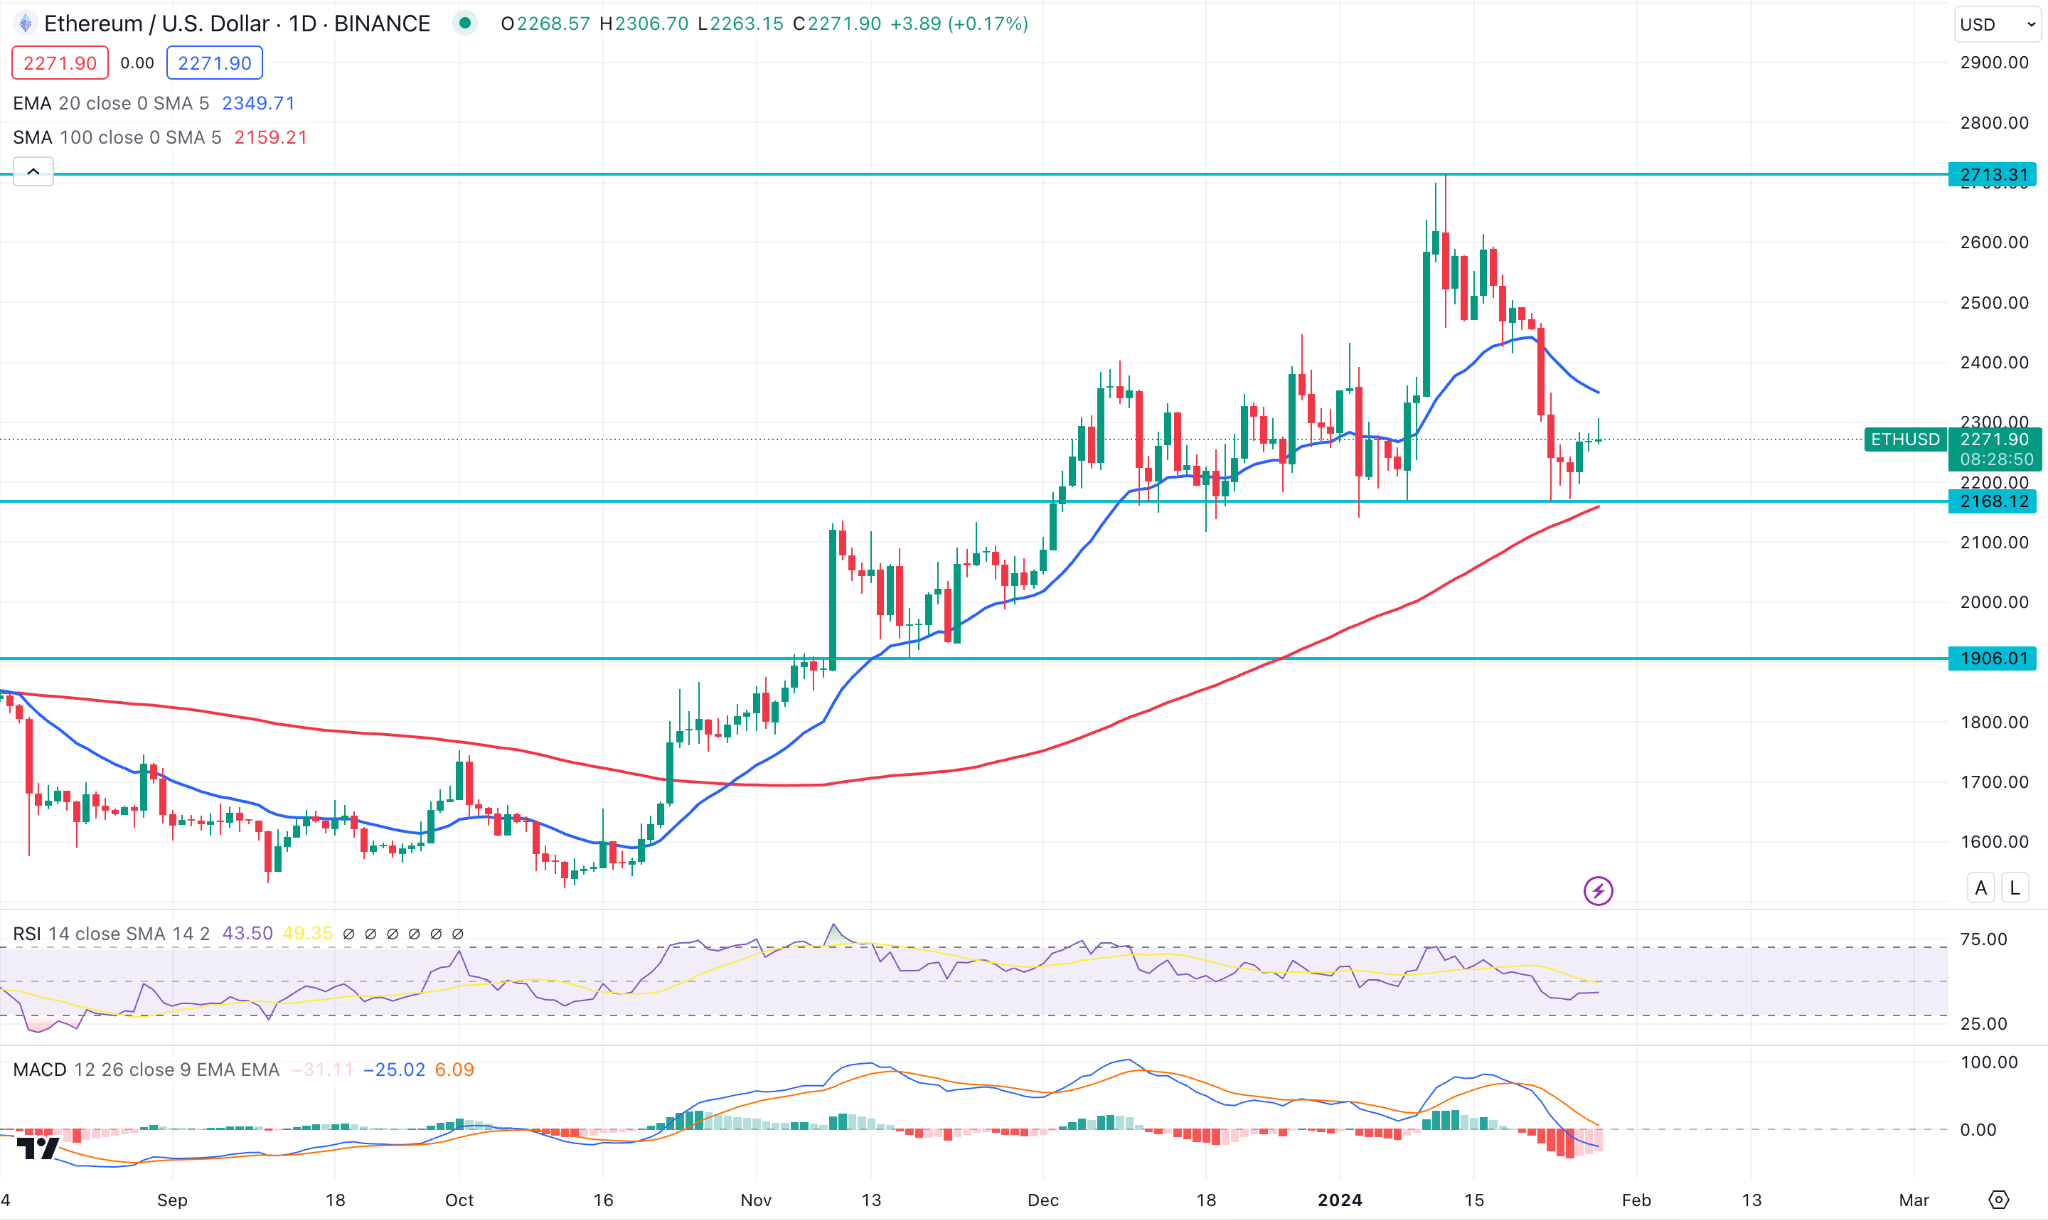
ETHUSD closed bearish in the previous week, supporting the short-term bearish pressure in the market.
In the daily chart, the 100-day SMA is still intact although the 14-day RSI moved below the neutral 50.00 line. In this structure, a bearish continuation might come after breaking below the 2168.12 support level.
On the other hand, an immediate buying pressure might come after overcoming the 20 DMA level.
Tesla Stock (TSLA)
Fundamental Perspective
The value of TSLA stock experienced an appreciation in 2023. However, a concern arises as the net income dropped by 45% due to a strategic focus on reducing prices. Consequently, profit expectations have decreased significantly by 60% since October 2022. The precipitous decline in the stock's value, culminated in its closure below $183. These advancements are expected to maintain Tesla stock under pressure over the coming days.
Compared to 2023, Tesla anticipates a deceleration in the volume growth rate in 2024. Furthermore, the organization foresees difficulties in accelerating manufacturing for the more affordable electric vehicle scheduled to enter production in the late stages of 2025.
Technical Perspective
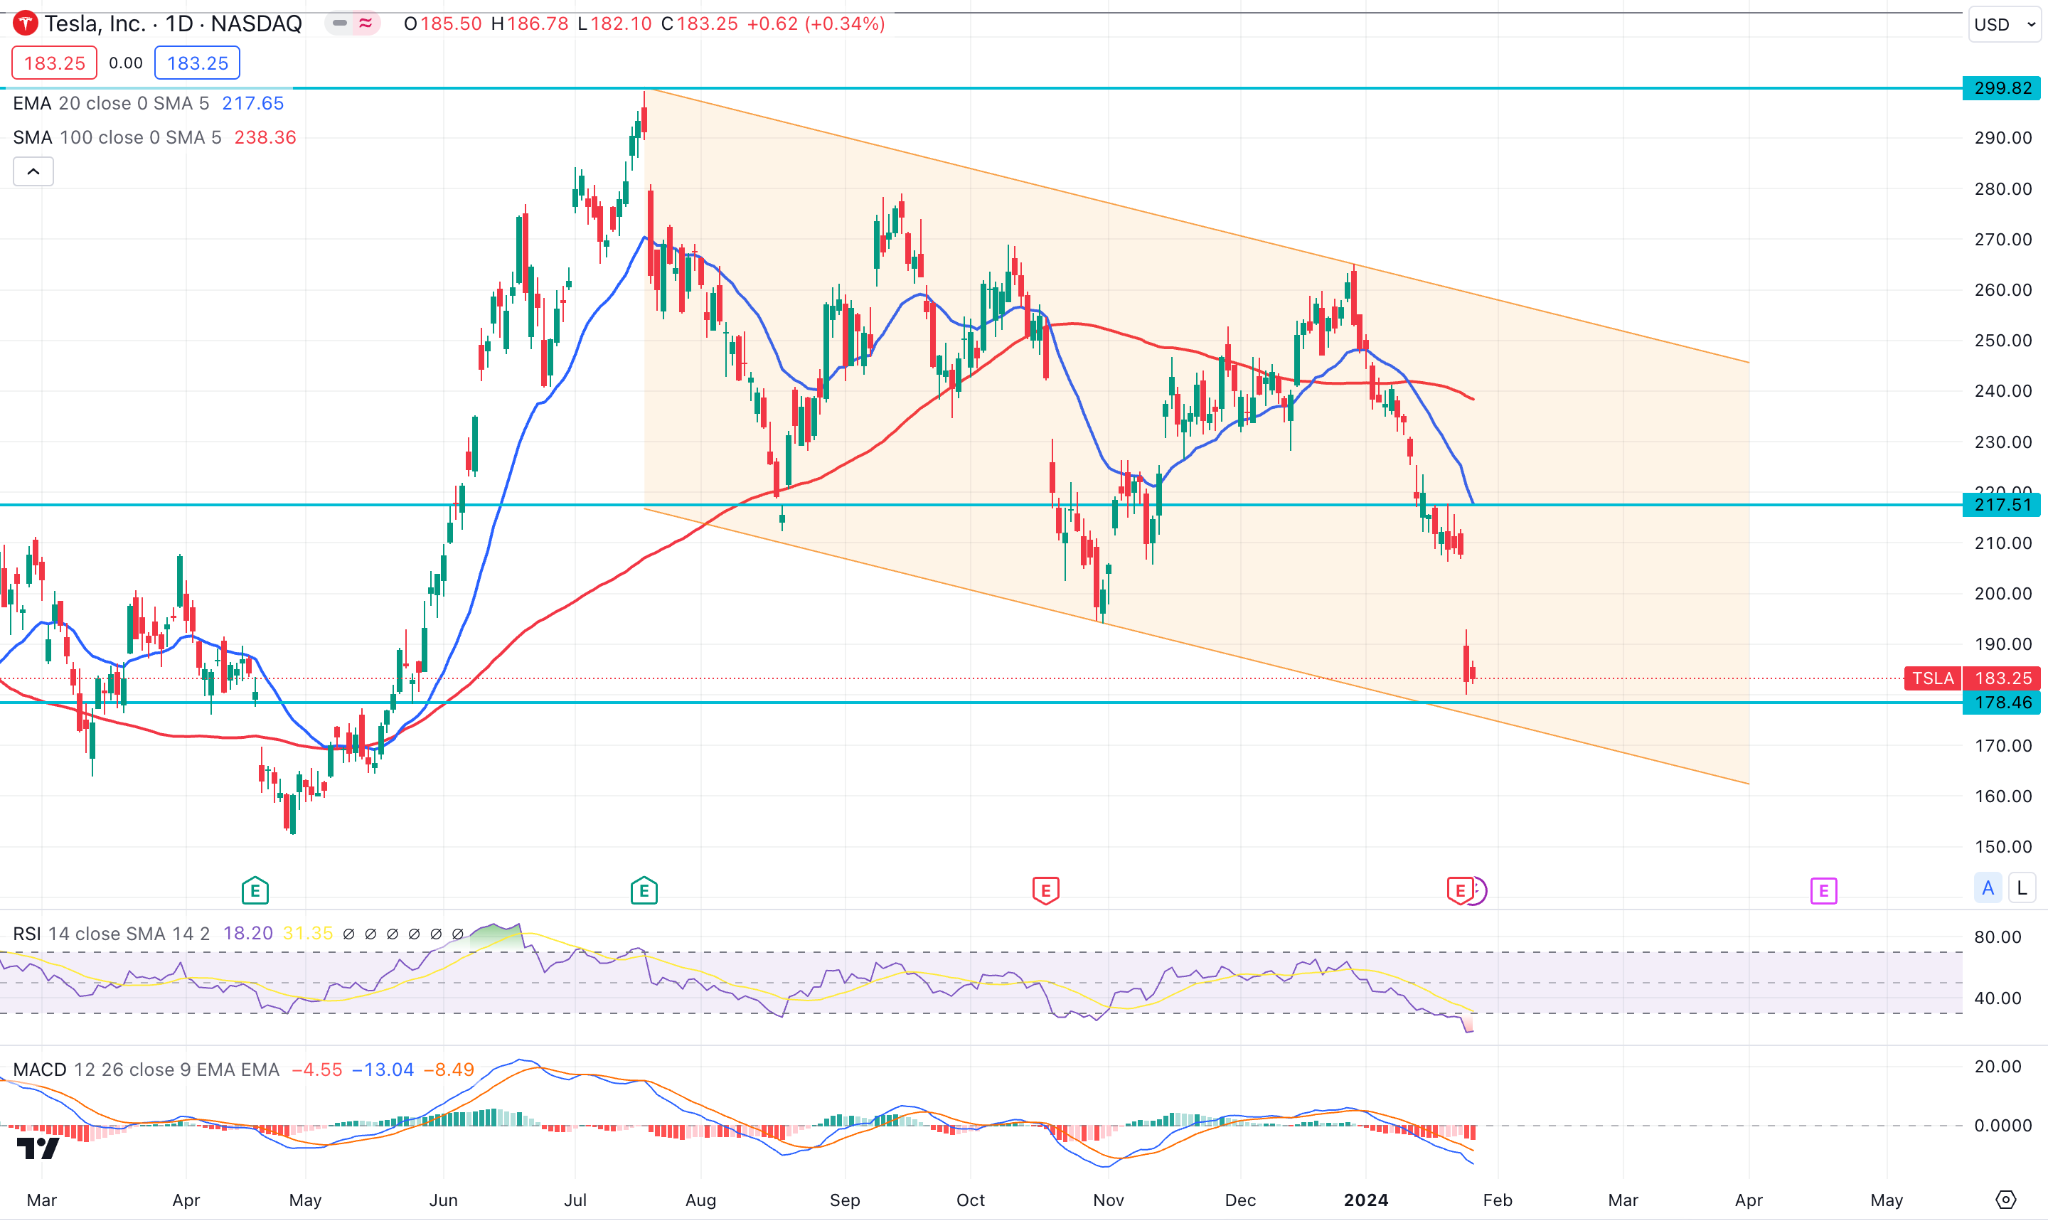
Tesla Stock (TSLA) crashed 10% in a single day, followed by the downbeat yearly forecast. However, the most recent selling pressure took the price at the descending channel support with an oversold RSI.
In this structure, a corrective bullish pressure might come in the coming days but a daily close below the 178.00 level could extend the loss towards the 140.00 level.
Gold (XAUUSD)
Fundamental Perspective
The XAUUSD price remained non-volatile in recent trading sessions, maintaining a relatively stable position for the past two weeks. The prices have exhibited variability in nature, lacking any observable pattern.
The most recent GDP report indicates strong economic growth, which supports policymakers in maintaining a hawkish approach. However, it is not premature to rule out the possibility of a dovish resolution.
In the upcoming FOMC meeting, traders would be wise to anticipate a possible precipitous decrease in bond yields, which could consequently invigorate gold prices.
On the other hand, yields might recover if the chair of the FOMC defies market anticipations for significant reductions in interest rates and postpones the timing of the initial cut. This would result in a strengthening of the U.S. currency and a downward impact on precious metals.
Technical Perspective
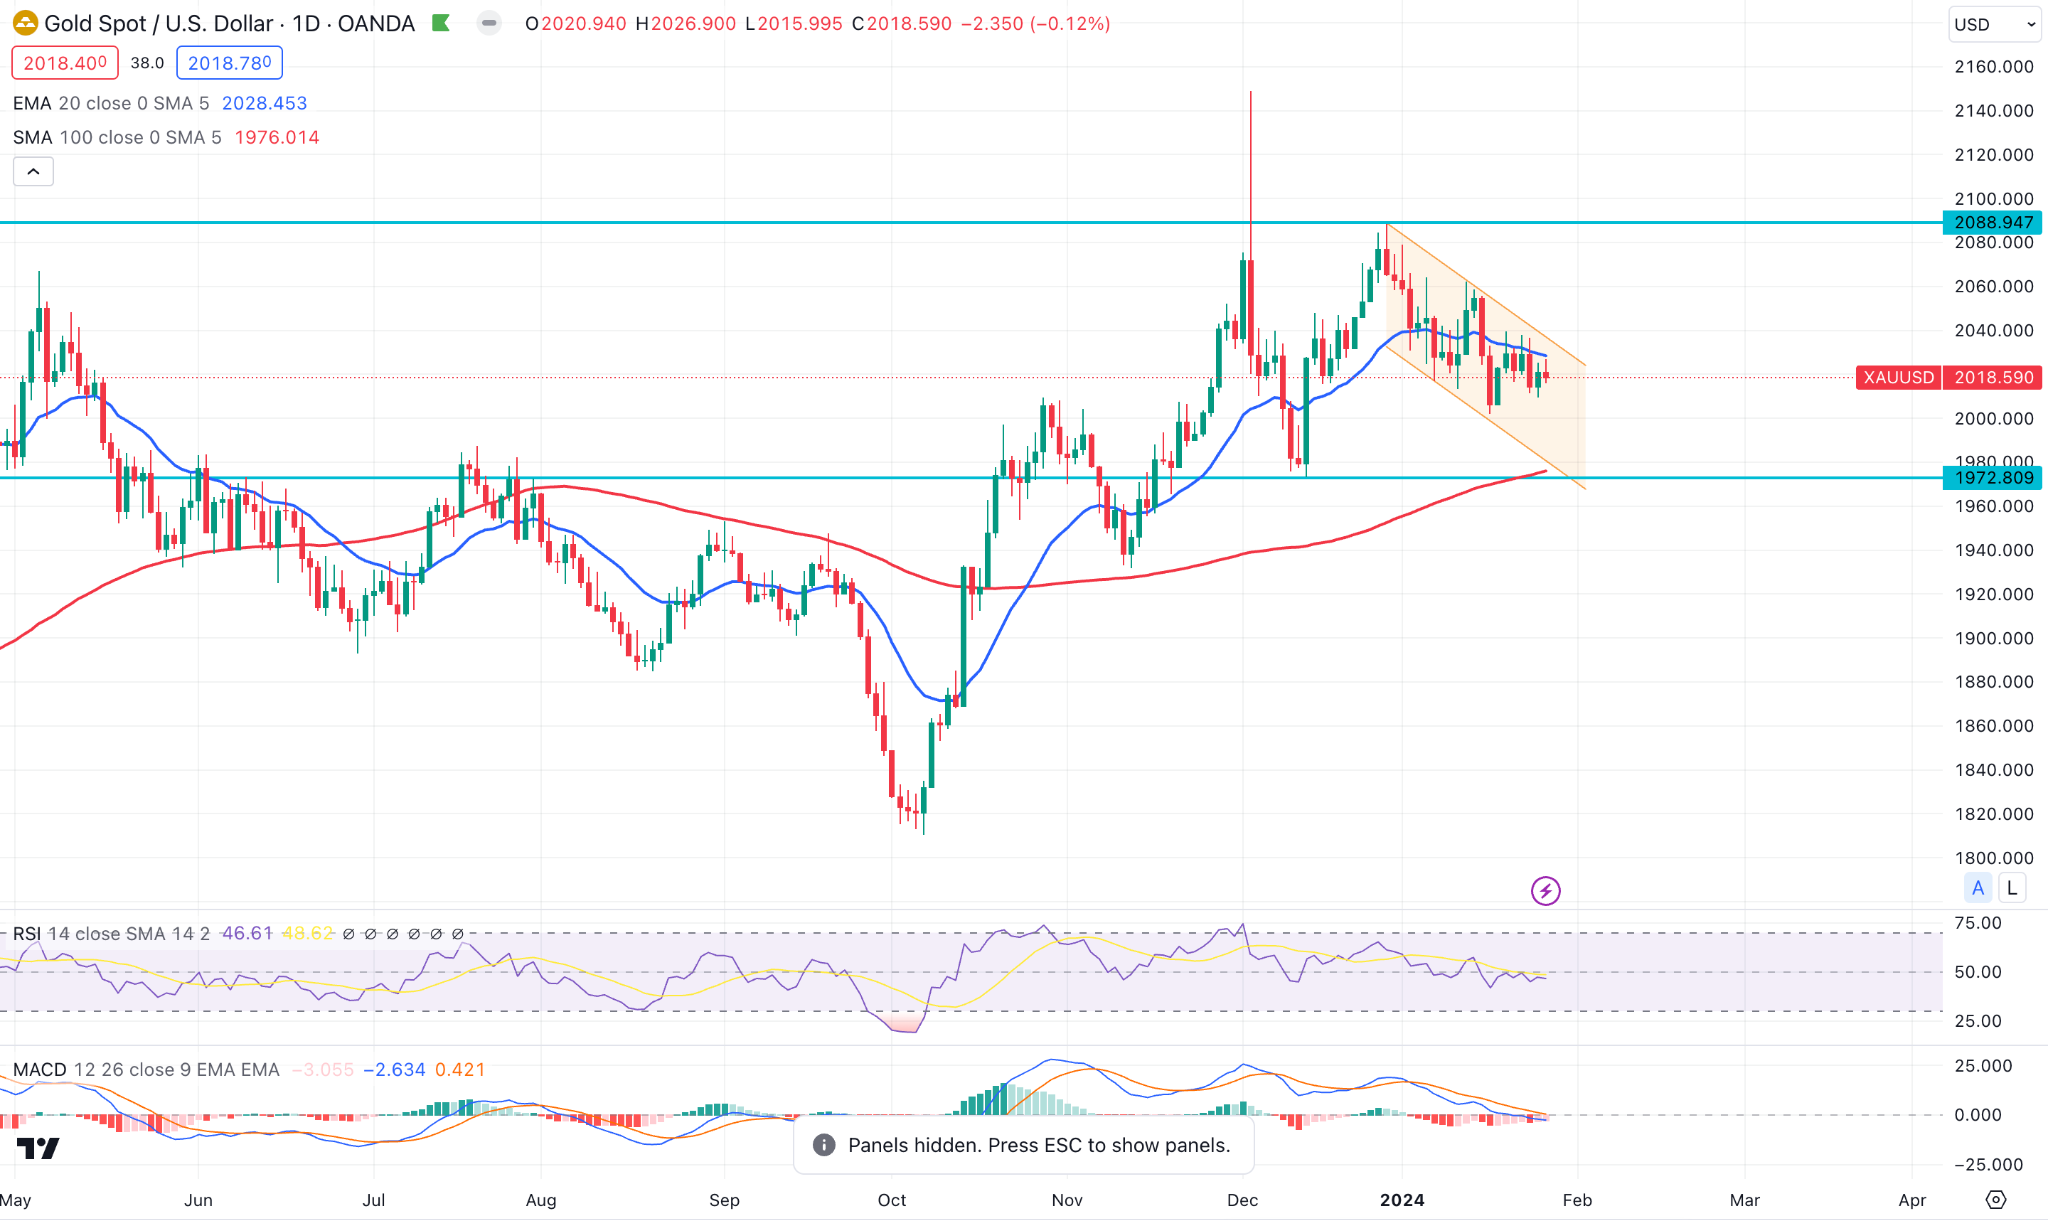
XAUUSD daily price trades within a descending channel, where the primary aim for this week is to look for a range continuation toward the 100-day SMA support.
On the other hand, the long-term market trend is still bullish, which could grab enough buy orders after forming a sell-side liquidity sweep from the 1972.00 area. However, an immediate buying pressure is possible, which might come after a valid channel breakout.
WTI Crude Oil (USOUSD)
Fundamental Perspective
Several factors contributed to the recent bull market in crude oil, including robust economic growth in the United States. Moreover, Chinese stimulus that bolstered demand forecasts, and apprehensions regarding supply disruptions in the Middle East worked as a bullish factor for black metals.
According to official data, U.S. crude inventories decreased by 9.2 million barrels last week, exceeding market expectations. Furthermore, higher-than-expected growth was observed in the fourth quarter of the United States economy.
The Middle East experienced an escalation of geopolitical tensions throughout the week due to further strikes by U.S. and U.K. forces against Houthi targets in Yemen. This increased apprehension regarding potential disruptions in the crude supply chain of the oil-producing region.
Technical Perspective
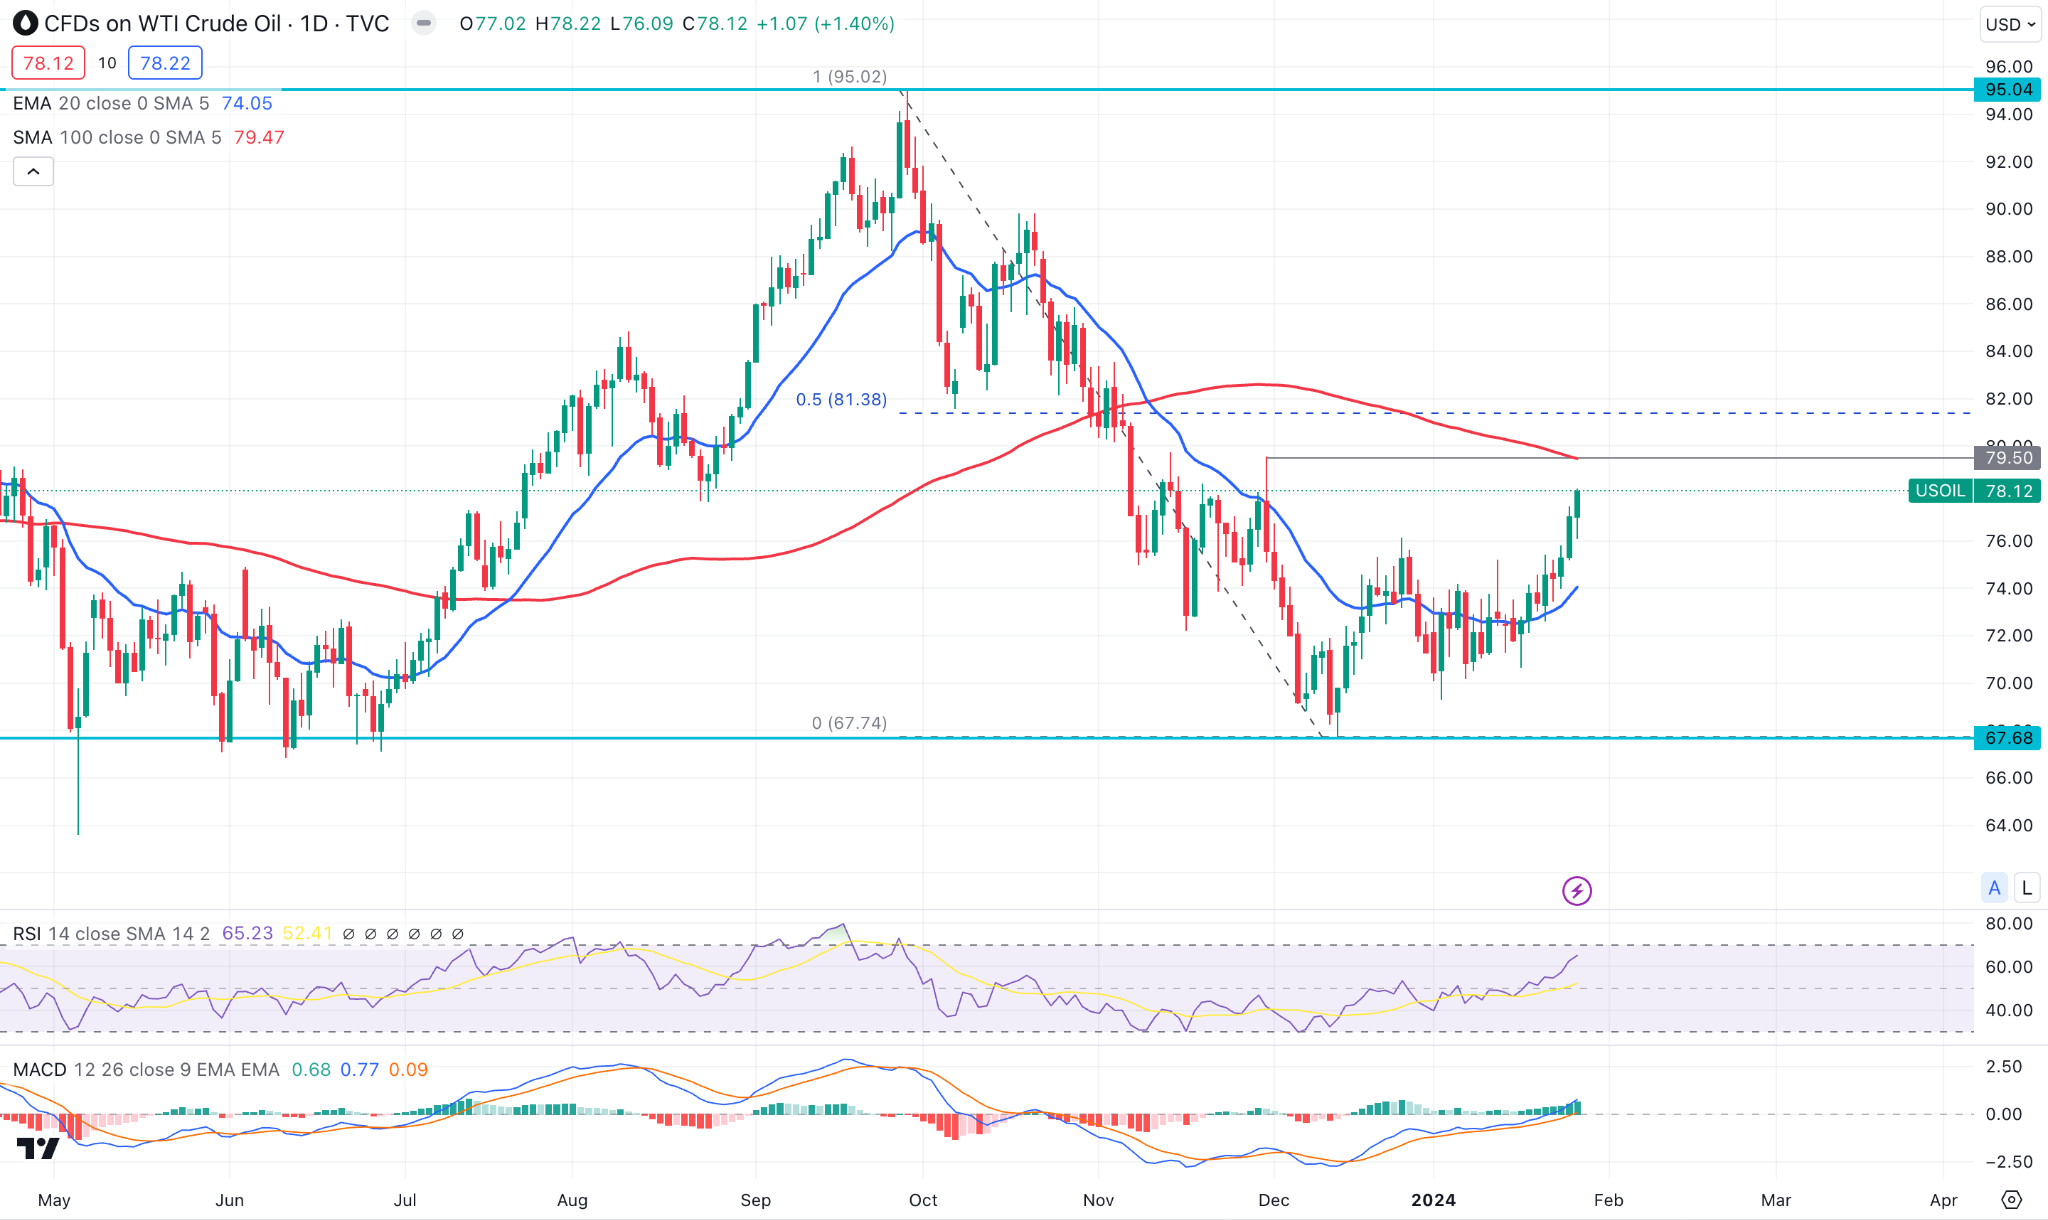
The recent price closed with a bullish range breakout as the latest W1 candle formed a strong upward pressure. The ideal approach in this price structure is to look for a bullish continuation, after intraday corrections.
In the daily chart, an upward continuation might come where the 100-day SMA could be a strong barrier. A daily close below the 74.00 psychological level could lower the price towards the 67.00 area.


