I. Introduction
Definition of CFD trading
CFD trading, or contract for difference trading, is financial trading to speculate on the price movements of various instruments without physical ownership of the underlying asset. In CFD trading, traders enter into a contract with a broker to exchange the difference in the price of an underlying asset between the opening and closing of a trade. CFDs are commonly traded on stocks, indices, commodities, currencies, and cryptocurrencies.
Definition of Gas CFD trading
Gas CFD trading refers to trading contracts for difference (CFDs) that derive their value from the price movements of natural gas. Natural gas is a fossil fuel used primarily for heating and electricity generation. It is also used as a raw material in producing chemicals and other products.
Gas CFD trading allows traders to speculate on the future price movements of natural gas without owning the physical commodity. Traders enter into a contract with a broker to exchange the difference in the price of natural gas between the opening and closing of a trade.
For example, suppose a trader expects the price of natural gas to rise shortly. The trader could enter into a gas CFD trade with a broker, purchasing a certain number of CFDs at the current market price. If natural gas prices rise, the trader could sell the CFDs at a higher price and realize a profit. On the other hand, if the price of natural gas falls, the trader would incur a loss.
Like other CFD trades, gas CFD trading allows traders to use leverage, which can magnify potential profits and losses. Therefore, it is important for traders to have a solid understanding of the risks and to use risk management strategies when trading gas CFDs. Additionally, gas CFD trading can be affected by various factors such as supply and demand, geopolitical events, and weather conditions, making it important for traders to stay informed about market developments.
Importance of understanding different market conditions
Understanding different market conditions is critical for successful trading in any financial market. Different market conditions can create unique trading opportunities, risks, and challenges. By understanding and adapting to different market conditions, traders can increase their chances of success and reduce their risk exposure.
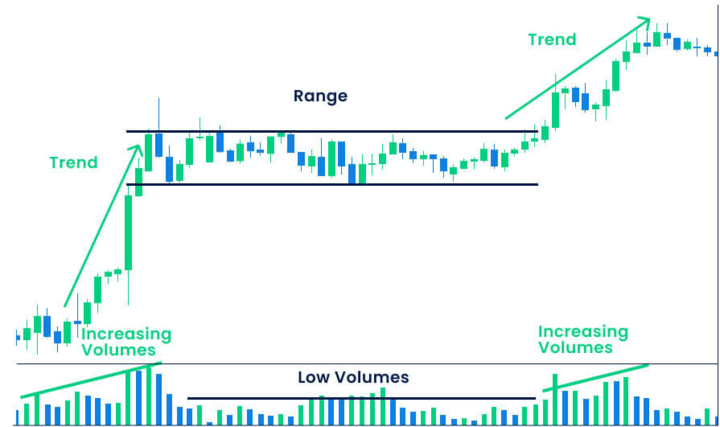
One example of different market conditions is a trending market versus a range-bound market. In a trending market, the price of an asset moves in a clear and persistent direction, such as an uptrend or a downtrend. In this market condition, traders may look to buy or sell based on the direction of the trend. However, in a range-bound market, the price of an asset moves within a range with no clear trend in either direction. In this market condition, traders may look to buy at the bottom of the range and sell at the top.
Another example of different market conditions is a volatile market versus a stable market. In a volatile market, prices can fluctuate rapidly and unpredictably, creating risks for traders caught on the wrong side of a trade. In this market condition, traders may use risk management tools such as stop-loss orders to limit their losses. On the other hand, in a stable market, prices may move more slowly and predictably, providing opportunities for traders to use technical analysis to identify trends and potential trading opportunities.
Overview of gas CFD trading strategies for different market conditions
Gas CFD trading strategies can vary depending on the market conditions present in the natural gas market. Different market conditions can create unique opportunities and risks for gas CFD traders and therefore require different trading strategies to be successful. Here is an overview of gas CFD trading strategies for different market conditions:
Trending market: In a trending market, the price of natural gas moves persistently in one direction, such as an uptrend or a downtrend. In this market condition, traders may use trend-following strategies, such as moving average crossovers or trend line analysis. For example, if the price of natural gas is in an uptrend, a trader may buy gas CFDs on pullbacks to a support level.
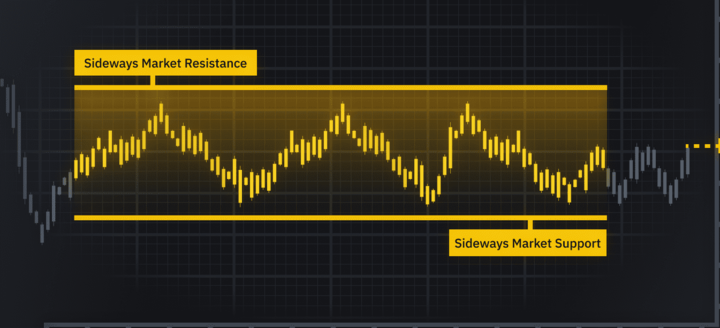
Range-bound market: In a range-bound market, the price of natural gas moves within a range with no clear trend in either direction. In this market condition, traders may use range-trading strategies, such as buying at the bottom of the range and selling at the top. Alternatively, traders may use breakout strategies, waiting for a clear break above or below the range before entering a trade.
Volatile market: In a volatile market, the price of natural gas can fluctuate rapidly and unpredictably. In this market condition, traders may use risk management strategies, such as placing stop-loss orders, to limit their losses. Traders may also use volatility-based trading strategies, such as the Bollinger Bands indicator, which can help identify potential trading opportunities based on the market's volatility.
Stable market: In a stable market, the price of natural gas moves more slowly and predictably. In this market condition, traders may use technical analysis strategies, such as identifying support and resistance levels or chart patterns, to identify potential trading opportunities. Traders may also use fundamental analysis strategies, such as monitoring supply and demand factors or keeping up to date with news events that could affect the price of natural gas.
II. Different Market Conditions in Gas CFD Trading
Different market conditions can create unique opportunities and risks for gas CFD traders. Understanding these market conditions is crucial for traders to adapt their strategies accordingly and increase their chances of success. Here are the four different market conditions that can be encountered in gas CFD trading:
Trending markets
In a trending market, natural gas prices move persistently in one direction, either upward or downward. In this market condition, traders may use trend-following strategies to enter trades in the direction of the trend. For example, a trader may use technical analysis tools such as moving averages or trend lines to identify the trend and then enter a trade when the price breaks above or below a key level. By following the trend, traders can capture larger profits and reduce the risk of being caught on the wrong side of the market.
Ranging markets
In a ranging market, the price of natural gas moves within a range with no clear trend. In this market condition, traders may use range-trading strategies to buy at the bottom of the range and sell at the top. Alternatively, traders may use breakout strategies and wait for the price to break out of the range before entering a trade. Range-trading strategies can be effective in a ranging market because the price tends to move within a predictable range, making it easier to identify support and resistance levels.
Volatile markets
In a volatile market, the price of natural gas can fluctuate rapidly and unpredictably. In this market condition, traders may use volatility-based trading strategies, such as technical analysis tools like Bollinger Bands, to identify potential trading opportunities based on the market's volatility. Traders may also use risk management strategies, such as placing stop-loss orders, to limit losses.
News-driven markets
In a news-driven market, the price of natural gas is influenced by major news events, such as economic reports or geopolitical events. In this market condition, traders may need to adjust their trading strategies based on the news and its potential impact on the price of natural gas. For example, if there is a significant disruption in natural gas supply due to geopolitical events, traders may look to buy gas CFDs in anticipation of higher prices. Alternatively, if a key economic report shows weaker demand for natural gas, traders may sell gas CFDs in anticipation of lower prices.
III. Gas CFD Trading Strategies for Trending Markets
Gas CFD trading in trending markets can be profitable if traders can identify trends and take advantage of the directional price movement. Here are some gas CFD trading strategies for trending markets.
Trend-following strategy
A trend-following strategy is a popular gas CFD trading strategy in trending markets. This strategy involves identifying the trend direction and then entering trades in the direction of the trend. Once the trend is identified, traders can use technical indicators or chart patterns to find trading opportunities that align with the trend.
How to identify trends
To identify trends in gas CFD trading, traders can use technical indicators such as moving averages, trend lines, or the Average Directional Index (ADX). Moving averages can help identify the overall direction of the trend, while trend lines can help confirm the trend and provide potential entry and exit points. The ADX can also measure the trend's strength and identify potential trading opportunities.
Here is an example chart of natural gas prices with a 20-day moving average and a trend line to help identify the trend:
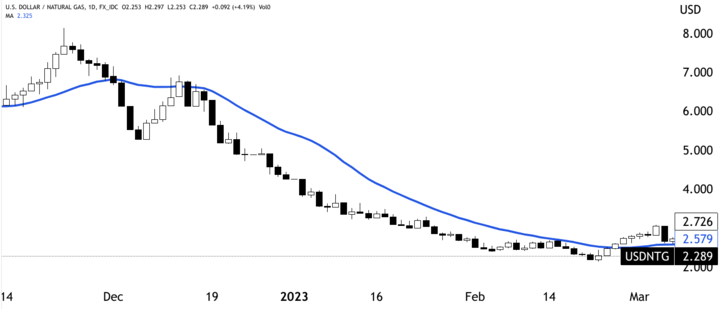
The above chart shows that the price of natural gas is in a downtrend, as the 20-day moving average (blue) slows downwards, and the price is consistently making lower highs and lower lows. The trend line also confirms the downtrend and provides potential entry and exit points.
How to enter and exit trades
Traders can enter trades in the direction of the trend by waiting for a pullback or retracement to a support or resistance level. Traders can also use breakout strategies, entering a trade when the price breaks above or below a key level of support or resistance. Stop-loss orders can be used to manage risk and protect against potential losses if the price reverses against the trend.
How to manage risk
To manage risk in trend-following strategies, traders can use stop-loss orders to limit their losses if the price moves against the trend. Traders can also use position sizing to manage their risk, ensuring their trade size is appropriate based on their account balance and risk tolerance.
How to profit from trends
In trend-following strategies, traders aim to capture the majority of the directional price movement in the trend. This can result in larger profits if the trend continues and larger losses if the trend reverses. To increase the chances of profitability, traders can use technical indicators to confirm the trend and use sound risk management principles to limit their losses.
Overall, a trend-following strategy can be an effective gas CFD trading strategy in trending markets if traders can identify the trend and take advantage of the directional price movement. By using technical indicators and sound risk management principles, traders can increase their chances of success in trend-following strategies.
Breakout trading strategy
Gas CFD trading in trending markets can be profitable if traders can identify breakouts and take advantage of the momentum in price movement. Here are some gas CFD trading strategies for trending markets:
A breakout strategy involves entering trades when the price breaks above or below a key level of support or resistance. This strategy aims to capture the momentum in price movement that often occurs after a breakout.
How to identify breakouts
To identify breakouts in gas CFD trading, traders can use technical indicators such as Bollinger Bands, moving averages, or chart patterns. Bollinger Bands can help identify overbought or oversold conditions while moving averages can help identify the overall direction of the trend. Chart patterns such as triangles or rectangles can also signal potential breakouts.
Here is an example chart of natural gas prices with Bollinger Bands to help identify potential breakouts:
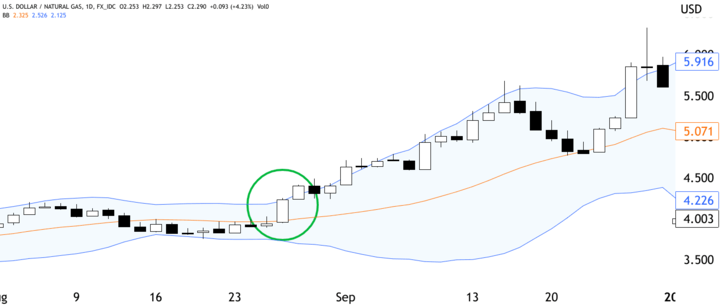
The above chart shows that natural gas prices are in an uptrend, as the price is consistently making higher highs and higher lows. The Bollinger Bands also show that the price is currently overbought, which can indicate a potential breakout. The triangle chart pattern can also signal a potential breakout if the price breaks above the upper trend line.
How to enter and exit trades
Traders can enter trades when the price breaks above or below a key level of support or resistance. Stop-loss orders can be used to manage risk and protect against potential losses if the price reverses after the breakout. Traders can also use profit targets to take profits when the price reaches a predetermined level.
How to manage risk
To manage risk in breakout trading strategies, traders can use stop-loss orders to limit their losses if the price moves against the breakout. Traders can also use position sizing to manage their risk, ensuring their trade size is appropriate based on their account balance and risk tolerance.
How to profit from breakouts
In breakout trading strategies, traders aim to capture the momentum in price movement that often occurs after a breakout. This can result in larger profits if the breakout continues and larger losses if the breakout fails. To increase the chances of profitability, traders can use technical indicators to confirm the breakout and use sound risk management principles to limit their losses.
A breakout trading strategy can be an effective gas CFD trading strategy in trending markets if traders can identify potential breakouts and take advantage of the momentum in price movement. By using technical indicators and sound risk management principles, traders can increase their chances of success with breakout trading strategies.
Moving average crossover strategy
Gas CFD trading in trending markets can be profitable if traders can identify the direction of the trend and take advantage of the momentum in price movement. Here are some gas CFD trading strategies for trending markets:
The moving average crossover strategy is a popular gas CFD trading strategy that uses two moving averages to identify the direction of the trend and enter trades when the shorter-term moving average crosses above or below the longer-term moving average.
How to use moving averages
To use moving averages in gas CFD trading, traders typically use a shorter-term moving average, such as a 20-day moving average, and a longer-term moving average, such as a 50-day moving average. The shorter-term moving average responds faster to changes in price movement, while the longer-term moving average provides a smoother trend line.
Here is an example chart of natural gas prices with a 20-day moving average and a 50-day moving average to help identify potential crossovers:
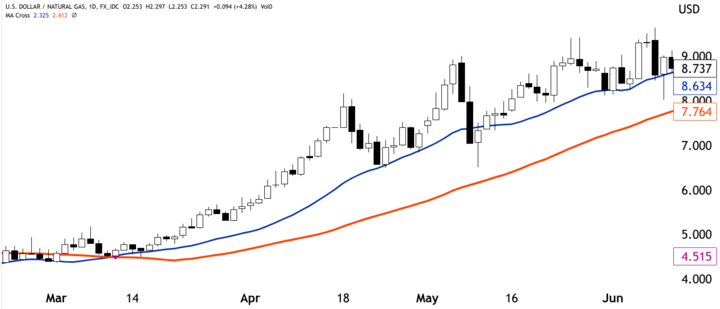
The above chart shows that natural gas prices are in an uptrend, as the 20-day moving average (blue) is above the 50-day moving average (orange). A potential trade entry signal could occur if the 20-day moving average crosses above the 50-day moving average.
How to enter and exit trades
Traders can enter trades when the shorter-term moving average crosses above or below the longer-term moving average, indicating a potential change in trend direction. Stop-loss orders can be used to manage risk and protect against potential losses if the price reverses against the trade. Traders can also use profit targets to take profits when the price reaches a predetermined level.
How to manage risk
To manage risk in moving average crossover strategies, traders can use stop-loss orders to limit their losses if the price moves against the trade. Traders can also use position sizing to manage their risk, ensuring that their trade size is appropriate based on their account balance and risk tolerance.
How to profit from moving average crossovers
In moving average crossover strategies, traders aim to capture the momentum in price movement that often occurs after a crossover. This can result in larger profits if the trend continues and larger losses if the trend reverses. To increase the chances of profitability, traders can use sound risk management principles and combine moving average crossovers with other technical indicators to confirm the trend direction.
Overall, a moving average crossover strategy can be an effective gas CFD trading strategy in trending markets if traders can identify potential crossovers and take advantage of the momentum in price movement. By using sound risk management principles and combining moving average crossovers with other technical indicators, traders can increase their chances of success with moving average crossover strategies.
Examples of trending market scenarios and how to apply these strategies
Here are some examples of trending market scenarios and how to apply the relevant trading strategies:
The upward trend in gas CFD prices:
● Trend-following strategy: identify the upward trend by looking for a series of higher highs and higher lows. Enter long positions (buy) when the price pulls back to the trendline or moving average. Exit when the trend changes or the price breaks below the trendline or moving average.
● Breakout trading strategy: Identify resistance levels that the price is struggling to break through. Enter long positions when the price breaks through the resistance level with high volume. Exit when the price shows signs of reversal or reaches the next resistance level.
● Moving average crossover strategy: identify the short-term moving average crossing above the longer-term moving average. Enter long positions when this crossover occurs. Exit when the moving averages start to converge or the trend changes.
The downward trend in gas CFD prices:
● Trend-following strategy: Identify the downward trend by looking for a series of lower highs and lower lows. Enter short positions (sell) when the price rallies to the trendline or moving average. Exit when the trend changes or the price breaks above the trendline or moving average.
● Breakout trading strategy: identify support levels that the price is struggling to break through. Enter short positions when the price breaks through the support level with high volume. Exit when the price shows signs of reversal or reaches the next support level.
● Moving average crossover strategy: identify the short-term moving average crossing below the longer-term moving average. Enter short positions when this crossover occurs. Exit when the moving averages start to converge or the trend changes.
The sideways trend in gas CFD prices:
● Range trading strategy: identify the support and resistance levels the price oscillates between. Enter long positions at the support level and short positions at the resistance level. Exit when the price breaks out of the range.
● Support and resistance trading strategy: identify the support and resistance levels tested multiple times. Enter long positions at the support level and short positions at the resistance level. Exit when the price breaks through the support or resistance level.
● Mean reversion trading strategy: identify the price deviations from the moving average or other indicators. Enter long positions when the price is below the moving average and short positions when the price is above the moving average. Exit when the price returns to the moving average.
IV. Gas CFD Trading Strategies for Ranging Markets
Gas CFD trading in ranging markets can be challenging, as prices oscillate between support and resistance levels without a clear direction. However, traders can still profit from these market conditions using a range trading strategy. Here are some gas CFD trading strategies for ranging markets:
Range trading strategy
The range trading strategy involves identifying key support and resistance levels and entering trades when the price approaches these levels. In a ranging market, traders can use technical analysis to identify these levels, such as horizontal trend lines or moving averages.
How to identify ranges
To identify ranges in gas CFD trading, traders can use technical analysis tools such as trend lines or moving averages to identify key support and resistance levels. A range is formed when the price bounces between these levels without breaking out.
Here is an example chart of natural gas prices in a range, with key support and resistance levels marked with horizontal trend lines:
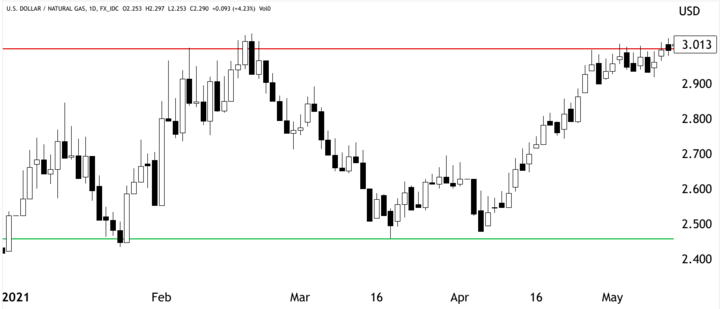
The above chart shows that natural gas prices are trading between approximately $2.450 and $3.000. Traders can use this information to identify potential trade entries and exits.
How to enter and exit trades
Traders can enter trades when the price approaches a key support or resistance level with the expectation that the price will bounce off the level and remain within the range. Stop-loss orders can be used to manage risk and protect against potential losses if the price breaks out of the range. Traders can also use profit targets to take profits when the price reaches the opposite end of the range.
How to manage risk
To manage risk in range trading strategies, traders can use stop-loss orders to limit their losses if the price breaks out of the range. Traders can also use position sizing to manage their risk, ensuring their trade size is appropriate based on their account balance and risk tolerance.
How to profit from ranges
In range trading strategies, traders aim to profit from the price bouncing between key support and resistance levels. This can result in smaller profits than trending markets but with lower risk. To increase the chances of profitability, traders can use sound risk management principles and combine range trading strategies with other technical indicators to confirm the range and potential trade entries and exits.
Overall, a range trading strategy can be an effective gas CFD trading strategy in ranging markets if traders can identify key support and resistance levels and take advantage of the price bouncing between these levels. By using sound risk management principles and combining range trading strategies with other technical indicators, traders can increase their chances of success with range trading strategies.
Support and resistance trading strategy
Another effective gas CFD trading strategy for ranging markets is the support and resistance trading strategy. This strategy involves identifying key support and resistance levels and entering trades when the price approaches these levels. Here are the steps for implementing a support and resistance trading strategy in gas CFD trading:
How to identify support and resistance levels
Support and resistance levels can be identified using technical analysis tools such as trend lines, moving averages, and pivot points. Support levels are price levels where buying pressure exceeds selling pressure, causing the price to bounce back up. On the other hand, resistance levels are price levels where selling pressure exceeds buying pressure, causing the price to bounce back down.
Here is an example chart of natural gas prices with key support and resistance levels marked:
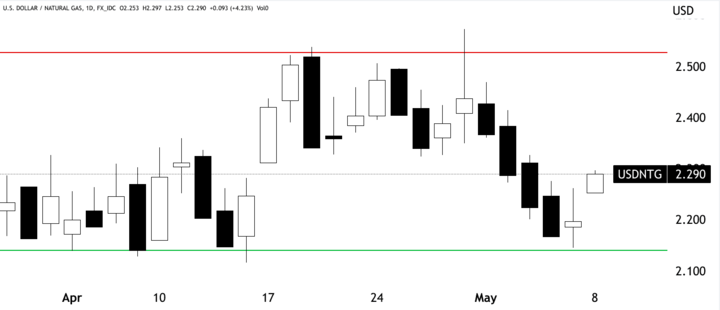
The above chart shows that natural gas prices are trading between approximately $2.141 and $2.527. Traders can use this information to identify potential trade entries and exits.
How to enter and exit trades
Traders can enter trades when the price approaches a key support or resistance level with the expectation that the price will bounce off the level and remain within the range. Stop-loss orders can be used to manage risk and protect against potential losses if the price breaks out of the range. Traders can also use profit targets to take profits when the price reaches the opposite end of the range.
How to manage risk
To manage risk in support and resistance trading strategies, traders can use stop-loss orders to limit their losses if the price breaks out of the range. Traders can also use position sizing to manage their risk, ensuring their trade size is appropriate based on their account balance and risk tolerance.
How to profit from support and resistance levels
In support and resistance trading strategies, traders aim to profit from the price bouncing off key support and resistance levels within the range. This can result in smaller profits than trending markets but with lower risk. To increase the chances of profitability, traders can use sound risk management principles and combine support and resistance trading strategies with other technical indicators to confirm the range and potential trade entries and exits.
Overall, the support and resistance trading strategy can be an effective gas CFD trading strategy in ranging markets if traders can identify key support and resistance levels and take advantage of the price bouncing off these levels. By using sound risk management principles and combining support and resistance trading strategies with other technical indicators, traders can increase their chances of success with support and resistance trading strategies.
Mean reversion trading strategy
Another effective gas CFD trading strategy for ranging markets is the mean reversion trading strategy. This strategy involves identifying periods when the price deviates significantly from its historical average and entering trades with the expectation that the price will revert to its mean. Here are the steps for implementing a mean reversion trading strategy in gas CFD trading:
How to identify mean reversion opportunities
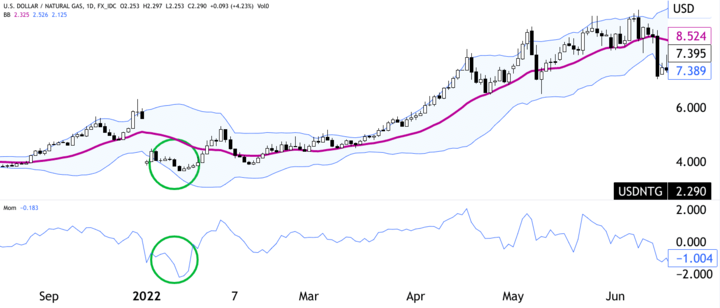
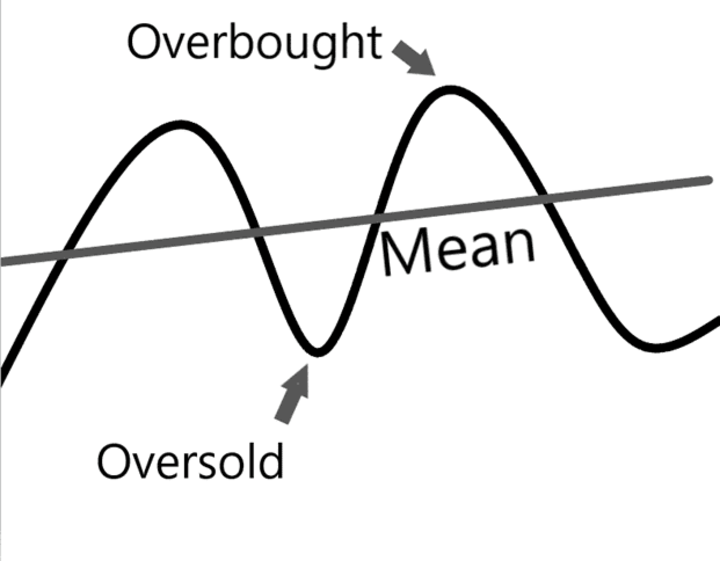
Mean reversion opportunities can be identified using technical analysis tools such as moving averages and standard deviations. Traders can look for periods when the price moves significantly from its historical average, indicating an oversold or overbought market condition. Mean reversion traders can use Bollinger Bands, a technical indicator that uses a moving average with upper and lower bands based on the standard deviation of prices to identify potential trade entries.
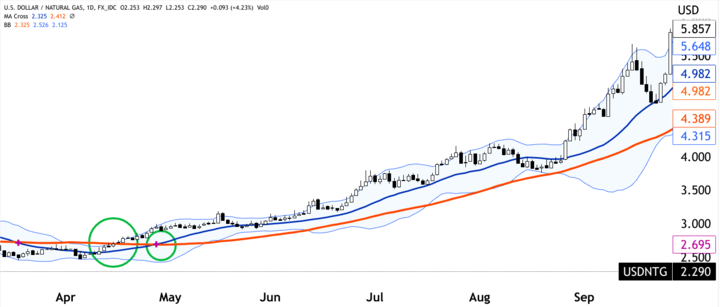
Here is an example chart of natural gas prices with Bollinger Bands marked:
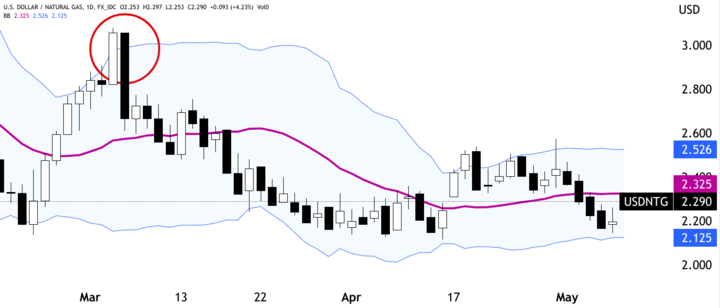
The above chart shows that natural gas prices move outside the Bollinger Bands, indicating potential mean reversion opportunities.
How to enter and exit trades
Traders can enter trades when the price moves outside the Bollinger Bands, indicating a potential mean reversion opportunity. The trader can enter a long position when the price touches the lower band and exit the position when the price reaches the moving average or the upper band. Alternatively, the trader can enter a short position when the price touches the upper band and exit when the price reaches the moving average or the lower band.
How to manage risk
To manage risk in mean reversion trading strategies, traders can use stop-loss orders to limit their losses if the price continues to move away from the mean. Traders can also use position sizing to manage their risk, ensuring their trade size is appropriate based on their account balance and risk tolerance.
How to profit from mean reversion
In mean reversion trading strategies, traders aim to profit from the price reverting to its mean after moving outside the Bollinger Bands. This can result in smaller profits than trending markets but with lower risk. To increase the chances of profitability, traders can use sound risk management principles and combine mean reversion trading strategies with other technical indicators to confirm the trend and potential trade entries and exits.
Overall, the mean reversion trading strategy can be an effective gas CFD trading strategy in ranging markets if traders can identify and take advantage of potential mean reversion opportunities. By using sound risk management principles and combining mean reversion trading strategies with other technical indicators, traders can increase their chances of success with mean reversion trading strategies.
Examples of varying market scenarios and how to apply these strategies
Here are some examples of varying market scenarios and how to apply the strategies, discussed earlier:
Range trading strategy:
Let's say the gas price has been trading within a range of $2.50 to $2.70 for several weeks. A range trader would look to buy near the lower end of the range and sell near the upper end. They would set their stop-loss just outside the range in case of a breakout.
Support and resistance trading strategies:
Suppose the gas price has been bouncing between a support level of $2.60 and a resistance level of $2.80. A support and resistance trader would look to buy near the support level and sell near the resistance level. They would set their stop loss just below the support level or above the resistance level.
Mean reversion trading strategy:
Imagine that the price of gas has been trading in a range between $2.50 and $2.70 but has recently spiked up to $2.90. A mean reversion trader would look to sell at the high price and wait for the price to revert to the range, where they would buy again. They would set their stop loss just above the high price in case the price keeps increasing.
V. Gas CFD Trading Strategies for Volatile Markets
Volatility breakout trading strategy
Gas CFD trading in volatile markets can be challenging, but the volatility breakout trading strategy is useful for traders to capitalize on sudden price movements. In this strategy, traders look for periods of high volatility and aim to enter trades when the price breaks out of its trading range. Here's a breakdown of how to implement a volatility breakout trading strategy in gas CFD trading:
How to identify volatility breakouts
Traders can use technical analysis tools like Bollinger Bands, moving averages, and volatility indicators to identify periods of high volatility. When the market is in high volatility, the price can move rapidly in one direction, creating a breakout from the current trading range. Traders can use a combination of technical indicators to confirm that the market is experiencing high volatility.
Here is an example chart of natural gas prices with Bollinger Bands and the Average True Range (ATR) indicator:
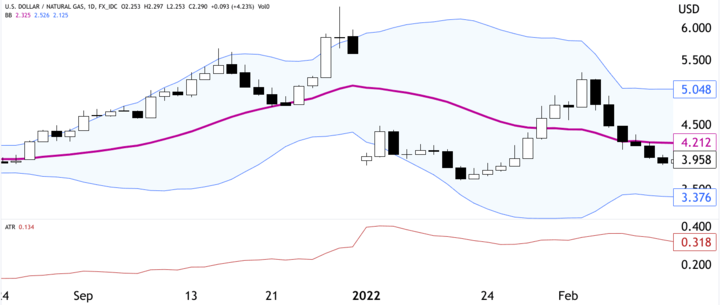
The above chart shows that natural gas prices experience high volatility when the Bollinger Bands expand and the ATR indicator spikes.
How to enter and exit trades
Traders can enter trades when the price breaks out of its trading range, indicated by the upper or lower Bollinger Bands. Traders can use limit orders to enter trades at a predetermined price or market orders to enter trades at the current market price. When exiting trades, traders can use a trailing stop-loss to lock in profits and limit losses.
How to manage risk
To manage risk in volatility breakout trading strategies, traders can use stop-loss orders to limit their losses if the price moves against them. Traders can also use position sizing to manage their risk, ensuring that their trade size is appropriate based on their account balance and risk tolerance.
How to profit from volatility breakouts
In volatility breakout trading strategies, traders aim to profit from the sudden price movements that occur during periods of high volatility. These price movements can result in significant profits for traders who can enter trades at the right time. To increase the chances of profitability, traders can use sound risk management principles and combine volatility breakout trading strategies with other technical indicators to confirm the trend and potential trade entries and exits.
Overall, the volatility breakout trading strategy can be an effective gas CFD trading strategy in volatile markets if traders can identify potential volatility breakouts and take advantage of them. By using sound risk management principles and combining volatility breakout trading strategies with other technical indicators, traders can increase their chances of success in volatile markets.
Momentum trading strategy
Momentum trading is a popular strategy for volatile markets, aiming to capitalize on sudden price movements. This strategy involves buying an asset when it is gaining momentum and selling it before the momentum slows down or reverses.
Here are the steps to implement a momentum trading strategy in gas CFD trading:
How to identify momentum opportunities
Look for gas CFDs that have experienced sudden and significant price movements. This could be due to unexpected news, market events, or other factors that have created volatility in the market.
How to enter and exit trades
Once a momentum opportunity has been identified, enter a long or short position depending on the direction of the momentum. For example, if gas prices have suddenly surged, enter a long position to ride the momentum.
Exit the trade once the momentum begins to slow down or reverse. This may be indicated by a change in the price trend or by technical indicators such as moving averages.
How to manage risk
As with any trading strategy, it is important to set stop-losses to manage risk. Set a stop-loss order at a level that will limit potential losses if the momentum reverses.
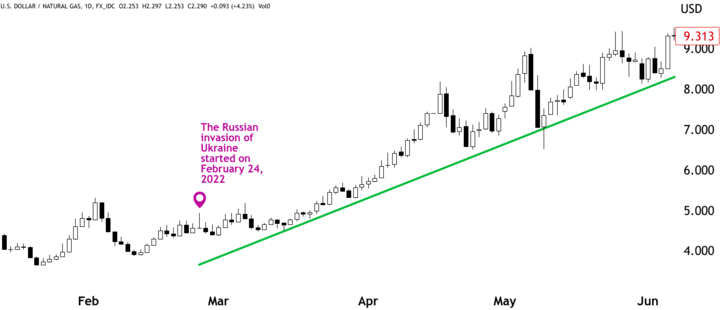
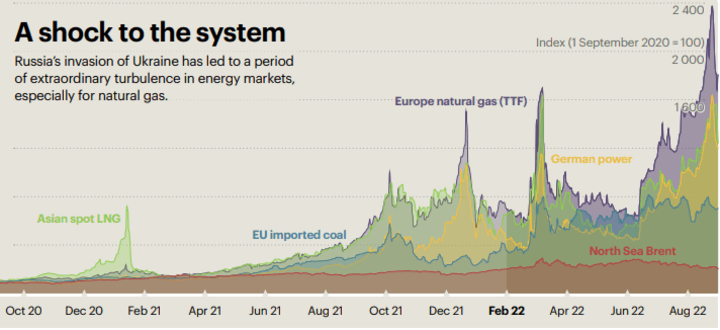
Let's say that gas prices suddenly increase due to a potential supply disruption (Russia-Ukraine conflict). A momentum trading strategy trader would enter a long position on a gas CFD when the momentum was identified. They would set a stop-loss order at a level that limits their potential losses if the momentum reverses. They would then exit the trade once the momentum begins to slow down, perhaps by using technical indicators such as moving averages to identify the change in trend. By following this strategy, the trader can potentially profit from the sudden increase in gas prices while minimizing their risk.
How to profit from momentum
To profit from a momentum trading strategy in gas CFD trading, a trader would aim to capture the gains from the price movement while minimizing their risk. Here are some ways a trader could potentially profit from momentum:
Riding the trend: A trader can aim to ride the momentum by entering a long position when the gas CFD is gaining momentum and exiting the trade before the momentum slows down or reverses. This can potentially result in gains if the price continues to move in the same direction.
Pyramiding: Pyramiding is a strategy where a trader adds to their position as momentum continues to build. This can amplify the gains from a momentum trade but also increases the risk.
Scaling out: Scaling out is a strategy where a trader gradually exits their position as the momentum slows down or reverses. This can potentially lock in profits while minimizing losses.
Using trailing stop-loss orders: Trailing stop-loss orders can help a trader lock in profits while allowing for potential gains if the momentum continues. The stop-loss order is adjusted as the price moves in the trader's favor, allowing for a potentially larger profit if the momentum continues.
News trading strategy
News trading is a popular strategy in gas CFD trading for volatile markets, as news events can cause sudden and significant price movements. Here are some key steps for implementing a news trading strategy:
How to identify news events
Traders should stay up-to-date with gas market news and events that can impact gas prices, such as production cuts, geopolitical tensions, and weather forecasts. News calendars and online resources can help traders stay informed.
Once a news event occurs, traders should analyze the market reaction. This can include monitoring the gas CFD price action and any related gas futures or related markets that may be impacted.
How to enter and exit trades
Based on the market reaction, traders can enter a long or short position in the gas CFD. A trader may enter a position once a certain threshold or support or resistance level is breached or use a more sophisticated approach, such as order flow analysis or technical analysis, to determine entry points.
Traders should have a clear exit plan based on the expected duration of the news event's impact or the desired profit target. Trailing stop-loss orders or scaling out can be effective exit strategies.
How to manage risk
News events can be volatile, so traders should have a solid risk management plan. This can include using stop-loss orders to limit potential losses or implementing a hedging strategy using correlated assets.
It's important to note that the market reaction to news events can be difficult to predict. Traders should also be aware of the potential for slippage and market gaps during high-impact news events.
How to profit from news events
Profiting from news events in gas CFD trading requires careful analysis and execution of trades. The first step is to identify the news event and assess its potential impact on the gas market. This can be done by monitoring news releases from reliable sources such as Reuters, Bloomberg, or the Energy Information Administration (EIA).
Once the news event has been identified and analyzed, traders can enter trades based on the expected price movement. For example, if the news event is expected to cause a spike in gas prices, traders can enter a long position (buy) to profit from the price increase. Conversely, if the news event is expected to cause a drop in gas prices, traders can enter a short position (sell) to profit from the price decrease.
Suppose there is a news release that indicates a decrease in gas inventories due to cold weather, which is expected to increase demand for gas. Based on this news, a trader enters a long position in gas CFDs. The trader sets a stop-loss order to limit potential losses if the market moves against its position. As predicted, the price of gas increases and the trader closes their position to lock in profits.
Examples of volatile market scenarios and how to apply these strategies
Volatility breakout trading strategy: Let's say there's been a sudden spike in the price of gas due to a geopolitical event or a major supply disruption. This could be an opportunity to use the volatility breakout strategy, which involves waiting for the price to break out of its current range and then entering a trade in the direction of the breakout. Traders could use technical indicators such as Bollinger Bands to help identify when the market is likely to break out.
Momentum trading strategy: In a volatile market, trade opportunities may exist on short-term momentum swings. For example, if gas prices are rapidly rising, traders could look to enter long positions and ride the momentum as long as it lasts. However, it's important to be cautious and have tight stop-loss orders in place, as volatility can work both ways and lead to rapid price reversals.
News trading strategy: A major news event, such as a natural disaster or a political crisis, can cause volatility in the gas market. Traders using a news trading strategy would monitor news feeds and social media to identify potential market-moving events. Once an event occurs, traders quickly enter positions in anticipation of the market reaction. However, it's important to be cautious and not overreact to news, as market sentiment can be fickle and quickly change direction.
VI. Gas CFD Trading Strategies for News-Driven Markets
Fundamental analysis strategy
A fundamental analysis strategy is a trading approach that seeks to analyze and interpret the underlying economic and financial factors that impact the market price of gas. This strategy is based on the idea that gas supply and demand changes can significantly affect its price in the market. Fundamental factors that can influence the gas market include changes in weather patterns, geopolitical tensions, government regulations, and macroeconomic indicators.
How to analyze fundamental factors
A fundamental trader needs to stay updated with relevant economic data and financial news that could impact the gas market. This includes monitoring news related to gas reserves, production, and consumption, as well as relevant macroeconomic indicators like GDP, inflation rates, and interest rates.
Based on economic and financial data analysis, the trader should identify important news events that could impact the gas market. These could include the release of government reports on gas production and inventories, changes in government policies or regulations, and unexpected weather patterns that could affect demand for gas.
After identifying important news events, the trader should analyze their potential impact on the gas market. This could involve analyzing historical data and market trends to gauge the potential effect on gas prices.
How to enter and exit trades
Based on the analysis of market-moving news events, the trader can enter and exit trades by taking long or short positions on gas contracts. For example, if the trader expects an increase in demand for gas due to cold weather patterns, they could take a long position on gas contracts.
How to manage risk
As with any trading strategy, risk management is crucial in fundamental analysis. Traders should use stop-loss orders to limit their losses if the market moves against their position.
Fundamental analysis is an ongoing process, and traders should monitor economic data and financial news regularly to identify new opportunities and adjust their trading strategy accordingly.
How to profit from fundamental analysis
Fundamental analysis is a strategy used to evaluate the intrinsic value of an asset based on economic and financial factors that affect its supply and demand. To profit from fundamental analysis in gas CFD trading, trader need to analyze various factors that influence the price of natural gas, such as:
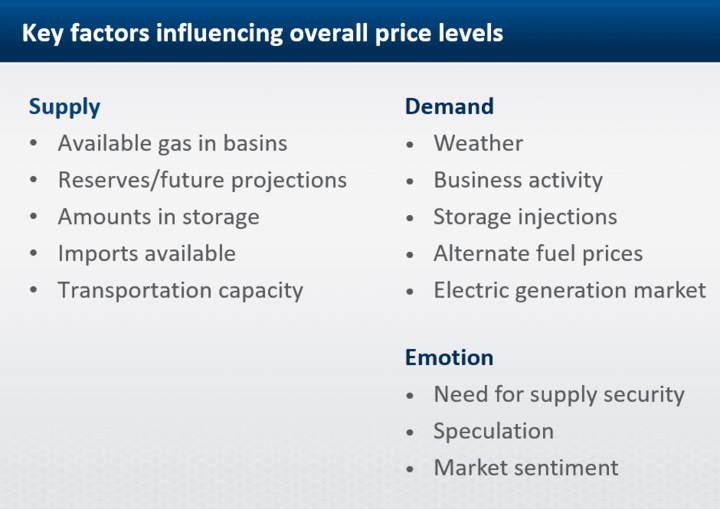
Supply and demand: Changes in supply and demand levels can significantly impact the price of natural gas. Traders need to analyze natural gas production, consumption, and storage levels to gauge supply and demand dynamics.
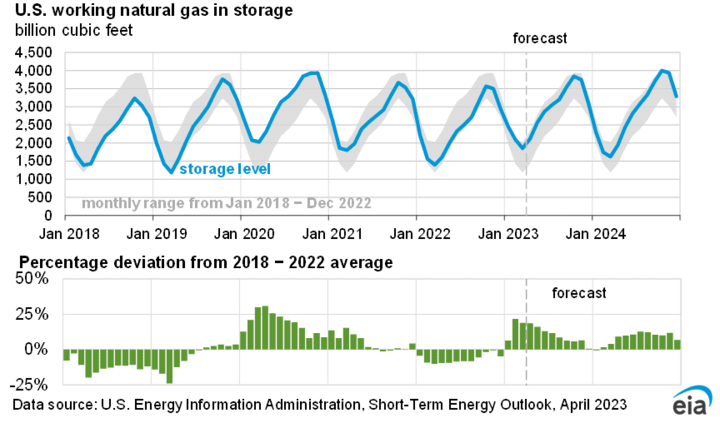
Geopolitical events: geopolitical events such as natural disasters, political turmoil, and conflicts can disrupt the supply and demand of natural gas. Traders need to monitor these events and evaluate their impact on the price of natural gas.
Economic indicators: Economic indicators such as inflation, employment, and GDP can significantly impact the price of natural gas. Traders need to analyze these indicators and their impact on the broader economy to assess their impact on natural gas prices.
Weather patterns: Weather patterns such as extreme heat or cold can increase the demand for natural gas as a heating and cooling source. Traders need to monitor weather patterns and their impact on demand levels to predict price movements.
Once traders have analyzed these factors, a trader can use this information to make informed trading decisions. For example, if traders expect natural gas prices to rise due to increasing demand, traders can take a long position in natural gas CFDs. On the other hand, if traders expect prices to fall due to oversupply, traders can take a short position in natural gas CFDs.
It's important to note that fundamental analysis should be used with technical analysis and risk management strategies to maximize profits and minimize losses.
Sentiment analysis strategy
In news-driven gas CFD trading, the sentiment analysis strategy involves analyzing market participants' overall mood and sentiment towards a particular gas commodity or asset, especially in response to news events or economic indicators.
How to analyze market sentiment
Keep track of news and economic indicators that could affect the gas market. This includes natural disasters, political events, inventory reports, and changes in demand.
Analyze the market sentiment by gauging the reaction of other traders and investors to the news events. This can be done by reading market news and analysis, monitoring social media and online forums, and following expert commentary.
How to enter and exit trades
Based on the analysis, determine the direction of the gas market. Is the overall sentiment bullish or bearish?
Once a trader has determined the market's direction, enter the trade accordingly. For example, consider buying a gas CFD if the sentiment is bullish.
How to manage risk
Set stop-loss and take-profit levels to manage risk. Stop-loss levels can be set to protect the position in case market sentiment changes. Take-profit levels can be set to lock in profits when the market reaches a certain level.
Keep a close eye on the market and monitor any changes in sentiment. If the sentiment changes, adjust stop-loss and take-profit levels accordingly.
How to profit from sentiment analysis
Profiting from sentiment analysis involves identifying and trading based on market sentiment. Here are some ways to profit from sentiment analysis:
Identify trends: Sentiment analysis can help identify trends in market sentiment. By analyzing sentiment data, traders can identify if the sentiment is bullish, bearish, or neutral. This information can be used to enter trades in the direction of the trend.
Confirm trades: Sentiment analysis can also be used to confirm trades. For example, suppose a trader identifies a bullish sentiment in the market. In that case, they can confirm their bullish bias by looking for technical analysis signals such as breakouts or moving average crossovers.
Avoid false signals: Sentiment analysis can help traders avoid false signals. For example, if a trader identifies bullish sentiment in the market but the technical analysis shows a bearish bias, the trader may avoid entering a long trade.
Trade news events: Sentiment analysis can also be used to trade news events. By analyzing the sentiment around a news event, traders can identify potential market reactions and enter trades accordingly.
Event-driven trading strategy
An event-driven trading strategy involves identifying and trading on significant events that can affect the price of a gas commodity. These events may include natural disasters, geopolitical tensions, government policies, and economic indicators.
How to identify event-driven opportunities
To identify potential event-driven opportunities, traders must stay up-to-date with the latest news and developments in the gas market. This may involve monitoring news sources, market reports, and government announcements. Traders can also use social media sentiment analysis tools to gauge market sentiment and identify potential opportunities.
How to enter and exit trades
Entering and exiting trades are critical steps in any trading strategy, including gas CFD trading. Here are some general guidelines on how to enter and exit trades:
Entering a Trade:
● Identify the market conditions and determine the strategy to use.
● Analyze the price chart and identify the entry point. This could be based on technical analysis indicators such as moving averages, support and resistance levels, or chart patterns.
● Set the entry price and the stop-loss level based on the risk management strategy. The stop-loss level should be placed at a level limiting potential losses if the trade goes against you.
● Decide on the trade size based on risk management strategy and the available margin in account.
● Execute the trade.
Exiting a Trade
● Monitor the trade and determine the exit point. This could be based on technical analysis indicators or a predetermined profit target.
● Set the exit price and close the trade. If the trade is profitable, a trader may consider using a trailing stop loss to lock in profits while allowing for potential further gains.
● Evaluate the trade outcome and use the insights gained to improve future trading decisions.
How to manage risk
Managing risk is a crucial aspect of any trading strategy, and gas CFD trading is no exception. Traders can use various risk management techniques to minimize their exposure to potential losses.
Stop-loss orders: A stop-loss order is an instruction to close a position when the market price reaches a certain level. This helps limit potential losses by automatically closing out a position if the market moves against you.
Position sizing: Position sizing involves determining the appropriate amount of capital to allocate to each trade based on risk tolerance and the size of the trading account. By managing position size, a trader can limits the impact of any single trade on the overall account balance.
Diversification: Diversifying portfolios can help spread risk across multiple assets and reduce exposure to any single market or asset. For example, instead of trading only natural gas CFDs, traders may also trade other commodity CFDs, stocks, or bonds.
Risk-to-reward ratio: Traders should aim to have a favorable risk-to-reward ratio for each trade. This means that the potential profit should be greater than the potential loss. For example, a trader may set a profit target of $200 and a stop-loss of $100, giving a risk-to-reward ratio of 1:2.
Use of leverage: While leverage can amplify potential profits, it also increases the risk of losses. Traders should use leverage carefully and consider the potential impact on their account balance.
How to profit from event-driven trading
Here are some ways to profit from event-driven trading in gas CFD trading:
Monitor economic calendars: Keep track of upcoming events and their potential impact on the market. For example, if an OPEC meeting is scheduled, it could lead to increased volatility in the gas market.
Analyze the event: Research and analyze the event's potential impact on the gas market. Consider historical price movements, market sentiment, and current market conditions.
Use technical analysis. Look for technical signals that could indicate the market's reaction to the event. For example, if a support or resistance level is broken after an event, it could signal a change in market direction.
Manage position size: Since event-driven trading can be unpredictable, it's important to manage position size to limit potential losses. Consider using stop-loss orders to protect against adverse market movements.
Take profit: Once you've entered a trade, be ready to take profit if the market moves in favor. Consider setting a profit target and adjusting it as the market moves.
Examples of news-driven market scenarios and how to apply these strategies
Here are a few examples of news-driven market scenarios and how news trading, fundamental analysis, sentiment analysis, and event-driven trading strategies can be applied:
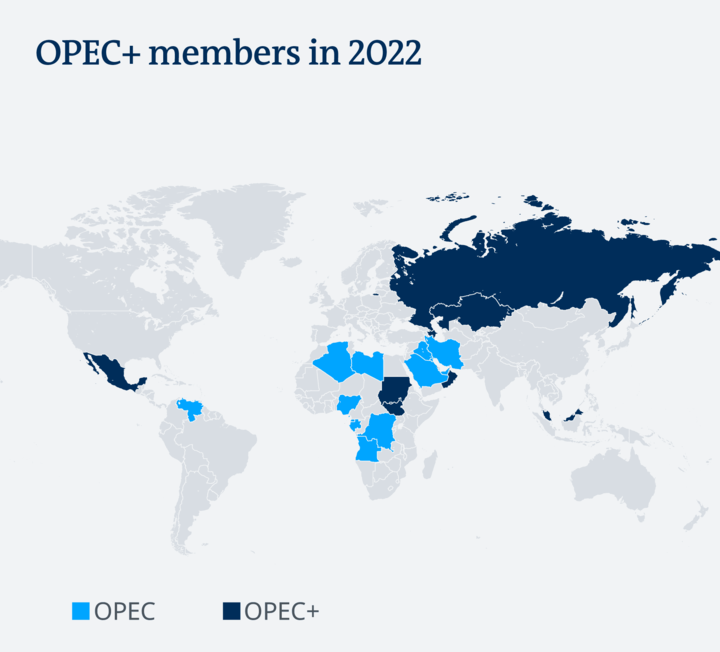
OPEC announces a production cut. In this scenario, the news trading strategy can be applied by monitoring the news for the announcement and quickly entering a long position in gas CFDs, hoping to benefit from the bullish sentiment that the news will likely create. The fundamental analysis strategy can be applied by analyzing the potential impact of the production cut on gas prices, considering supply and demand factors. The sentiment analysis strategy can be applied by gauging the market's reaction to the announcement. The event-driven trading strategy can be applied by identifying companies likely to be impacted by the production cut, such as oil and gas exploration companies or transportation companies.
A hurricane disrupts gas production in the Gulf of Mexico. In this scenario, the news trading strategy can be applied by monitoring the news for updates on the hurricane and quickly entering a long position in gas CFDs, hoping to benefit from the bullish sentiment that the news will likely create. The fundamental analysis strategy can be applied by analyzing the potential impact of the hurricane on gas prices, considering the extent of the production disruption and the impact on supply and demand. The sentiment analysis strategy can be applied by gauging the market's reaction to the news and identifying related sentiment shifts. The event-driven trading strategy can be applied by identifying companies likely to be impacted by the production disruption, such as gas production companies or transportation companies that rely on gas.
A major pipeline explosion occurs in a gas-producing region. In this scenario, the news trading strategy can be applied by monitoring the news for updates on the explosion and quickly entering a short position in gas CFDs, hoping to benefit from the bearish sentiment that the news will likely create. The fundamental analysis strategy can be applied by analyzing the potential impact of the pipeline explosion on gas prices, considering the extent of the damage and the impact on supply and demand. The sentiment analysis strategy can be applied by gauging the market's reaction to the news and identifying related sentiment shifts. The event-driven trading strategy can be applied by identifying companies likely to be impacted by the pipeline explosion, such as gas production companies or transportation companies that rely on the pipeline for transport.
VII. Choosing the Right Gas CFD Trading Strategy for the Market Condition
When trading gas CFDs, choosing the right strategy for the market condition is critical. There are various factors to consider when selecting a strategy, including the current market conditions, the trader's risk tolerance, and their trading style. In general, the trader must be able to identify the current market condition before choosing a strategy.
Factors to consider when selecting a strategy
One of the primary factors to consider when selecting a strategy is the current market condition. The market can be classified into four primary conditions: trending, ranging, volatile, and news-driven. Each market condition requires a unique approach to trading, and selecting the right strategy can make a significant difference in trading results.
For example, in a trending market, a trader may choose a trend-following strategy that takes advantage of the established trend. In contrast, in a range market, a trader may choose a range trading strategy that aims to profit from the price oscillations within the range. In a volatile market, a trader may choose a momentum trading strategy that aims to profit from rapid price movements. Lastly, in a news-driven market, a trader may choose a fundamental or sentiment analysis strategy that takes into account the impact of significant news events on the market.
Another critical factor to consider when selecting a strategy is risk management. Each strategy has its own set of risks, and it is essential to manage risk effectively to minimize losses. Trader should consider their risk tolerance and choose a strategy that aligns with their risk management approach. For instance, a trader with a lower risk tolerance may opt for a range trading strategy that aims to limit their exposure to market volatility, while a trader with a higher risk tolerance may choose a momentum trading strategy that has the potential for higher returns but also carries more significant risks.
Importance of market analysis and risk management
Market analysis and risk management are crucial to successful trading, especially in the fast-moving and unpredictable world of gas CFD trading.
Market analysis involves studying and interpreting current and historical market data to identify trends, patterns, and potential trading opportunities. This analysis can help traders choose the most appropriate trading strategy that suits the current market conditions. Failure to perform adequate market analysis can lead to incorrect trading decisions and losses.
Risk management involves implementing strategies to minimize potential losses and protect against adverse market movements. This can include setting stop-loss orders, monitoring trading positions closely, and limiting exposure to the market. Effective risk management is essential to preserving capital and ensuring that losses are minimized in the event of unfavorable market movements.
Examples of how to choose the right strategy for different market conditions
Trending Markets: In trending markets, it is best to use strategies that follow the trend, such as breakout or momentum trading strategies. These strategies aim to capture the momentum of the trend and can result in significant profits. For example, if the price of gas is steadily increasing, a breakout strategy may involve waiting for the price to break through a resistance level before entering a long position.
Ranging Markets: In ranging markets, it is best to use strategies that capitalize on price movements within a range, such as range trading or support and resistance trading strategies. These strategies aim to buy at support levels and sell at resistance levels, generating profits as the price moves within the range. For example, if the price of gas is trading within a range of $2.00 to $2.20, a range trading strategy may involve buying at $2.00 and selling at $2.20.
Volatile Markets: In volatile markets, it is best to use strategies that can handle sudden price movements, such as volatility breakouts or news trading strategies. These strategies aim to capture significant price movements caused by sudden changes in market sentiment or news events. For example, if a major gas pipeline is shut down due to a hurricane, a news trading strategy may involve buying gas contracts in anticipation of a supply shortage and price increase.
News-Driven Markets: In news-driven markets, it is best to use strategies that can analyze and capitalize on the impact of news events, such as fundamental analysis or sentiment analysis strategies. These strategies aim to understand the impact of news events on market sentiment and underlying fundamentals. For example, if a major gas producer reports better-than-expected earnings, a fundamental analysis strategy may involve buying gas contracts in anticipation of increased demand and price appreciation.
VIII. Risk Management Techniques in Gas CFD Trading
Risk management is a crucial aspect of successful gas CFD trading. It involves various techniques traders use to limit potential losses and protect their capital. This section will discuss some essential risk management techniques that traders should consider when trading gas CFDs.
Setting stop-loss orders
Stop-loss orders are orders placed with a broker to sell a security when it reaches a certain price. They help traders limit potential losses by automatically closing a trade if the market moves against them. Traders can set stop-loss orders at a specific price level or as a percentage of their account balance. For example, a trader might set a stop-loss order at 1% below the entry price of a trade to limit potential losses.
Position sizing
Position sizing is determining the appropriate size of a position to take in a trade. It involves considering factors such as account size, risk tolerance, and the potential risk and reward of the trade. Traders can use position sizing to limit potential losses by ensuring that no single trade can significantly impact their account balance. For example, a trader might limit their exposure to any single trade to 2% of their account balance.
Diversifying the portfolio
Diversification involves spreading a trader's capital across multiple trades or assets to reduce the impact of any single trade or event. It helps reduce the risk of significant losses and provides a more stable return on investment. For example, a trader might diversify their portfolio by trading gas CFDs across multiple markets, such as natural gas and crude oil.
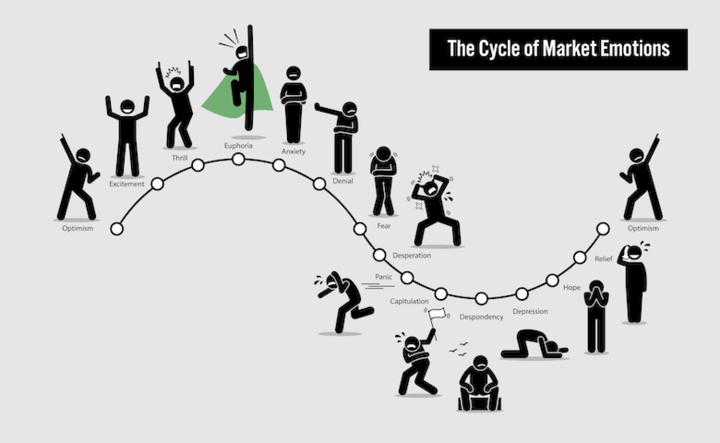
Managing emotions
Managing emotions is a critical aspect of risk management in gas CFD trading. Emotions such as fear and greed can cloud judgment and lead to impulsive or irrational trading decisions. Traders can manage their emotions by following a trading plan, sticking to predetermined risk management rules, and avoiding overtrading.
The importance of having a trading plan
A trading plan is a set of rules and guidelines that a trader follows when entering and exiting trades. It helps traders manage risk and avoid impulsive or irrational trading decisions. A trading plan should include risk management rules such as stop-loss orders, position sizing, and diversification. For example, a trading plan might specify that a trader will only enter trades with a risk-to-reward ratio of at least 1:2.
IX. Practice Gas CFD Trading Strategies
Practice is essential to mastering any skill, and gas CFD trading is no exception. There are several ways in which traders can practice gas CFD trading strategies and improve their skills, including demo accounts, backtesting tools, paper trading, and educational resources.
Demo accounts
Demo accounts are an excellent way for traders to practice gas CFD trading strategies in a risk-free environment. They provide access to real-time market data and allow traders to trade with virtual funds, providing a realistic trading experience without risking real money. VSTAR offers demo accounts with a $100,000 virtual balance that traders can use to practice their gas CFD trading strategies.
Backtesting tools
Backtesting tools allow traders to test their gas CFD trading strategies on historical market data. This helps traders evaluate the effectiveness of their strategies and make any necessary adjustments before using them in live trading. VSTAR offers a range of backtesting tools, including the ability to test trading strategies using historical data.
Paper trading
Paper trading is another way for traders to practice gas CFD trading strategies without risking real money. It involves keeping a record of trades on paper without executing them in the market. This can help traders develop discipline and test their strategies in a simulated trading environment.
Educational resources
Educational resources are also essential for traders looking to improve their gas CFD trading skills. VSTAR provides various educational resources, including webinars, tutorials, and articles covering topics such as trading strategies, risk management, and market analysis. By studying these resources, traders can gain valuable insights into the gas CFD trading market and develop their own trading strategies.
Overall, practice is crucial for gas CFD traders looking to improve their skills and profitability. Demo accounts, backtesting tools, paper trading, and educational resources are all essential tools that traders can use to practice their gas CFD trading strategies and gain valuable experience in the market. VSTAR provides these tools and resources, making it an excellent choice for traders looking to improve their gas CFD trading skills.
X. Conclusion
A recap of gas CFD trading strategies for different market conditions
Gas CFD trading strategies can be broadly classified into four categories based on market conditions: trending, ranging, volatile, and news-driven markets.
For trending markets, traders can use trend following and pullback strategies to identify and profit from market trends. These strategies involve identifying the direction of the trend and entering trades in that direction.
For ranging markets, traders can use strategies such as range trading, support, and resistance trading, and mean reversion trading to profit from price movements within a specific range. These strategies involve identifying key support and resistance levels and entering trades accordingly.
For volatile markets, traders can use strategies such as volatility breakout trading, momentum trading, and news trading to capitalize on sudden price movements. These strategies involve identifying significant price movements and entering trades accordingly.
For news-driven markets, traders can use strategies such as fundamental analysis, sentiment analysis, and event-driven trading to capitalize on market-moving news events. These strategies involve analyzing fundamental factors, market sentiment, and news events to identify potential trading opportunities.
It's essential to understand market conditions before choosing a trading strategy. Different strategies work best in different market conditions, and choosing the wrong strategy can result in significant losses.


The importance of continuous learning and improvement in gas CFD trading
Continuous learning and improvement are essential in gas CFD trading as the markets are constantly changing and evolving. Traders need to stay up-to-date with the latest news, economic data, and market trends to make informed trading decisions. They also need to continuously analyze their trading strategies, identify weaknesses, and adjust their approach to improve their performance.
Continuous learning can take many forms, including reading trading books and articles, attending seminars and webinars, practicing on a demo account, and seeking mentorship or guidance from experienced traders. By continuously learning and improving, traders can increase their knowledge, skills, and confidence, which can lead to better trading results.
In addition, traders should also keep a trading journal to track their progress, review their past trades, and identify areas for improvement. They should also seek feedback from other traders or mentors to gain different perspectives and insights on their trading strategies.
Ultimately, continuous learning and improvement are critical for long-term success in gas CFD trading, as the markets are always changing and evolving, and traders need to adapt to these changes to stay ahead.
How to Profit from Different Gas CFD Trading Strategies
Profiting from different gas CFD trading strategies requires a combination of skills, knowledge, and experience. It's important to choose the right strategy for the current market conditions and to manage risk effectively. Here are some key tips for profiting from different gas CFD trading strategies:
Trend following: Look for strong trends in the market and enter trades in the direction of the trend. Use technical indicators such as moving averages or trendlines to identify trends, and use stop-loss orders to limit losses if the trend reverses.
Mean reversion: Look for markets that have moved away from their long-term average and enter trades in the opposite direction of the move, expecting the market to eventually revert to the mean. Use technical indicators such as Bollinger Bands or the Relative Strength Index (RSI) to identify mean reversion opportunities and use stop-loss orders to limit losses if the market continues to move against you.
Volatility breakout: Look for markets experiencing high levels of volatility and enter trades in the direction of the breakout, expecting the volatility to continue. Use technical indicators such as the average true range (ATR) or the Bollinger Bands to identify volatility breakouts and use stop-loss orders to limit losses if the market fails to continue in the breakout direction.
Momentum: Look for markets experiencing strong momentum in a particular direction and enter trades in the same direction as the momentum, expecting the trend to continue. Use technical indicators such as the Moving Average Convergence Divergence (MACD) or the Relative Strength Index (RSI) to identify momentum opportunities and use stop-loss orders to limit losses if the momentum reverses.
News trading: Look for markets that are reacting strongly to news events and enter trades in the direction of the market reaction, expecting the trend to continue. Use fundamental analysis and news sources to identify potential news events, and use stop-loss orders to limit losses if the market reacts unexpectedly.
Sentiment analysis: Look for markets that are being driven by market sentiment and enter trades in the direction of the sentiment, expecting the trend to continue. Use technical indicators such as the Commitment of Traders (COT) report or social media sentiment analysis to identify market sentiment and use stop-loss orders to limit losses if the sentiment changes.