Gas CFD trading can be a volatile and unpredictable market, but with the right strategies, traders can harness its potential for significant profits. The key to success lies in understanding the different trading strategies and identifying the ones that work best for current market conditions. Whether it's trend-following, breakout trading, news trading, hedging, or scalping, each strategy has its unique strengths and weaknesses.

Trend-following helps traders capitalize on long-term price trends, while breakout strategies help identify potential trend reversals. News trading enables traders to capitalize on market volatility following significant news events, while hedging provides a risk management strategy to mitigate potential losses. Scalping is a high-frequency trading strategy that aims to capture small profits from quick price movements. The article is exploring these different strategies that can help traders to develop a comprehensive approach to gas CFD trading and achieve consistent profits.
A. Trend-Following Strategy
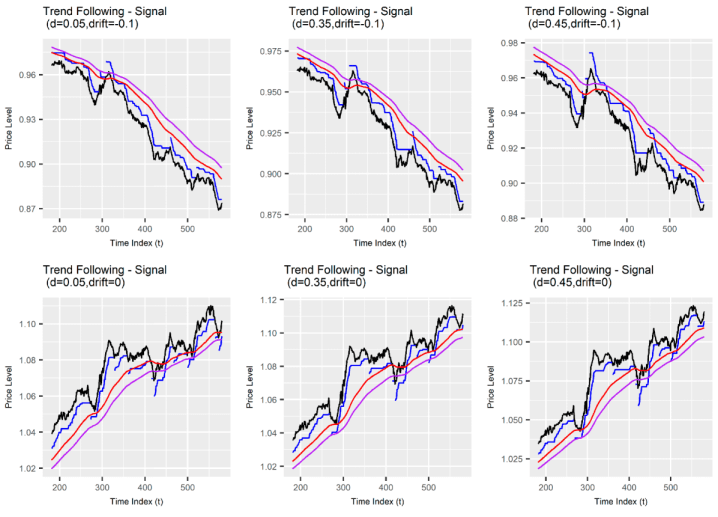
Trend-following is a popular trading strategy that seeks to take advantage of price trends in the market. The basic premise of trend-following is that the market tends to move in trends and that traders can profit by buying in an uptrend and selling in a downtrend. The key to success in trend-following is identifying and following a trend while avoiding getting caught up in short-term market noise.
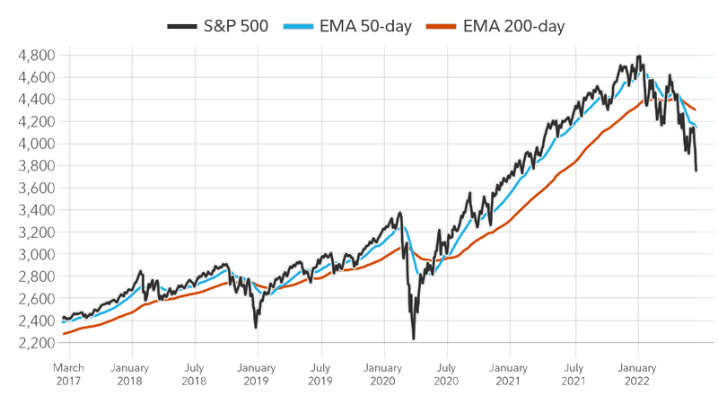
There are a variety of critical indicators and tools that can be used for trend-following. One of the most popular indicators is the moving average, a line representing the average price of a security over a specific time. Traders will often use moving averages of different time frames, such as a 50-day and 200-day moving average, to identify longer-term trends.
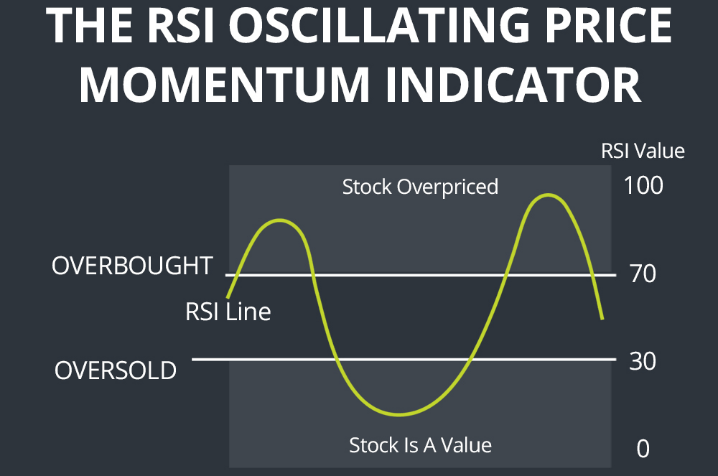
Another critical tool for trend-following is momentum indicators, such as the stochastic oscillator or RSI. These indicators measure the strength of a trend and can help traders identify potential reversals.
In a bullish market, a trend-following strategy might involve buying a security when its price crosses above a moving average and selling when the price crosses below the moving average. The trader might also use momentum indicators to confirm the trend's strength and avoid getting caught in a false breakout.
For example, a trader might notice that the price of a Gas CFD has been steadily increasing over the past few days and is now trading above its 50-day moving average. They might buy the CFD and set a stop-loss order below the moving average to limit their risk. If the CFD continues to trend upwards, it might hold onto the position until the price crosses below the moving average or another exit signal is triggered.
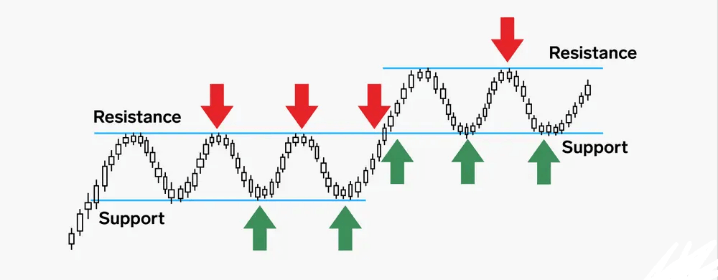
B. Breakout Strategy
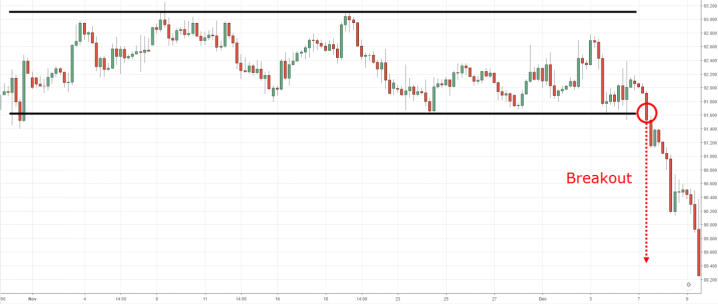
The breakout strategy is a popular approach in gas CFD trading that aims to capture profits from a significant price movement following a period of consolidation or range-bound market conditions. In essence, the breakout strategy involves identifying critical levels of support and resistance and entering trades when the price breaks above or below these levels, signaling a potential trend reversal.
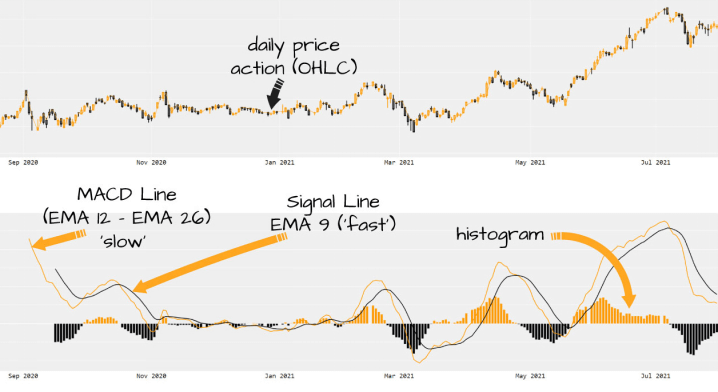
One of the critical indicators for the breakout strategy is the Bollinger Bands, a technical tool consisting of three bands—an upper, middle, and lower band—that plot the price movement relative to its standard deviation. The upper and lower bands represent the levels of resistance and support, respectively, while the middle band serves as a trend line. Other vital indicators for the breakout strategy include the MACD, Stochastic Oscillator, and RSI.
To implement the breakout strategy in a range-bound market, traders need to identify the key levels of support and resistance, which typically form a horizontal channel or trading range. The goal is to enter trades when the price breaks above or below these levels, indicating a potential trend reversal. For example, if the gas CFD price has been trading in a range-bound market between $2.50 and $3.00 and the price breaks above the resistance level of $3.00, a trader might enter a long position with a stop-loss order below the breakout level to manage risks.
C. News Trading Strategy
News trading is a popular approach in gas CFD trading that involves capitalizing on market volatility following the release of significant news events. News events such as inventory reports, government or central bank policy announcements, and geopolitical events can cause rapid changes in gas prices, presenting opportunities for traders to make profits by entering positions before or after the news release.
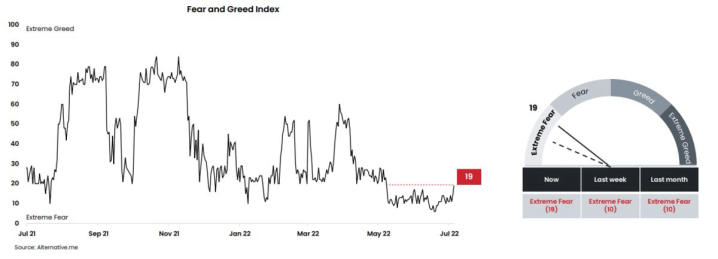
Key indicators and tools for news trading include the Economic Calendar, which highlights upcoming news events, and market sentiment indicators, such as the Fear and Greed Index, which provides insights into the overall market sentiment.
Traders also use technical analysis tools such as MACD and RSI to confirm trends and identify potential entry and exit points.
To implement the news trading strategy in a highly volatile market, traders need to keep a close eye on upcoming news events and be prepared to act quickly to capitalize on any price movements. For example, suppose a government report indicates a decline in gas inventories. In that case, a trader might enter a long position in anticipation of rising prices, with a stop-loss order to manage risks. Alternatively, if the central bank announces a rate hike, a trader might enter a short position in anticipation of falling prices.
D. Hedging Strategy
Hedging is used to mitigate potential losses in financial markets. It involves taking an offsetting position in a related or correlated asset to reduce the risk of adverse price movements. Hedging aims to protect an existing position from potential losses or to limit downside risk.
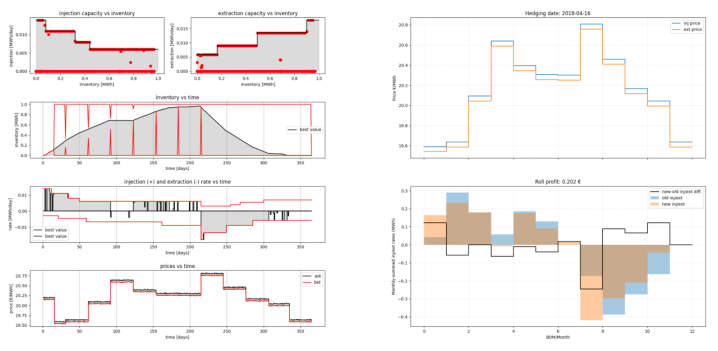
Key indicators and tools for hedging include technical analysis, fundamental analysis, market sentiment, and volatility. Market sentiment signifies the overall attitude of traders towards the market, while volatility measures the degree of price fluctuations.
An example of a hedging strategy in a market with high levels of uncertainty is using options to protect against potential losses. For instance, if an investor holds a long position in a gas commodity and is concerned about a possible price drop, they could purchase a put option, the right to sell the commodity at a predetermined price. If the price does drop, the investor can exercise their option and sell the commodity at a higher price, thereby offsetting their losses.
E. Scalping Strategy
Scalping involves making multiple small trades with small profits in a short period. Scalping aims to take advantage of small price movements and generate profits quickly. The strategy is widely used in highly liquid markets with low volatility.
Key indicators and tools for scalping include technical indicators such as chart patterns, moving averages, and oscillators. These indicators help traders identify potential price movements and entry and exit points. Additionally, traders need to have a fast and reliable trading platform with access to real-time market data.
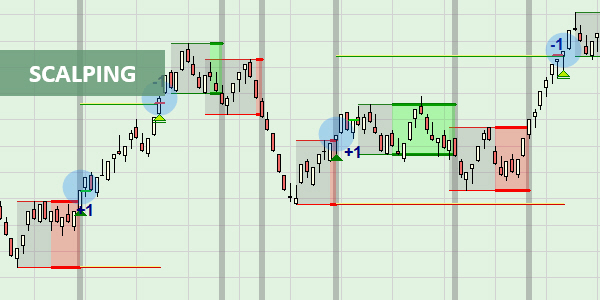
An example of a scalping strategy in a highly liquid market with low volatility is using a breakout strategy. In this strategy, traders wait for a significant price move above or below a support or resistance level. Once the price breaks out, traders enter a position in the direction of the breakout and aim to capture small profits before the price reverses.
For instance, suppose a trader is scalping natural gas CFDs in a market with low volatility. They notice that the price has been trading in a range for an extended period and has formed a strong resistance level. If the price breaks above the resistance level, the trader enters a long position with a tight stop loss and a take-profit target. If the price moves in their favor, they take profits and exit the position. If the price reverses and hits its stop loss, they exit the position with a small loss.
F. Swing Trading Strategy
Swing trading requires holding a position for a few days to several weeks, aiming to capture price swings in the market. The goal of swing trading is to profit from medium-term price movements rather than short-term price fluctuations.
Key indicators and tools for swing trading include technical analysis, fundamental analysis, and market sentiment. Technical analysis involves analyzing price charts and indicators to identify potential price movements, while fundamental analysis consists in evaluating the underlying economic and financial factors that affect the market.
An example of a swing trading strategy in a market with moderate volatility is using a trend-following strategy. In this strategy, traders look for a trending market and enter a position in the direction of the trend. They then hold the position until the trend shows signs of reversing, at which point they exit the position and take profits.
For instance, suppose a trader is swing trading natural gas CFDs in a market with moderate volatility. They notice that the price has been trending upward for several weeks and has recently broken through a resistance level. The trader enters a long position and sets a stop loss at a level that would limit their losses if the price reverses. They hold the position as long as the price continues to trend upward, eventually reaching their take-profit target. If the price shows signs of reversing, they exit the position with a profit.
G. Position Trading Strategy
Position trading is a long-term trading strategy that involves holding a position for weeks, months, or even years, aiming to profit from significant price movements in the market. The strategy requires patience and discipline and is suitable for traders who can withstand market fluctuations and hold a position for an extended period.
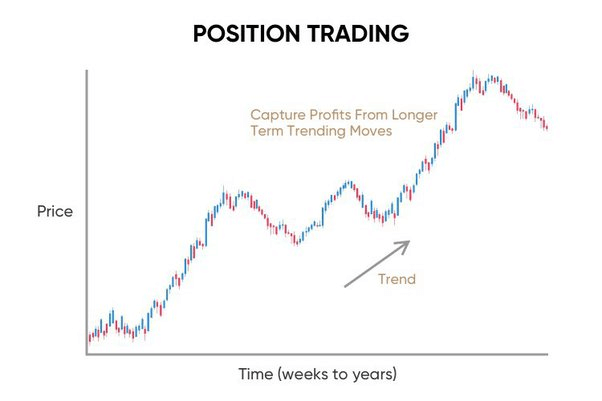
Key indicators and tools for position trading include fundamental analysis, macroeconomic trends, and market sentiment. Macroeconomic trends refer to the overall economic conditions that influence the market.
An example of a position trading strategy in a strong bullish trend is a buy-and-hold strategy. In this strategy, traders identify a solid bullish trend and enter a long position, aiming to hold the position for an extended period. They set a stop loss to limit their losses if the market turns against them, but they also set a take-profit target much higher than the entry price, aiming to capture significant gains from the bullish trend.
For instance, suppose a trader is positioned to trade natural gas CFDs in a market with a solid bullish trend. They conduct fundamental analysis and identify that the natural gas demand is increasing due to a growing economy and favorable government policies. The trader enters a long position and sets a stop loss below the support level. They hold the position as long as the bullish trend continues, eventually reaching their take-profit target. If the trend shows signs of reversing, they exit the position with a profit.
H. Portfolio Diversification Strategy
Portfolio diversification is a crucial strategy for managing risk in investment portfolios. It signifies spreading investments across different asset classes, sectors, and geographical regions to reduce the portfolio's overall risk. A diversified portfolio typically contains a mix of stocks, bonds, commodities, and real estate, with varying levels of risk and return.
Key indicators and tools for portfolio diversification include correlation analysis, asset allocation models, and risk management techniques. Correlation analysis helps identify the degree of correlation between different asset classes, enabling investors to select assets without any strongly correlated with each other. Asset allocation models help determine the optimal mix of assets for a given level of risk and return. Risk management methodologies, such as stop-loss orders and hedging strategies, can be used to minimize potential losses.
An example of a portfolio diversification strategy across multiple markets and asset classes could include investing in a mix of domestic and international stocks, bonds, commodities, and real estate. For instance, an investor may allocate a certain percentage of their portfolio to U.S. large-cap stocks, global small-cap stocks, emerging market bonds, commodity ETFs, and real estate investment trusts (REITs).
By diversifying across multiple markets and asset classes, the investor can reduce their exposure to any particular risk and potentially increase the overall return of their portfolio. However, it is essential to note that diversification does not guarantee profits or eliminate all risks.
Why Trade Gas CFDs With VSTAR?
Trading gas CFDs with VSTAR provides several advantages for traders looking to harness profits in the volatile gas market. Firstly, VSTAR offers access to a wide range of markets and asset classes, including gas, gold, silver, and other commodities. It allows traders to diversify their portfolios and spread their risk across different assets.
Secondly, VSTAR offers an institutional-level trading experience with the lowest trading fees and deep liquidity, ensuring reliable and super-fast order execution. It allows them to take advantage of market movements quickly and efficiently, maximizing their profits.
Thirdly, VSTAR is fully regulated and secure, authorized under the Cyprus Securities and Exchange Commission, No. 409/22, and a member of the Cyprus Investor Compensation Fund. Under the European Regulatory Framework of MiFID II, VSTAR adheres to strict regulatory standards, ensuring the safety and security of traders' funds.
Lastly, VSTAR offers a user-friendly app for both professional traders and beginners, with an easy-to-use interface and a minimum deposit of only $50. The app also provides negative balance protection and trading opportunities on popular real-time markets.
Conclusion
In conclusion, developing a trading plan and using appropriate risk management techniques are crucial when trading gas CFDs. The gas market is highly volatile, and without a trading plan, traders may fall prey to impulsive decisions that can lead to losses. A well-thought-out trading plan helps traders define their trading goals, strategies, and risk management techniques. It also enables them to identify entry and exit points, which are critical to maximizing profits.
Risk management techniques are equally important when trading gas CFDs. These techniques help traders minimize potential losses and protect their investments. Through stop-loss orders and position sizing, traders can limit their exposure to market volatility and avoid margin calls. Moreover, they can employ risk-reward ratios to ensure that the potential rewards of their trades are more significant than the risks.
By doing so, they can improve their chances of success, minimize losses, and ultimately achieve their financial goals.
*Disclaimer: The content of this article is for learning purposes only and does not represent the official position of VSTAR, nor can it be used as investment advice.