I. Introduction to Technical Analysis for Gold CFD Trading
A. Explanation of technical analysis
Technical analysis is a productive tool traders use to make investment decisions by analyzing historical market data, including price and volume. It is a method of evaluating market trends and identifying potential trading opportunities based on chart patterns, indicators, and oscillators. In gold CFD trading, technical analysis can be a valuable tool for predicting market movements and optimizing trading strategies.
B. How technical analysis can be applied to gold CFD trading
Technical analysis can be applied to gold CFD trading in various ways. Firstly, it can help traders identify support and resistance levels, key levels where the market has historically experienced either buying or selling pressure. These levels can be used to set entry and exit points for trades and identify potential areas for profit-taking.

Secondly, technical analysis can help traders identify trends in the gold market. By analyzing price charts and technical indicators, traders can determine whether the market is in a bullish or bearish trend. This can help traders make informed decisions about whether to enter or exit trades, as well as adjust their trading strategies to align with market trends.
Thirdly, technical analysis can help traders identify potential trading opportunities by analyzing chart patterns such as triangles, head and shoulders, and double bottoms. These patterns can signal potential breakouts or reversals in the market, providing traders with valuable information to inform their trading decisions.
C. Benefits of using technical analysis in gold CFD trading
There are several benefits to using technical analysis in gold CFD trading. Firstly, technical analysis can help traders make more logical decisions about when to enter and exit trades, potentially improving their overall profitability. Additionally, technical analysis can help traders manage risk by identifying direct support and resistance levels and providing information about potential market movements.

Furthermore, technical analysis can provide traders with a better understanding of market trends and help them adjust their trading strategies to align with these trends. This can be particularly useful in gold CFD trading, where market trends can be influenced by a range of factors, including economic and political events.
II. Key Technical Indicators for Gold CFD Trading
A. Moving Averages (MAs)
MAs are statistical tools used to measure the average price over a specific period. They are calculated by adding the prices of an asset over a certain number of periods and dividing by the count of periods. The two most common moving averages used in gold CFD trading are the simple moving average (SMA) and the exponential moving average (EMA).
1. Simple Moving Average (SMA)
SMA is the most basic kind of moving average, which calculates the average price of an asset over a specific period. It is computed by adding the closing prices of an asset over a certain number of periods and then dividing the result by the number of periods. The SMA is helpful in identifying trends and providing support and resistance levels.
2. Exponential Moving Average (EMA)
EMA is a more complex moving average that places more weight on recent price movements. It is calculated by applying a weight to the closing prices of an asset, with the most recent price movements receiving the highest weight. The EMA is useful in identifying trends and providing signals for potential buy and sell opportunities.
B. Technical Indicators
When it comes to trading gold through CFDs (Contracts for Difference), technical analysis can play a crucial role in scanning the entry and exit points for a trader. Technical indicators are mathematical calculations derived from a security's price and/or volume that help traders analyze market trends, momentum, and volatility. Here are some of the key technical indicators that can be used for gold CFD trading.
1. Relative Strength Index (RSI)
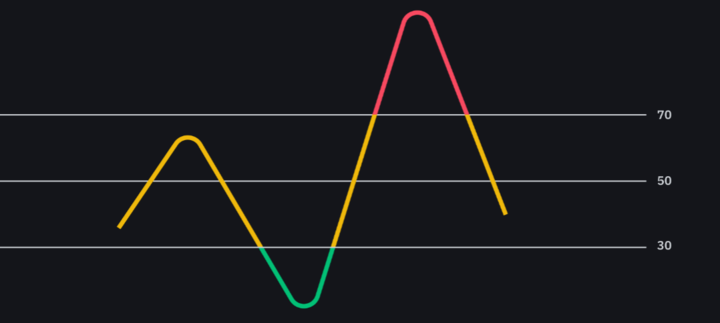
The RSI is a popular momentum oscillator that quantifies the strength of price action through the comparison with the average gains and losses over a specified period. The RSI moves in the range of 0 to 100, with reaching above 70 indicating overbought conditions and hitting below 30 indicating oversold conditions. Traders can use RSI to identify potential buy and sell signals in gold CFDs.
2. Bollinger Bands (BBs)
BBs are a type of volatility indicator consisting of three lines: an SMA in the middle and two outer bands plotted at two standard deviations from the SMA. The bands expand and contract according to the level of volatility in the market. Traders can use Bollinger Bands to identify potential breakouts as well as overbought and oversold conditions.
3. Fibonacci Retracement
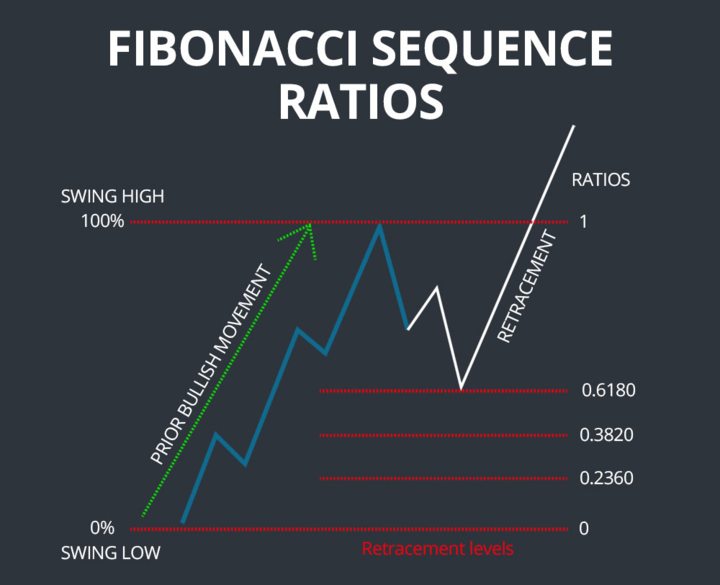
The Fibonacci retracement tool is a technical indicator that applies horizontal lines to mark the areas of support or resistance at the specific Fibonacci levels before the price movement continues in the original direction. Fibonacci retracement tools can be used by traders to mark potential entry and exit points in gold CFDs based on the assumption that prices will retrace a predictable fraction of a move, after which they will continue to move in the original direction.
4. MACD (Moving Average Convergence Divergence)
The MACD is a trend-following momentum indicator based on the relationship between two MAs of an asset's price. The MACD line is computed by subtracting the 26-period EMA)from the 12-period EMA, while the signal line is a 9-period EMA of the MACD line. Traders can use the MACD to identify potential changes in trend direction and for buy and sell signals.
III. How to Use Technical Analysis to Trade Gold CFDs
Trading gold contracts for difference (CFDs) using technical analysis can be a profitable strategy for investors. Technical analysis involves examining historical market data to identify trends, patterns, and potential trading opportunities. Here are some critical steps to using technical analysis to trade gold CFDs, with a focus on identifying trends.
A. Identifying Trends
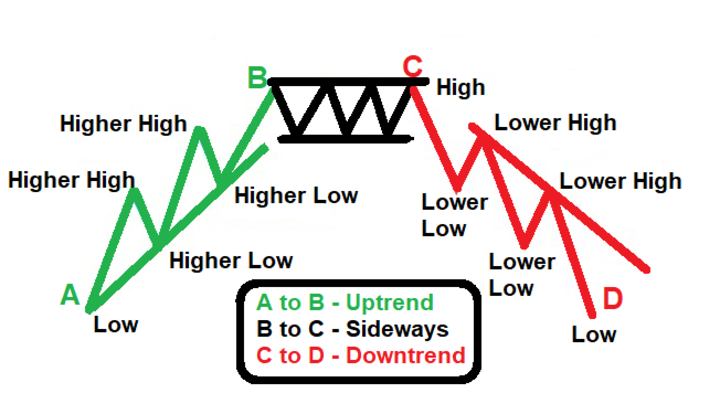
The first step in using technical analysis to trade gold CFDs is identifying trends. A trend is the general direction of price movement over a certain period. The types of trends are uptrends, downtrends, and sideways.
1. Uptrend
An uptrend occurs when the price of gold CFDs consistently rises over time. This is indicated by higher highs and higher lows in the price chart. To identify an uptrend, traders can use trendlines, moving averages, and other technical indicators.
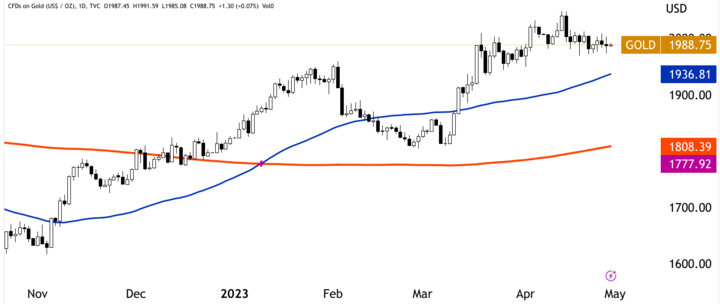
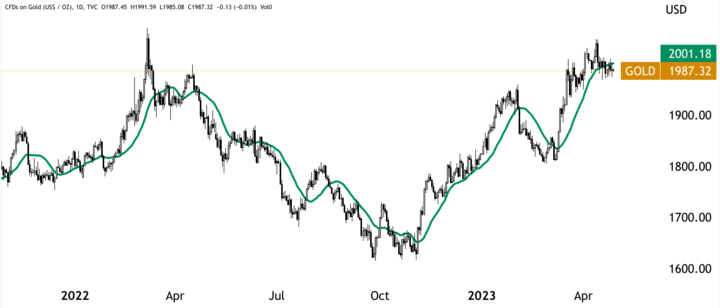
For example, consider the daily chart of gold CFDs below. The blue line represents a 50-day MA, and the orange line represents a 200-day MA. The price of gold CFDs is above both moving averages, indicating an uptrend.
2. Downtrend
A downtrend occurs when the price of gold CFDs is consistently falling over time. This is indicated by lower highs and lower lows in the price chart. To identify a downtrend, traders can use trendlines, moving averages, and other technical indicators.
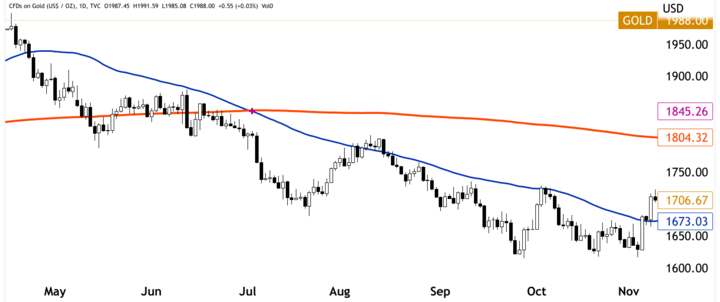
For example, consider the daily chart of gold CFDs below. The blue line represents a 50-day MA, and the orange line represents a 200-day MA. The price of gold CFDs is below both moving averages, indicating a downtrend.
B. Support and resistance levels: give actual examples or charts.
In addition to identifying trends, technical analysis can also be applied to identify support and resistance levels when trading gold contracts for difference (CFDs). Support and resistance levels are vital marks on a chart where the price has historically either found support (unable to fall further) or resistance (unable to rise further). Here are some critical steps to using support and resistance levels in trading gold CFDs.
1. How to identify support and resistance levels
Support levels are levels on a price chart where the price has historically found support and bounced back up. Resistance levels are marks where the price has historically found resistance and bounced back down. For the marking of support and resistance levels, traders can use horizontal lines on a price chart.
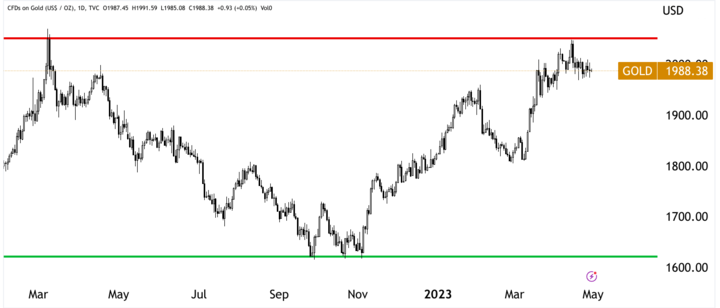
For example, consider the daily chart of gold CFDs below. The green line represents a support level, while the red line represents a resistance level. The price of gold CFDs has historically bounced back up from the green line and back down from the red line.
2. How to use support and resistance levels to set stop-loss and take-profit levels
Traders can use support and resistance levels to determine stop-loss and take-profit marks for the trades. For long trades (buying gold CFDs), the support level can be used as a stop-loss level, while the resistance level can be used as a take-profit level. For short trades (selling gold CFDs), the resistance level can be used as a stop-loss level, while the support level can be used as a take-profit level.
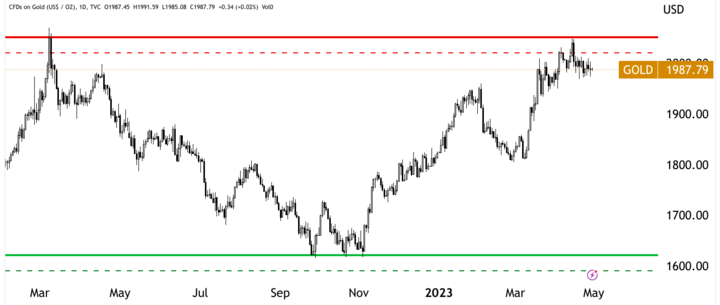
For example, consider the same daily chart of gold CFDs below. If a trader buys gold CFDs at the green support level and sets a stop loss just below the support level, they can limit their potential loss if the price falls below the support level. If the trader sets a take-profit level just below the red resistance level, they can potentially lock in a profit if the price reaches the resistance level.
3. An example of using support and resistance levels for trading
Traders can use support and resistance levels in combination with other technical indicators to make informed trading decisions. For example, if the price of gold CFDs is approaching a resistance level and the Relative Strength Index (RSI) indicates overbought conditions, this may signal to sell or take profits. Conversely, if the price reaches a support level and the RSI indicates oversold conditions, this may signal to buy or enter a long position.
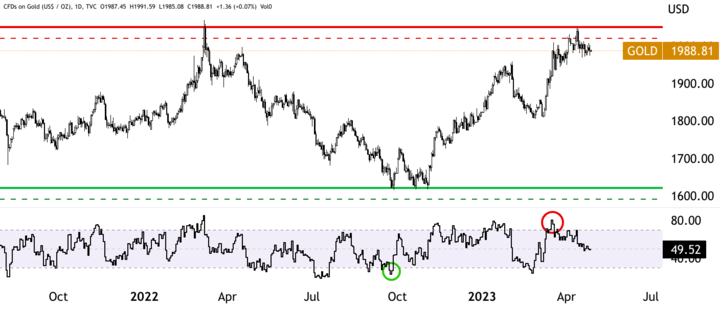
For example, consider the hourly chart of gold CFDs below. The green line represents a support level, while the red line represents a resistance level. The RSI is also included in the chart. If a trader buys gold CFDs at the support level when the RSI indicates oversold conditions, they can potentially profit if the price bounces back up from the support level. If the price approaches the resistance level and the RSI shows overbought conditions, the trader may consider selling or taking profits.
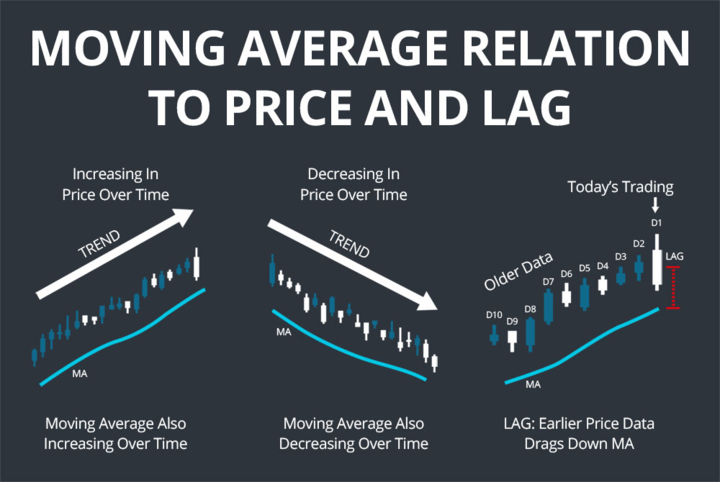
C. How to Use Moving Averages for Gold CFD Trading
Moving averages are another technical analysis tool that traders can use when trading gold contracts for difference (CFDs). Moving averages (MAs) smooth out price data over a specified period and can help identify trends and potential price reversals. Here are three ways to use moving averages when trading gold CFDs:
1. Crossover strategy
It involves using two MAs, one shorter-term and one longer-term, and looking for crossovers between the two lines. When the shorter-term MA reaches above the longer-term MA, this may be a signal to buy or enter a long position. When the shorter-term MA arrives below the longer-term MA, this may be a signal to sell or enter a short position.
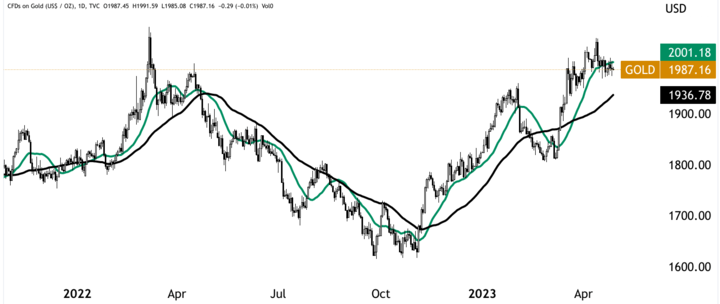
For example, consider the daily chart of gold CFDs below. The teal line represents a 20-day moving average, while the black line represents a 50-day moving average. When the teal line crosses above the black line, this may be a signal to buy or enter a long position. When the teal line crosses below the black line, this may be a signal to sell or enter a short position.
2. Price: Moving Average Strategy
The price-moving average strategy involves using a single moving average and looking for the price to cross above or below the moving average. When the price reaches above the MA, this may be a signal to buy or enter a long position. When the price arrives below the MA, this may be a signal to sell or enter a short position.
For example, consider the same daily chart of gold CFDs below. The teal line represents a 20-day MA. When the price of gold CFDs crosses above the teal line, this may be a signal to buy or enter a long position. When the price crosses below the teal line, this may be a signal to sell or enter a short position.
3. An example of using MAs for trading
Traders can use MAs in combination with other technical indicators to make logical trading decisions. For instance, if the price of gold CFDs is approaching a moving average and the Relative Strength Index (RSI) indicates oversold conditions, this may signal to buy or enter a long position. Conversely, if the price is approaching a moving average and the RSI indicates overbought conditions, this may signal to sell or enter a short position.
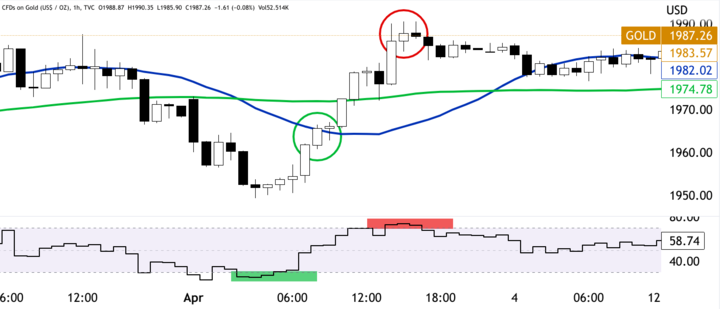
For example, consider the hourly chart of gold CFDs below. The blue line represents a 20-hour MA, while the green line represents a 50-hour MA. The RSI is also included in the chart. If a trader buys gold CFDs when the price crosses above the 20-hour MA and the RSI indicates oversold conditions, they can potentially profit if the price bounces back up from the moving average. If the price approaches beyond the 50-hour MA and the RSI indicates overbought conditions, the trader may consider selling or taking profits.
D. Use of Technical Indicators for Gold CFD Trading
Technical indicators are computations based on historical price and/or volume data that traders can use to identify potential trading opportunities in gold CFDs. Here are four popular technical indicators and strategies for using them in gold CFD trading:
1. RSI strategy
RSI is a momentum oscillator that quantifies the speed and change of price movements. The RSI moves within the range from 0 to 100, with movements above 70 considered overbought and movements below 30 considered oversold.
A popular RSI strategy for gold CFD trading involves looking for divergences between the RSI and the price of gold. When the price of gold is making lower lows, but the RSI is making higher lows, this is called bullish divergence and may be a signal to buy or enter a long position. When the price of gold is making higher highs, but the RSI is making lower highs, this is called bearish divergence and may be a signal to sell or enter a short position.
For example:
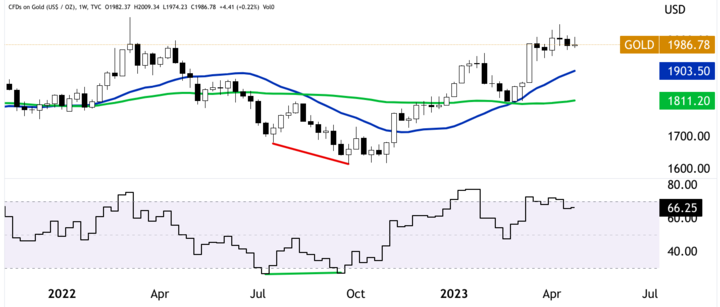
Consider the daily chart of gold CFDs below. The black line represents the RSI. In September 2022, gold CFDs made a lower low, but the RSI made a higher low, indicating a bullish divergence. Traders who bought gold CFDs at this point could potentially profit if the price bounces back up.
2. Bollinger Bands strategy
Bollinger Bands are a volatility indicator that consists of a moving average and two bands above and below the moving average that represent standard deviations from the moving average. Bollinger bands can help traders identify potential price breakouts or reversals.
A popular Bollinger Bands strategy for gold CFD trading involves looking for the price to break out of the upper or lower band. When the price breaks out of the upper band, this may be a signal to buy or enter a long position. When the price breaks out of the lower band, this may be a signal to sell or enter a short position.
For example:
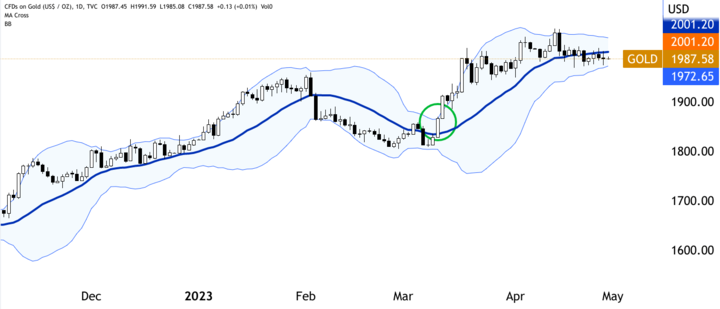
Consider the daily chart of gold CFDs below. The blue line represents a 20-day moving average, while the upper and lower bands represent two standard deviations from the moving average. In early March 2023, gold CFDs broke out of the upper band, indicating a potential buy signal. Traders who bought gold CFDs at this point could potentially profit if the price continues to rise.
3. Fibonacci Retracement Strategy
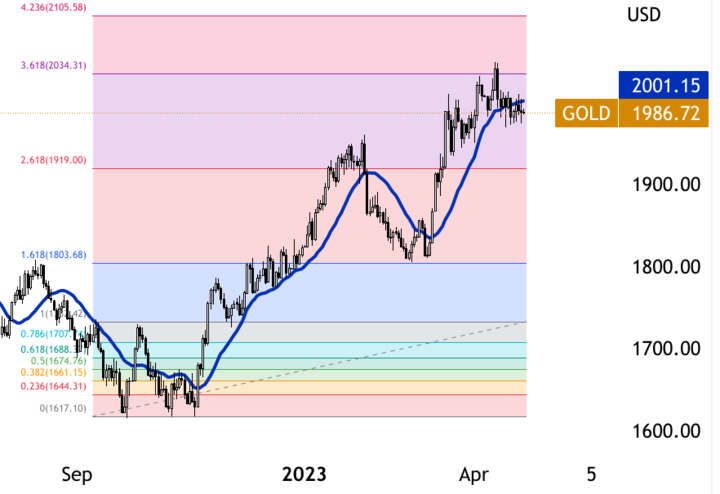
Based on the Fibonacci sequence, the strategy is applied to mark possible levels of support and resistance. The tool consists of horizontal lines corresponding to key Fibonacci ratios (23.6%, 38.2%, 50%, 61.8%, and 100%) drawn between a high and low price.
A popular Fibonacci retracement strategy for gold CFD trading involves looking for the price to bounce off one of the Fibonacci levels. When the price retraces to a Fibonacci level, this may signal to buy or enter a long position if the price bounces off the level. When the price retraces to a Fibonacci level, this may signal to sell or enter a short position if the price breaks below the level.
For example:
Consider the daily chart of gold CFDs below. The extended multicolored lines represent the Fibonacci retracement tool drawn between a high and low price. In March 2023, gold CFDs retraced the 1.618 Fibonacci level and bounced off the level, indicating a potential buy signal. Traders who bought gold CFDs at this point could profit as the price continues to rise.
4. MACD strategy
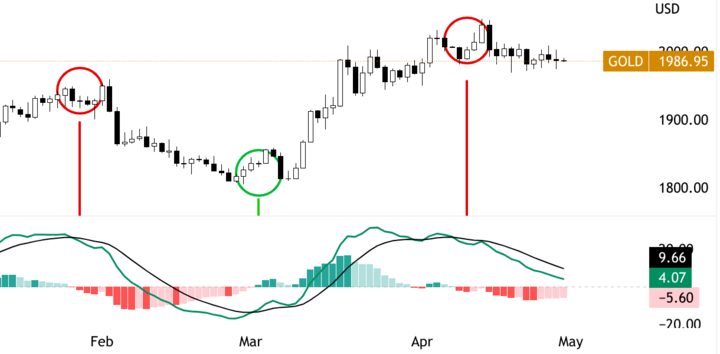
To implement a MACD strategy in gold CFD trading, traders first need to identify the time frame they wish to trade on, typically using a daily or weekly chart. They can then apply the MACD indicator to the chart, which will show the MACD line (the difference between the two moving averages) and the signal line (a nine-period EMA of the MACD).
When the MACD line reaches above the signal line, it signifies a bullish signal, indicating that the trend is reversing and that it is a suitable time to establish a long position. Conversely, when the MACD line arrives below the signal line, it signifies a bearish signal, indicating that the trend is potentially reversing and may be an ideal time to enter a short position.
For example:
The chart displays the price of gold CFDs on a daily time frame, with the MACD indicator overlaid. The green circle shows where the MACD line (teal) crossed above the signal line (black), indicating potential entry points for long positions. The red circles show where the MACD line crossed below the signal line, indicating possible entry points for short positions.
IV. Trading Psychology in Gold CFD Trading Using Technical Analysis
Successful gold CFD trading requires more than just technical analysis; it also requires a solid understanding of trading psychology. Here are some key factors to consider:
A. Sticking to the Trading Plan
A well-defined trading plan is essential, but it's equally important to stick to it. Traders must avoid making impulsive decisions based on their emotions or market hype. This requires discipline and a willingness to stick to the plan, even during market volatility or uncertainty. By doing so, traders can maintain a consistent approach to trading, which can help reduce stress and increase their chances of success.
B. Discipline in executing trades
Discipline is critical when it comes to executing trades. Traders must be able to control their impulses and avoid entering or exiting positions based on fear or greed. Instead, they should follow their trading plan and only make trades when the conditions meet their criteria. This requires patience and the ability to wait for the right opportunities.
C. Managing emotions
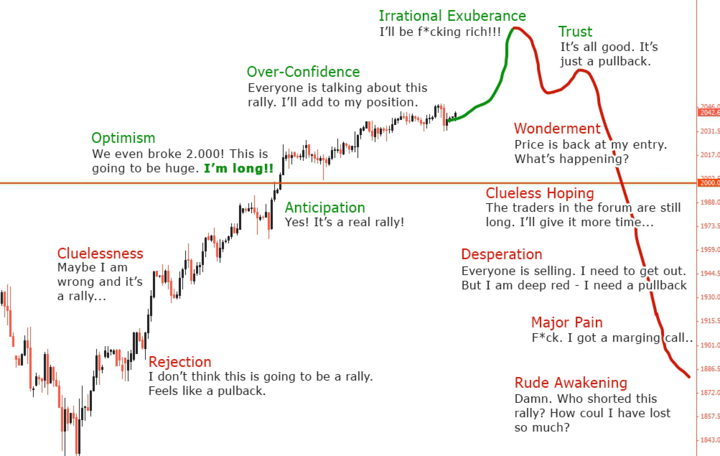
Emotions are crucial in trading psychology, and it's critical to manage them effectively. Fear, greed, and hope can all cloud a trader's judgment and lead to poor decision-making. Traders must learn to recognize and control their emotions and avoid letting them dictate their actions. This can be done by maintaining a positive mindset, staying focused on long-term goals, and avoiding impulsive decisions.
D. Risk management
Risk management is a vital concept in influencing trading psychology. Traders must manage the risk exposure and avoid overextending themselves. This requires setting realistic goals, determining appropriate stop-loss levels, and avoiding taking on too much leverage. By managing their risk effectively, traders can protect their capital and avoid significant losses.
When it comes to gold CFD trading, technical analysis helps identify potential entry and exit points. However, successful trading also requires a solid understanding of trading psychology. By sticking to a well-defined trading plan, maintaining discipline in executing trades, managing emotions effectively, and practicing sound risk management, traders can edge out the chances of success and attain their trading goals.
To illustrate the importance of trading psychology in gold CFD trading, let's consider an example. Suppose a trader has identified a potential entry point for a long position in gold CFDs based on technical analysis. The trader's trading plan calls for entering the position when the price reaches a specific level, with a stop-loss order set at a predetermined level to limit potential losses.
However, the trader starts to feel anxious and uncertain as the price approaches the entry point. They begin to doubt their analysis and consider abandoning their trading plan based on fear and uncertainty. However, by sticking to their plan, maintaining discipline, and managing their emotions, the trader can enter the position as planned and avoid making an impulsive decision based on their feelings.
V. How to Profit from Technical Analysis in Gold CFD Trading
Technical analysis can be a valuable tool for identifying potential opportunities in gold CFD trading. By analyzing charts and identifying trends, traders can identify possible entry and exit points for long or short positions. Here are two ways to profit from technical analysis in gold CFD trading:
A. Opportunities in uptrends and downtrends
When analyzing gold CFD charts, traders can identify trends in price movements. An uptrend is formulated by higher highs and higher lows, while a downtrend emerges from lower highs and lower lows. Traders can use this information to identify potential opportunities for long or short positions.
1. Long positions in uptrends
When the price of gold CFDs is in an uptrend, traders can look for opportunities to enter long positions. This means buying the asset with the expectation that its value will continue to rise. Traders can identify potential entry points by looking for support levels where the price has bounced off and continued to rise. They can also use technical indicators, such as MAs or RSI, to confirm the uptrend and identify potential entry points.
2. Short positions in downtrends
When the price of gold CFDs is in a downtrend, traders can look for opportunities to enter short positions. This means selling the asset with the expectation that its value will continue to decline. Traders can identify potential entry points by looking for resistance levels where the price has reversed and continued to decline. They can also use technical indicators to confirm the downtrend and identify potential entry points.
B. Using technical analysis in conjunction with fundamental analysis
It is important to note that technical analysis should not be used in isolation. Combining technical analysis with fundamental analysis, such as monitoring economic indicators and geopolitical events that may impact the price of gold, can help traders make more informed trading decisions.
Fundamental analysis involves examining economic and financial data, including geopolitical events, to understand the underlying factors that may affect gold prices. For example, political or economic instability in a major gold-producing country could lead to a reduction in supply and an enhancement in demand for gold, leading to a price increase.

Traders should monitor economic indicators such as inflation pace, interest rates, and GDP growth, as these can also impact gold prices. A high inflation rate, for example, may lead investors to purchase gold as a hedge against inflation, driving up the price.
For example, a high inflation rate may lead to an increase in demand for gold as a hedge against inflation, driving up the price. Traders can also monitor political and economic events that may impact gold supply and demand, such as political unrest in major gold-producing countries.
With the configuration of technical and fundamental analysis, traders can develop a logical understanding of the market and make more informed trading decisions. For example, if technical analysis suggests that the price of gold is likely to break out of a trading range and fundamental analysis indicates a positive economic outlook for gold, the trader may decide to enter a long position.
When using technical analysis in conjunction with fundamental analysis, traders should start by monitoring economic indicators and geopolitical events that may impact the price of gold.
After monitoring economic and geopolitical events, traders can use technical analysis to identify possible opportunities. This can include using technical indicators, such as moving averages and oscillators, to identify trends and areas of support and resistance. Traders can also use chart patterns, such as head and shoulders or triangles, to identify potential breakout opportunities.
C. Example of using technical analysis to enter and exit trades
To illustrate an example of using technical analysis to enter and exit trades, consider a scenario where a trader is monitoring the price of gold and economic indicators. The trader notices that the price of gold has been trading in a range between $1,100 and $1,400 per ounce with no clear direction before 2019. However, the trader also notes that the US inflation rate (red in chart) is increasing, which may lead to an increase in demand for gold.
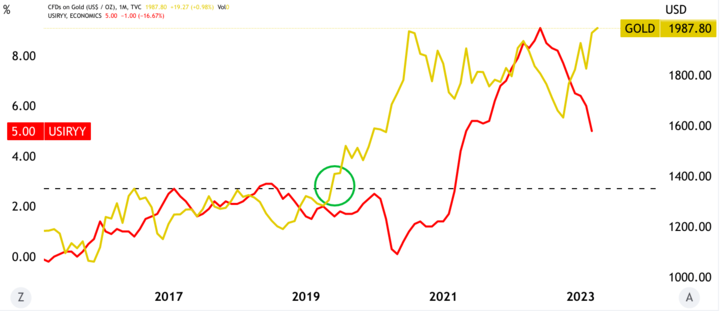
To take advantage of this potential opportunity, the trader decides to use technical analysis to identify a potential breakout. The trader draws a trendline connecting the highs and lows of the price range. If the price of gold breaks above the trendline, the trader may decide to enter a long position, anticipating a continuation of the uptrend.
To manage risk, the trader sets a stop-loss order below the trendline in case the trade does not go as planned. The trader also uses position sizing to ensure that only a tiny percentage of their trading account is at risk on any single trade.
If the price of gold breaks below the trendline instead, the trader may decide to exit the trade, cutting their losses and waiting for a new trading opportunity.
VI. Conclusion
A. Recap of key points
In conclusion, we have explored technical analysis and its application in gold CFD trading. We have discussed key technical indicators such as moving averages, technical indicators like the Relative Strength Index (RSI), Bollinger Bands, Fibonacci Retracement, and MACD, and how to use them for trading gold CFDs. We have also highlighted the importance of trading psychology, sticking to a trading plan, discipline, managing emotions, and risk management. Additionally, we have discussed the potential benefits of incorporating technical analysis with fundamental analysis to maximize profits.
B. Importance of incorporating technical analysis in gold CFD trading
Technical analysis ascertains the future direction of gold CFD prices based on past price and volume data. By incorporating technical analysis, traders can identify trends, support and resistance, and numerous technical indicators to make informed trading decisions. Technical analysis can help traders manage risk, improve the timing of trades, and maximize profits.
C. Potential outcomes of using technical analysis for gold CFD trading
The potential outcomes of using technical analysis for gold CFD trading include identifying profitable trading opportunities, better risk management, and more successful trading decisions. By applying technical analysis, traders can anticipate market movements, identify entry and exit points, and adjust their trading strategies accordingly. Technical analysis can also help traders stay disciplined and focused on their trading plan, which can lead to more consistent profits.


D. Future considerations
For the enrichment of any trading strategy, it is critical to continually evaluate and adjust based on market conditions and new information. As the gold market evolves, new technical analysis tools and strategies may emerge, and it is vital to stay up-to-date with these developments. Additionally, traders should always consider the potential risks and rewards of using technical analysis and incorporate it in conjunction with other analysis techniques for a well-rounded trading approach.
*Disclaimer: The content of this article is for learning purposes only and does not represent the official position of VSTAR, nor can it be used as investment advice.