Aggressive rate hikes to reduce inflation are working, markets remain excited
Since the start of the current rate hike cycle in March 2022, the Fed has raised rates 11 times, with a cumulative rate hike of 525 basis points. This round of rate hike cycle, high inflation is the main stimulus, and the rate hike at the same time shrinking table, strong absorption of market liquidity. At the beginning of the rate hike, the market generally expects that due to the rate hike will cause the U.S. 2023 GDP growth rate year-on-year dropped significantly, or even fell into recession, and due to the strong demand side after the epidemic, the level of inflation will remain high after the top. And the U.S. Department of Commerce recently released data showing that U.S. real GDP in the second quarter grew by 2.4% year-on-year, an increase that exceeded the 2% increase in the first quarter and far exceeded the market expectations of 1.8%, while the Federal Reserve's most concerned about the PCE price index in the second quarter grew by 2.6%, a significant slowdown compared with the previous 4.1%. And the core PCE price index, which excludes food and energy, rose 3.8%, also well below the previous reading of 4.9%. From the current data, the Fed's tightening monetary policy did not cause a recession, the U.S. economic resilience is still in, and the Fed's main target of inflation has accelerated the downward trend, while personal consumption expenditures growth, the labor market is active, undoubtedly for the claim of a soft landing to provide great support.
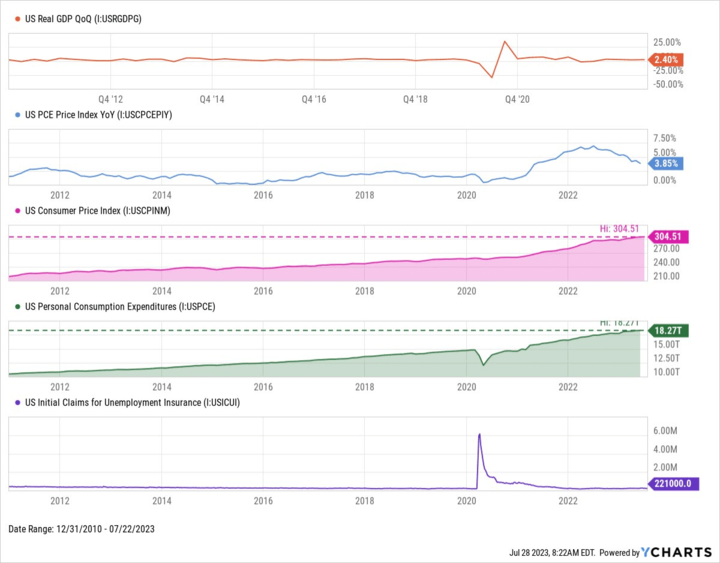
Chart: US Preliminary Annualized Quarterly GDP/PCE/CPI/Personal Consumption Expenditures/Initial Jobless Claims
Source: Ycharts
Since the establishment of the modern Federal Reserve in the 1950s, there have been 13 full cycles of interest rate hikes, including eight due to inflation, and interest rate hikes appear to have become an important monetary policy for controlling inflation.
Given the different causes of inflation, the policies of successive Federal Reserve chairmen also have their own characteristics, the results are also different. Historically, only Volcker succeeded in curbing the "Great Inflation", but the strong austerity policy also led to a significant increase in the unemployment rate, the sharp appreciation of the dollar, triggering the "Latin American debt crisis"; Greenspan also managed inflation well, so that it remained stable and moderate level. Greenspan also managed inflation well, keeping it at a stable and moderate level, but the tenure also saw the "stock market Internet bubble" and "real estate bubble". Therefore, whether the Fed can identify the bubble and successfully control inflation without causing a crash is historically an extremely difficult task.
Since the start of the current rate hike cycle, the US recession indicators that analysts are most concerned about: the inverted Treasury yield curve and the LEI, a leading economic indicator, turning negative, both point to a recession, but the economic data points to a soft landing and the financial markets remain frenzied.
The U.S. stock market in the first half of this year showed overheating, especially with Nvidia as the representative of the technology stocks, take advantage of the AI new technology cycle of the east wind rocketing up, Wall Street shorts have been squeezed out.
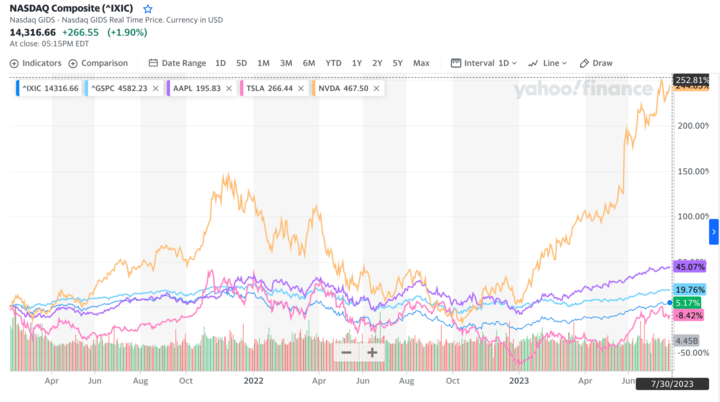
Chart: Nasdaq vs. S&P 500 vs. Apple vs. Tesla vs. Nvidia
Source: Yahoo Finance
Has the use of monetary policy to recycle liquidity failed?
- The Federal Reserve, as the central bank of the United States, has a variety of monetary policy tools that it uses to adjust the money supply, the level of interest rates, and the functioning of financial markets in order to achieve its macroeconomic objectives. Common monetary policy tools include
- Federal funds rate: This is one of the Federal Reserve's most important monetary policy tools. It is the interest rate at which banks lend money to each other on a short-term basis. By adjusting the federal funds rate, the Federal Reserve can directly affect other short-term interest rates, thereby affecting overall economic activity.
- Reserve requirements: The Federal Reserve requires commercial banks to hold a certain percentage of their deposits as reserves. By adjusting reserve requirements, the Fed can control the borrowing capacity of commercial banks and the money multiplier.
- Open Market Operations: The Federal Reserve influences the money supply by buying or selling government bonds. Buying bonds increases the bank's reserves and increases the money supply, while selling bonds does the opposite. Open market operations are the Fed's primary means of changing the balance sheet, buying bonds that expand the balance sheet, selling bonds that shrink the balance sheet.
- Interest on excess reserves: The Federal Reserve pays commercial banks interest on their excess reserves. By adjusting this rate, the Fed can influence the amount of reserves that banks are willing to keep in Fed accounts.
- Quantitative Easing (QE): In a recession or financial crisis, the Federal Reserve may resort to large-scale purchases of government bonds or mortgage-backed securities to further increase the money supply and stimulate the economy.
- Forward guidance: Through public statements or announcements, the Federal Reserve indicates to the markets and the public the direction it expects monetary policy to take in order to influence long-term interest rates and expected inflation.
These monetary policy tools can be used individually or in combination to adapt to different economic environments and respond to different economic challenges. The Federal Reserve's monetary policy goal is full employment and price stability, to achieve this goal there is an intermediate goal, is to manage the federal funds rate, that is, the interbank money market overnight lending rate, interest rate hike means to raise the federal funds rate ceiling, by raising the cost of short-term capital flows to recover the funds circulating in the market, commonly known as "water", and its counterpart is "water". This is commonly referred to as "collecting water", which is the opposite of "releasing water".
Interest rate increases and decreases are accomplished primarily through the management of the overnight reverse repurchase rate, the excess reserve ratio, and the discount rate, rather than through the Federal Reserve's direct setting of the federal funds rate. For example, if the overnight reverse repurchase rate is higher than the federal funds rate, market participants may find that they can earn a higher return by participating in overnight reverse repurchase agreements. As a result, more funds may flow into the overnight reverse repo market (where the Federal Reserve acts as a seller of securities) in search of a higher interest rate, thereby reducing liquidity in the market. Thus, the overnight reverse repo rate typically acts as a ceiling on the federal funds rate.
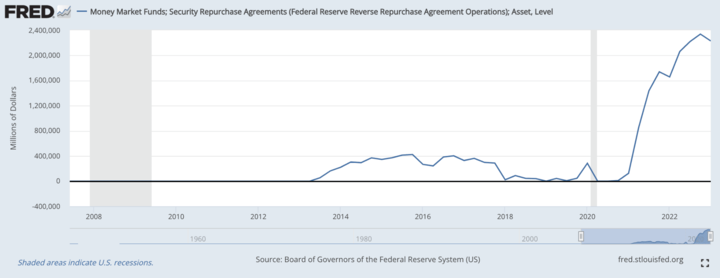
Chart: Money market funds and overnight reverse repo assets
Source: FRED
As expectations of recession grew during the tapering period, U.S. Treasuries sold off, prices fell, and despite rising yields, inflation was high, so real yields were not as good as they could have been. As a result, money also flowed into low-risk money market funds and the overnight reverse repo market.
This round of rate hike cycle, Powell at the same time initiated the tapering to strengthen the recovery effect. Since the financial crisis in 2008, the Fed has carried out three rounds of large-scale quantitative easing to expand the table.
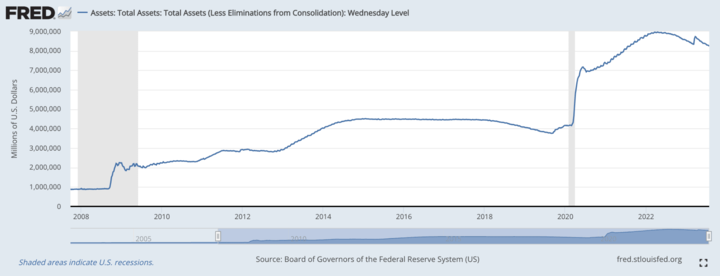
Chart: Federal Reserve Asset Table
Source: FRED
Since rate hikes and tapering are designed to recycle liquidity, why does the market still seem to have plenty of liquidity? The S&P500 total return has risen as the CPI has risen since 2020, and despite a sharp increase in the Federal Funds rate since March 2022, the S&P500 return is still staggering.
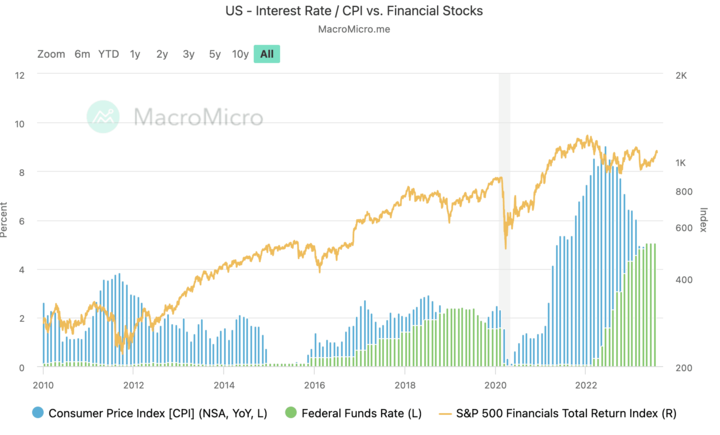
Chart: U.S. - Federal Funds Rate, CPI vs. S&P 500 Total Return
Source: MarcoMicro
In and out? The countervailing power of fiscal policy
Although the Federal Reserve is the maker of monetary policy, the issuance of currency must work with the Treasury, and the circulation of currency is closely related to fiscal policy. The United States of America's fiscal policy is a complex and wide range of policy areas, the government can be based on economic conditions and the need to take different fiscal policy measures to achieve economic growth, employment increase and stabilize the financial markets and other objectives. Its content includes tax policy, expenditure policy, fiscal budget, fiscal stimulus plan, debt management, social welfare programs and so on.
In 2020, in response to the epidemic's impact on financial markets and the real economy, the Federal Reserve and the Treasury undertook a round of major easing: the Fed cut interest rates to 0%, engaged in mega-quantitative easing, and expanded its balance sheet from $4 trillion before the epidemic to $9 trillion by early 2022. At the same time, the U.S. Treasury provided $5 trillion in financial assistance over the course of a year to households, businesses, and state and local governments. This quantitative easing accumulated more than $2 trillion of excess savings for the US household sector, leading to a rapid and significant increase in US M2 growth.
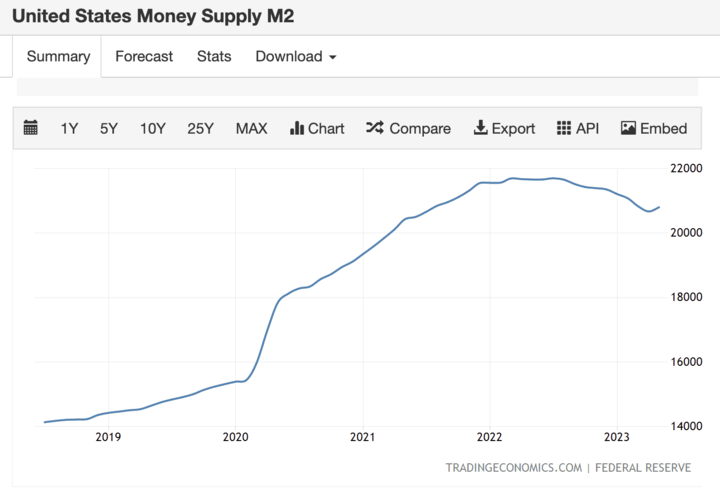
Chart: US M2 Growth
Source: tradingeconomics
Tight or loose market liquidity can affect market stability and asset price volatility. The Treasury General Account (TGA) is an account maintained by the U.S. Department of the Treasury to hold the government's cash receipts and funds to pay federal expenditures.Increases or decreases in the TGA can have a significant impact on market liquidity, particularly during periods of economic policy adjustments and changes in fiscal activity.
When the TGA balance increases, it means that government revenues exceed expenditures, resulting in an increase in the account balance. Such a situation will absorb liquidity from the market because the government will deposit funds in the TGA instead of putting them in the market. Therefore, an increase in the TGA reduces the amount of cash available in the market, resulting in tighter liquidity in the market.
Conversely, a decrease in the TGA balance means that the government is spending more than it takes in, resulting in a lower account balance. The government must withdraw funds from the TGA to meet its spending needs. Such a situation will inject liquidity into the market as the government withdraws funds from the TGA, increasing the amount of cash available in the market, resulting in a more liquid market.
Since the start of the current rate hike cycle in March 2022, the Treasury's TGA account has been declining and liquidity has been injected into the market, contrary to the Fed's desire to achieve a water recycling effect. As a result, we believe that the Fed's monetary policy has been partially offset by fiscal policy, and liquidity recovery has been much less effective.
The effect of interest rate hikes has a lag, and more prudent policies are needed to prevent a recession
There is a very complex transmission mechanism for monetary policy to achieve its regulatory effect on the economy, and therefore it takes time for monetary policy to actually reach all aspects of the economy. High interest rates affect corporate profits, consumer confidence, asset prices, investment behavior, and imports and exports, so current data on economic prosperity do not mean that it will not be affected in the future.
Rising interest rates increase the cost of mortgages, financing and other financial transactions, and affect the rates at which consumers pay their credit cards and other forms of debt. In the first quarter of this year, U.S. household debt totaled more than $17 trillion, a record high. Rising borrowing rates have led to rising interest payments on borrowed money, and household debt service as a percentage of disposable personal income has continued to rise.
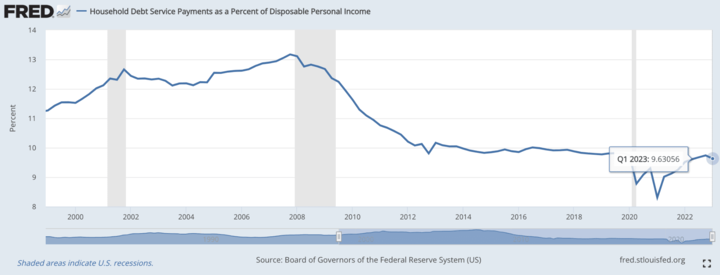
Figure: Household debt service as a percentage of disposable personal income
Source: FRED
While bank credit to business and industry has tightened due to high interest rates, credit card accounts have continued to grow, and bank lending and leasing have increased despite this tightening, the U.S. private deposit rate remains low, the proportion of people living on borrowed money is likely to increase, and the financial vulnerability of households and firms is rising.
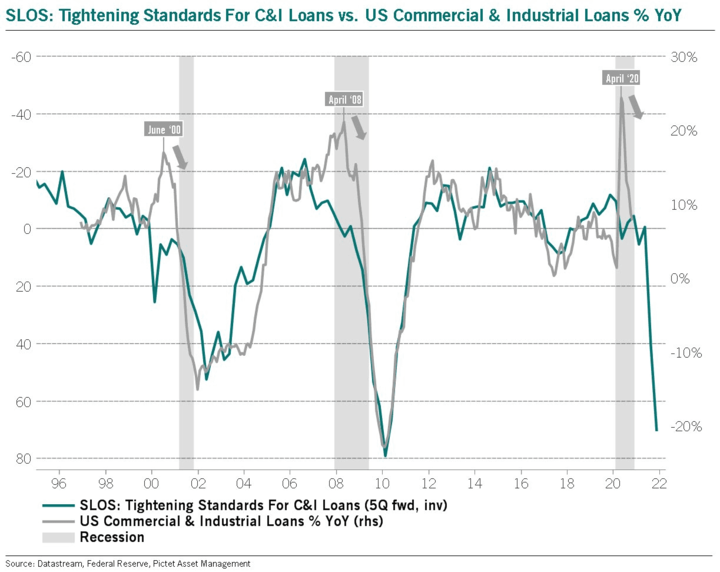
Chart: Extent of commercial and industrial credit squeeze vs. annualized borrowing rate, recessionary periods in grey
Source: twitter @BittelJulien
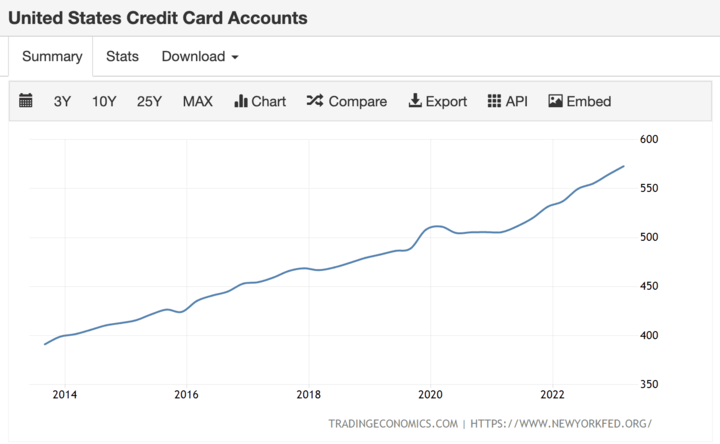
Chart: US Credit Card Account Growth
Source: tradingeconomics
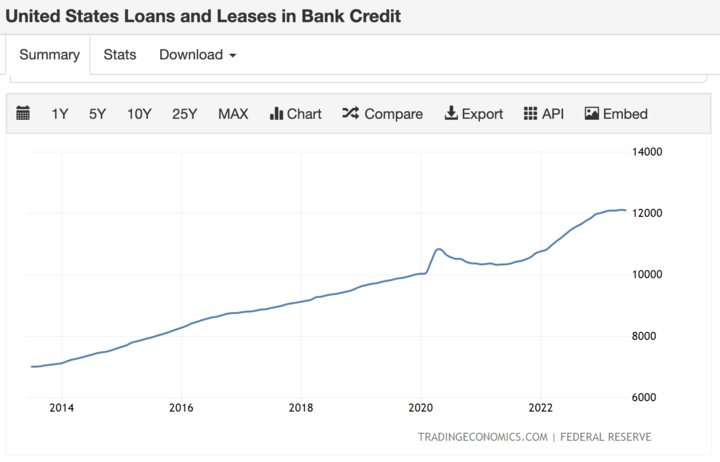
Chart: US bank lending and leasing growth
Source: tradingeconomics
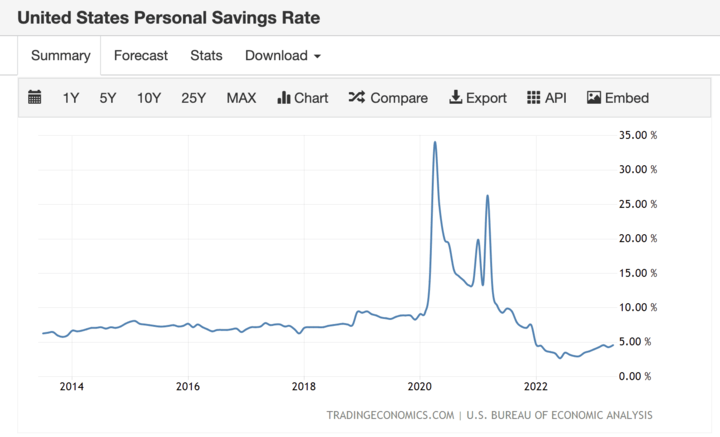
Chart: U.S. private deposit rate
Source: tradingeconomics
The P/E ratio reflects the current market valuation (i.e., how much money is available) and corporate earnings (i.e., the market fundamentals). Inflation rises and monetary policy tightens, causing corporate earnings to fall. The market can be downgraded and the P/E ratio can fall.
Historically, as the charts show, a top in inflation leads to the bottom of a market pullback, and a return of market confidence after austerity ends drives the market higher. So the next move in inflation remains important, and accelerating falling inflation does not always lead to a good outcome.
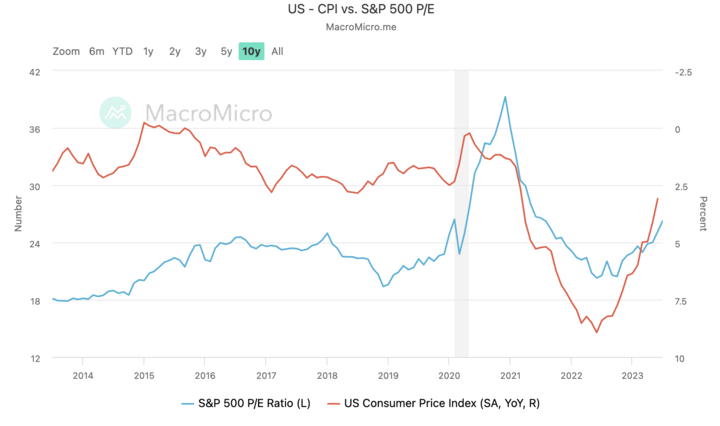
Chart: US CPI vs. S&P 500 P/E
Source: MarcoMicro
Start of a bull market or structural bear market?
Bull and bear markets are a natural part of the business cycle and, to some extent, a monetary phenomenon. As the bull economy recovers, market demand increases, and economic activity grows strongly, capacity constraints lead to higher inflation, which leads to tighter monetary policy, which raises the cost of capital, which leads to lower expectations of future growth, and stock prices adjust downward to meet expectations, entering a bear market cycle, and so on. Rising interest rates tend to trigger bear markets, and it usually takes a period of interest rate cuts to reverse the above process. The causes, forms, sizes and manifestations of bear markets also vary widely.
Cyclical bear markets are more common, characterized by rising interest rates, economic recession and falling earnings expectations, and are typical of financial cycles driven by economic cycles. In contrast to the current round of interest rate hikes, the economic and financial market performance, the rise in interest rates has so far not caused a recession or a fall in stock prices, so perhaps what we are experiencing or will experience is a different kind of bear market, a structural bear market. Bear markets triggered by structural imbalances and the unwinding of financial bubbles are often followed by price shocks such as deflation. This is the deeper and longer lasting bear market.
Cyclical bear markets recover from falling interest rates; loose monetary policy is a prerequisite for restarting growth and pushing up stock prices; and low interest rates provide an incentive for companies to resume business growth and increase operating leverage. Structural bear markets, on the other hand, are deeper, more intense and more volatile than cyclical bear markets.


Structural bear markets are triggered by major imbalances in the economy, often rooted in a combination of new technology cycles and falling capital costs, accompanied by bursting financial bubbles and severe overvaluation due to rising interest rates or a tighter credit environment, and also manifested in a significant increase in corporate and private sector debt and imbalances in savings and investment, increasing the vulnerability to economic shocks. As previously analyzed, these phenomena are unfolding. The unwinding of such imbalances takes a long time, cash flows must be used to rebuild balance sheets, and savings rates must rise as a result, which is why structural bear markets tend to last longer than cyclical ones.
Interest rates and inflation tend to be low before many structural bear markets begin, leading to investment fever and high stock prices. Precisely because rising interest rates often do not cause stock prices to fall in structural bear markets, falling interest rates do not necessarily solve the problem. Given that the price of money is already low before a bear market develops, economic recovery depends more on the availability and demand for money than on its price, and requires the reduction of excess capacity and a future increase in the rate of return on capital to a level high enough to stimulate investment before a structural bear market can end.
Monetary policy is a blunt instrument; changes in interest rates affect the entire economy and cannot be targeted at a narrow set of markets or a few overheated sectors. Monetary policy, together with regulation and macroprudence, is an effective tool to address risks to financial stability. At the same time, we need to pay attention to the side effects and lagged effects of interest rate hikes, keep an eye on changes in economic indicators such as inflation, the labor market and the debt market, and identify turning points in the broader cycle.