Introduction
Gas Contract for Difference (CFD) trading is a popular method for investors to speculate on the price movements of natural gas without owning the physical commodity. To make informed trading decisions, analyzing gas CFD charts is crucial. Chart analysis provides valuable insights into historical price trends, volatility, market sentiment, market trends, and price patterns, enabling you to make informed trading decisions. By understanding how to interpret these charts, you can gain an edge in your trading strategy.
To ensure accurate chart analysis, it is essential to use reliable charting software or platforms that provide real-time data and a range of technical analysis tools. Additionally, staying up to date with the latest news and market developments is crucial for making well-informed trading decisions.
Types of Gas CFD Charts
When analyzing gas CFD charts, you'll come across different chart types that provide valuable insights into price movements and market trends. Line charts offer simplicity, while bar charts provide comprehensive data. Candlestick charts offer detailed insights into price patterns and reversals.
Familiarizing yourself with these chart types and understanding each chart type's characteristics and advantages/disadvantages will enhance your ability to analyze gas CFD charts effectively and make well-informed trading decisions.
Line Charts
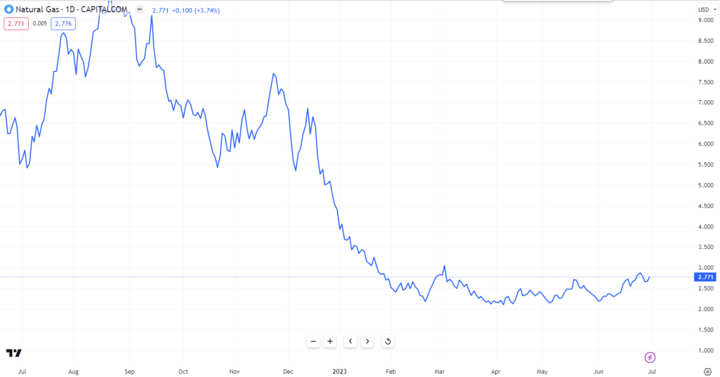
Image Source: Tradingview
Line charts depict the gas price over a specific period by connecting the closing prices. They offer a simplified view of price trends, making it easy to identify overall direction. However, they lack detailed information about intraday price fluctuations.
Bar Charts
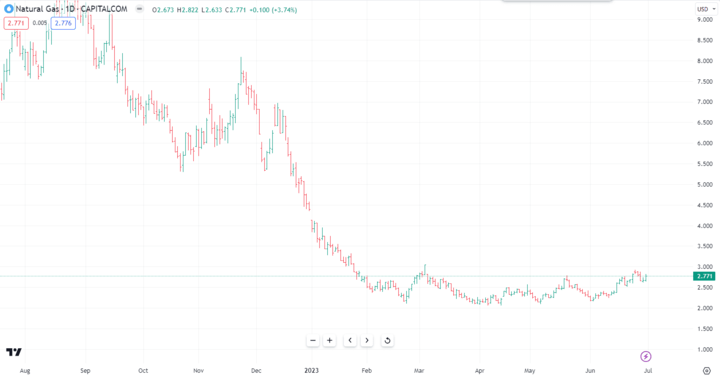
Image Source: Tradingview
Bar charts display price information using vertical bars. Each bar represents a specific time interval and includes the high, low, opening, and closing prices. Bar charts provide a comprehensive view of price ranges and volatility. However, they can be overwhelming for beginners due to the amount of data presented.
Candlestick Charts
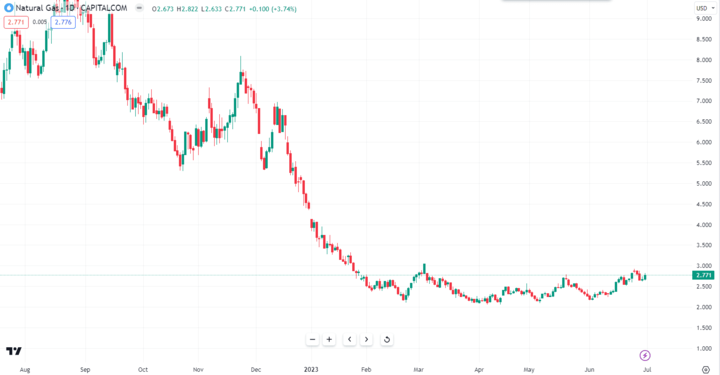
Image Source: Tradingview
Candlestick charts are widely used in gas CFD analysis. They offer a visual representation of price movements through candlestick-shaped patterns. Each candlestick represents a specific time period and includes the opening, closing, high, and low prices.
Candlestick charts provide detailed information about price reversals, market sentiment, and patterns. They are particularly useful for identifying support and resistance levels. However, interpreting candlestick patterns requires some knowledge and practice.
Gas CFD Chart Analysis Techniques
To effectively analyze gas CFD charts, it's important to employ various techniques that can provide valuable insights into market trends and potential trading opportunities. Here are five key techniques to consider:
Trend Analysis
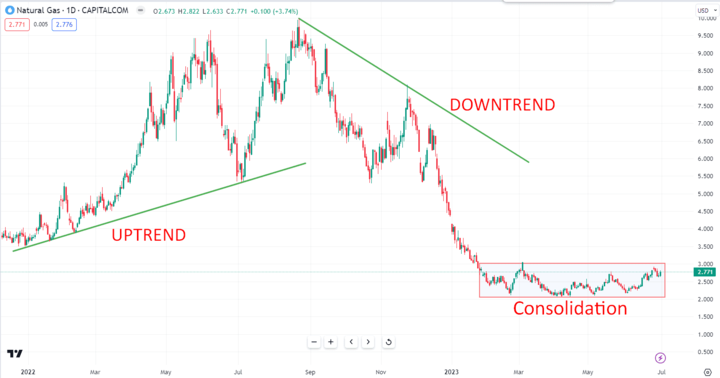
Image Source: Tradingview
Trend analysis involves examining price movements over time to identify the prevailing direction of the gas market. By analyzing trends, you can determine whether the market is in an uptrend (rising prices), downtrend (falling prices), or consolidation (sideways movement).
This technique helps you align your trades with the overall market direction, increasing the likelihood of successful outcomes.
Support and Resistance Levels
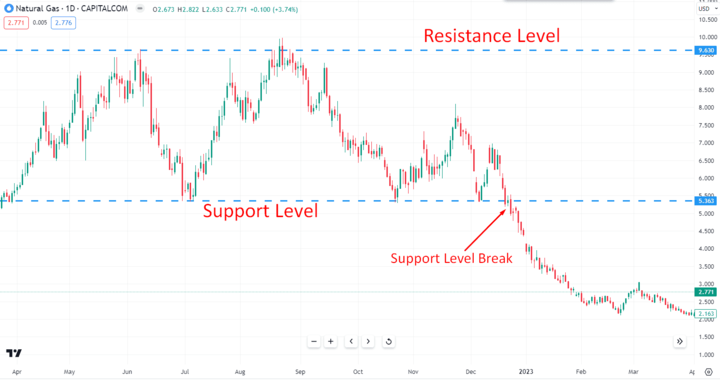
Image Source: Tradingview
Support and resistance levels are specific price levels where gas prices tend to encounter buying or selling pressure. Identifying these levels on a chart helps you anticipate potential price reversals or breakouts. Support levels act as a floor, preventing prices from declining further, while resistance levels act as a ceiling, capping upward price movements.
Monitoring these levels allows you to make informed trading decisions based on potential price reactions.
Moving Averages
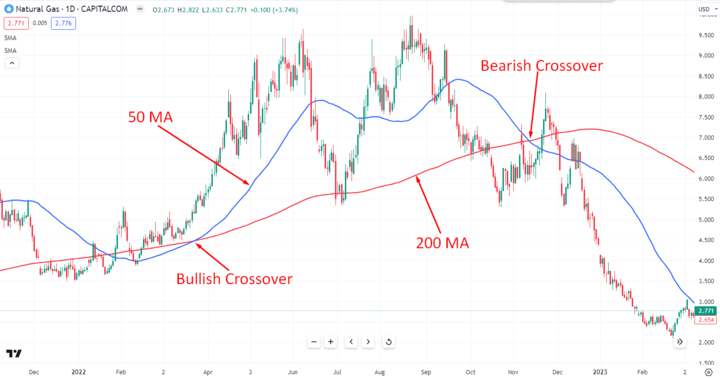
Image Source: Tradingview
Moving averages smooth out price data by calculating the average price over a specific period. They help identify trend reversals and provide dynamic support and resistance levels. Commonly used moving averages include the 50-day and 200-day moving averages.
When the shorter-term moving average crosses above or below the longer-term moving average, it can signal potential trend changes and entry or exit points for trades.
Relative Strength Index (RSI)
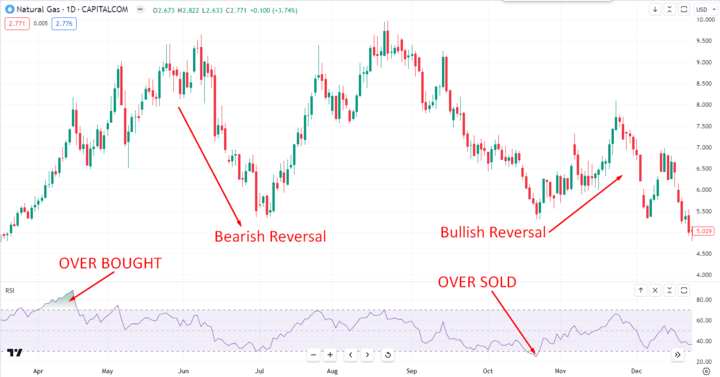
Image Source: Tradingview
The RSI is a momentum oscillator that measures the speed and change of price movements. It provides insights into whether a gas CFD is overbought or oversold, indicating potential trend reversals. An RSI reading above 70 suggests overbought conditions, indicating a potential price correction or reversal to the downside.
Conversely, an RSI reading below 30 suggests oversold conditions, indicating a potential price bounce or reversal to the upside.
Bollinger Bands
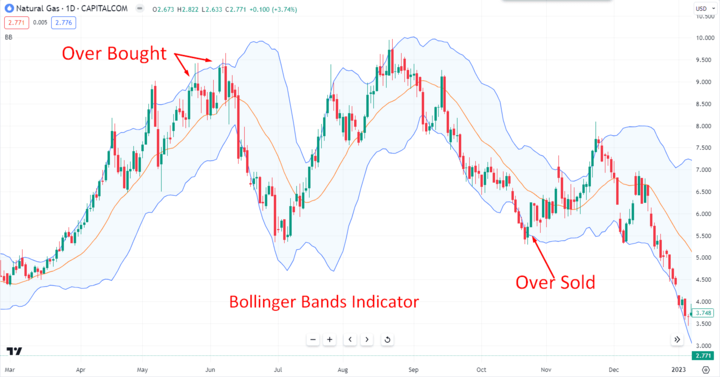
Image Source: Tradingview
Bollinger Bands consist of a centerline (usually a moving average) and two standard deviation bands that expand and contract based on market volatility. These bands help identify periods of low volatility followed by potential breakouts or trend reversals. When the gas price approaches the upper band, it suggests overbought conditions, while approaching the lower band indicates oversold conditions.
Bollinger Bands help traders anticipate potential price movements and adjust their strategies accordingly.
Gas CFD Chart Patterns
Gas CFD charts exhibit various patterns that can provide valuable insights into future price movements. These chart patterns will enhance your technical analysis skills, which will help you identify potential trading opportunities and make informed decisions. Here are four important gas CFD chart patterns to be aware of:
Bullish and Bearish Patterns
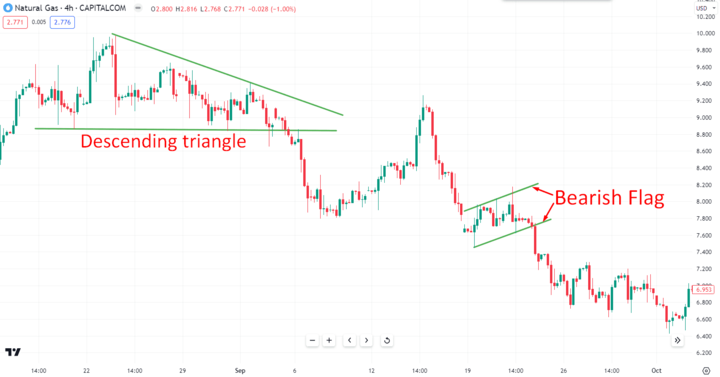
Image Source: Tradingview
Bullish patterns indicate potential upward price movements, while bearish patterns suggest potential downward price movements. These patterns often form after periods of consolidation or correction. Bullish patterns include the ascending triangle and bullish flag, while bearish patterns include the descending triangle and bearish flag.
Identifying these patterns can help you anticipate future price trends and plan your trades accordingly.
Continuation and Reversal Patterns
Continuation patterns indicate a temporary pause in the prevailing trend before the price resumes its previous direction. Examples of continuation patterns include the pennant and the symmetrical triangle.
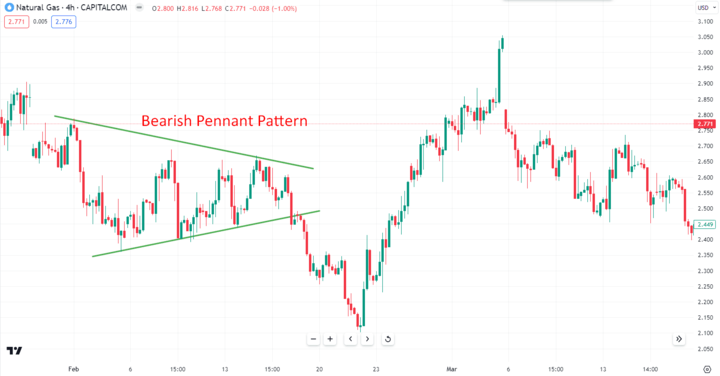
Image Source: Tradingview
Reversal patterns, on the other hand, suggest a potential change in the current trend. Common reversal patterns include the head and shoulders and double top/bottom patterns. Recognizing these patterns can assist you in timing your entries or exits.
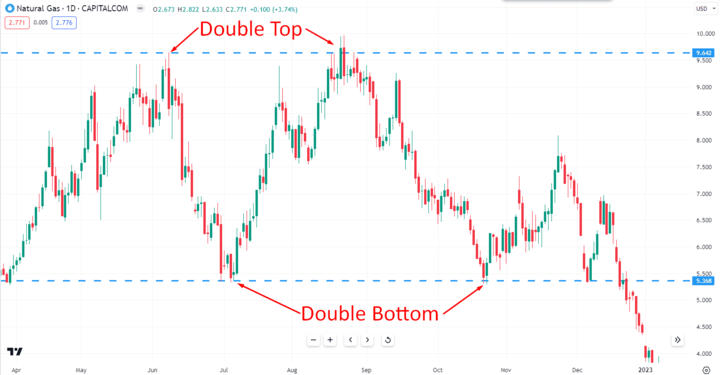
Image Source: Tradingview
Head and Shoulders Pattern
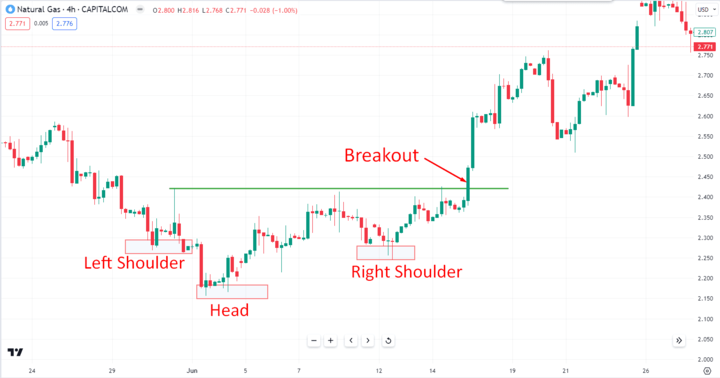
Image Source: Tradingview
The head and shoulders pattern is a popular reversal pattern that often indicates a shift from bullish to bearish sentiment. It consists of three peaks, with the middle peak (the head) higher than the two surrounding peaks (the shoulders). This pattern suggests that buyers are losing control, and a potential downward trend may follow.
Traders often look for a break below the neckline, which confirms the pattern and provides a potential entry point for short trades.
Double Top/Bottom Pattern

Image Source: Tradingview
The double top/bottom pattern is another reversal pattern that occurs after an extended uptrend or downtrend. A double-top pattern forms when the price reaches a resistance level twice and fails to break above it, indicating a potential reversal to the downside.
Conversely, a double bottom pattern forms when the price reaches a support level twice and fails to break below it, suggesting a potential reversal to the upside. These patterns can be used to identify potential trend reversals and plan your trades accordingly.
Gas CFD Chart Indicators
Gas CFD chart analysis relies on various indicators to provide insights into price trends and potential trading opportunities. These indicators help you make informed decisions by analyzing historical price data and identifying patterns. Here are three important indicators commonly used in gas CFD chart analysis:
MACD (Moving Average Convergence Divergence)
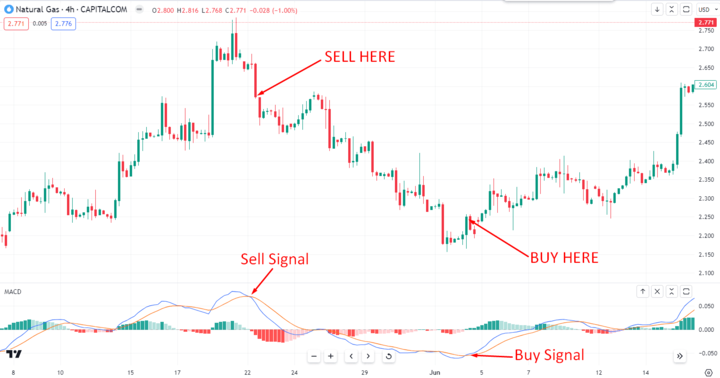
Image Source: Tradingview
MACD is a popular trend-following indicator that helps identify potential trend reversals and generate buy or sell signals. It consists of two lines: the MACD line and the signal line. When the MACD line crosses above the signal line, it suggests a bullish signal, indicating a potential buying opportunity.
Conversely, when the MACD line crosses below the signal line, it indicates a bearish signal, suggesting a potential selling opportunity. Traders often use MACD and other indicators to confirm trade entries and exits.
Stochastic Oscillator
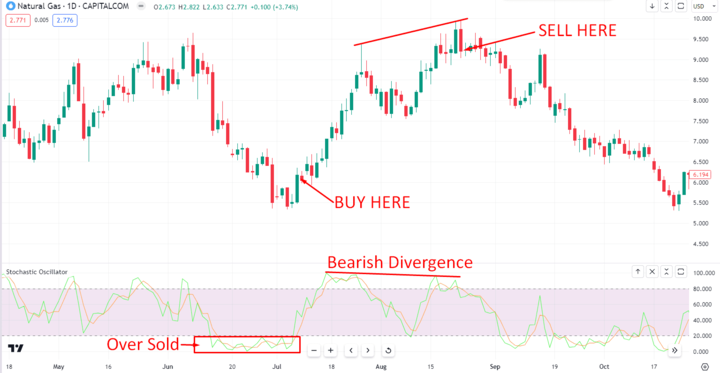
Image Source: Tradingview
The stochastic oscillator is a momentum indicator that compares the current closing price of an asset to its price range over a specific period. It helps identify overbought and oversold conditions, indicating potential trend reversals. The oscillator consists of two lines: %K and %D.
Readings above 80% suggest overbought conditions, while readings below 20% suggest oversold conditions. Traders often look for bullish or bearish divergence between the price and the stochastic oscillator to anticipate trend reversals and potential entry or exit points.
Fibonacci Retracement
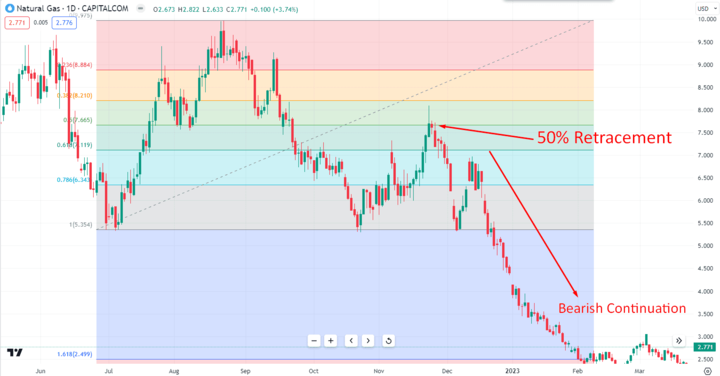
Image Source: Tradingview
Fibonacci retracement levels are horizontal lines that indicate potential support and resistance levels based on the Fibonacci sequence. Traders use these levels to identify potential price reversals or areas of consolidation. The common retracement levels are 23.6%, 38.2%, 50%, 61.8%, and 78.6%.
When the price retraces to these levels and shows signs of a reversal, traders may consider entering or exiting trades. Fibonacci retracement levels can be used in conjunction with other indicators and chart patterns to confirm trading decisions.
Gas CFD Chart Analysis Strategies
Gas CFD chart analysis is a valuable tool for making informed trading decisions and understanding different trading strategies, and will help you to effectively utilize gas CFD chart analysis to capitalize on price movements.
Each of these strategies has its own advantages and considerations. Hence, choose a strategy that aligns with your trading style, risk tolerance, and time commitment. Here are three common strategies used by traders:
Swing Trading
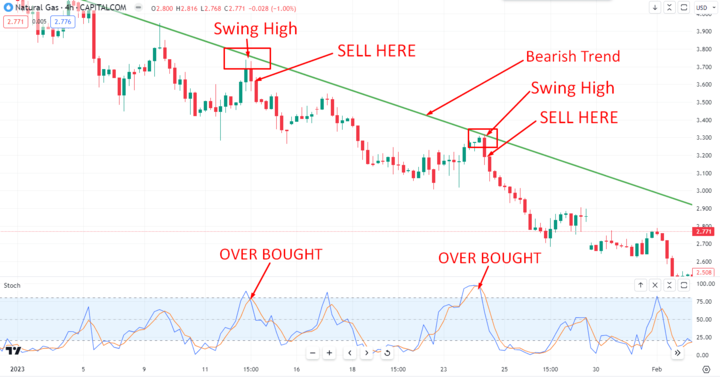
Image Source: Tradingview
Swing trading involves capturing short-to-medium-term price swings within an overall trend. Traders look for opportunities to enter trades when the price is about to reverse from a support or resistance level. Gas CFD chart analysis helps identify swing trading opportunities by analyzing chart patterns, trendlines, and indicators.
It's important to set clear entry and exit points based on the analysis and manage risk with stop-loss orders.
Day Trading
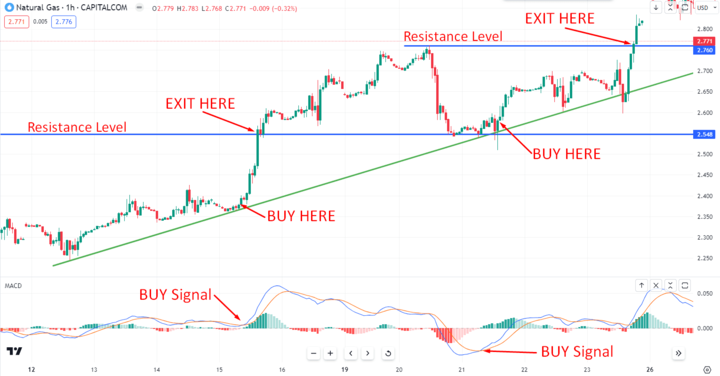
Image Source: Tradingview
Day trading is a strategy where traders enter and exit positions within a single trading day. They take advantage of intraday price volatility to profit from short-term price movements. Gas CFD chart analysis plays a crucial role in day trading by identifying patterns, support and resistance levels, and key price levels.
Traders use technical indicators and real-time data to make quick decisions and execute trades. Risk management, discipline, and having a solid trading plan are essential for successful day trading.
Position Trading
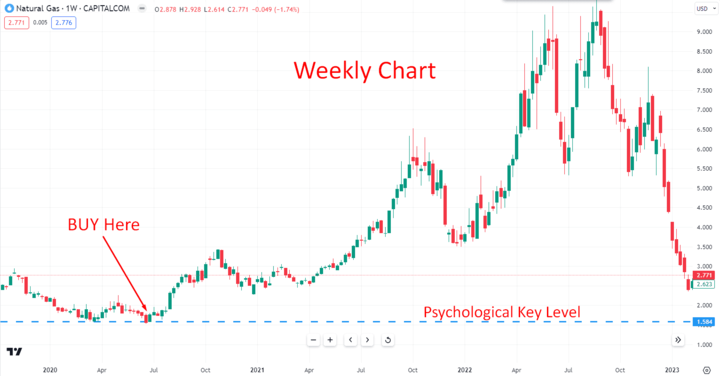
Image Source: Tradingview
Position trading is a long-term strategy where traders hold positions for weeks, months, or even years. It involves identifying major trends in gas prices and taking positions based on fundamental and technical analysis. Gas CFD chart analysis helps identify the overall trend and potential entry points.
Traders use longer time frames, such as daily or weekly charts, to make informed decisions. Position trading requires patience, as trades are held for a more extended period, and risk management is crucial to protect against adverse price movements.
How to Profit from Analyzing Gas CFD Charts
Analyzing gas CFD charts can provide valuable insights into maximizing your profitability and making profitable trading decisions. The following techniques are :
Setting Profit Targets and Stop-Loss Orders
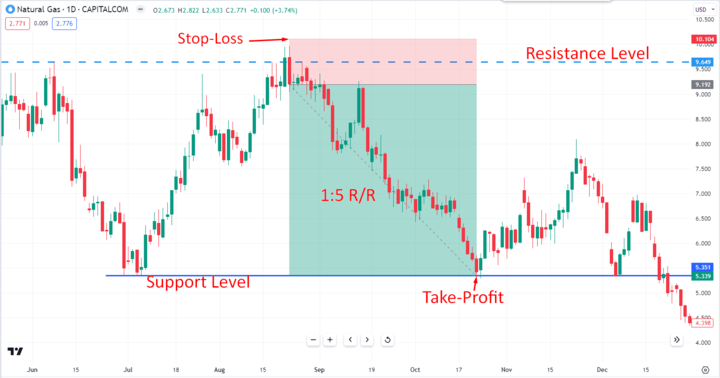
Image Source: Tradingview
Setting profit targets helps you define your desired level of profit and exit the trade when it is achieved. Similarly, stop-loss orders help limit potential losses by automatically closing your position if the price moves against you. Gas CFD chart analysis can assist in identifying suitable profit targets and stop-loss levels based on key support and resistance levels, chart patterns, and technical indicators.
You can maintain a disciplined approach and protect your capital by setting these orders.
Risk Management Techniques
Implementing effective risk management techniques is crucial for long-term success in gas CFD trading. This involves determining the appropriate position size based on your risk tolerance and the trade's potential risk-reward ratio. Risk management also includes diversifying your portfolio, avoiding excessive leverage, and monitoring your trades closely.
By carefully managing risk, you can protect your capital from significant losses and create a sustainable trading strategy.
Trading Psychology and Discipline

Image Source: Unsplash
Trading psychology plays a vital role in profitably analyzing gas CFD charts. Emotions such as fear, greed, and impatience can lead to irrational decision-making and undermine your trading strategy. It is essential to remain disciplined, follow your trading plan, and not let emotions dictate your actions.
Maintaining a positive mindset, managing stress, and staying patient during market fluctuations are key aspects of successful trading. Gas CFD chart analysis can provide objective insights, but your discipline and psychological resilience will ultimately lead to profitable outcomes.
Gas CFD Chart Analysis Tools
When it comes to analyzing gas CFD charts, having the right tools can significantly enhance your trading experience. Here are three popular tools used in gas CFD chart analysis:
TradingView
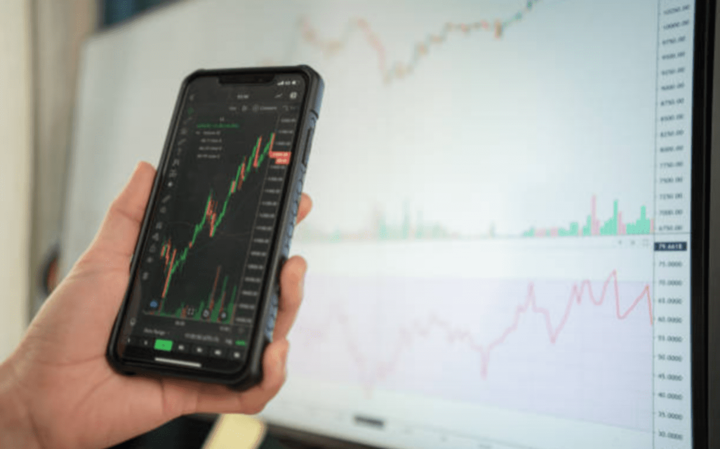
Image Source: Unsplash
TradingView is a powerful online platform that provides advanced charting capabilities. With a user-friendly interface and a wide range of technical indicators, chart types, and drawing tools, TradingView enables you to conduct comprehensive gas CFD chart analysis. You can customize your charts, apply various indicators, and save your analysis for future reference.
TradingView also offers a social aspect, allowing you to share ideas and collaborate with other traders. Its intuitive design and extensive features make it a valuable tool for both beginners and experienced traders.
MetaTrader 4 / 5

Image Source: Metatrader4
MetaTrader is a popular trading platform widely used by traders worldwide. It offers robust charting capabilities, real-time market data, and a wide range of technical indicators. MetaTrader allows you to analyze gas CFD charts using multiple timeframes, apply custom indicators, and execute trades directly from the platform.
The platform's user-friendly interface and extensive functionality make it a preferred choice for many traders.
VSTAR App


Introducing VSTAR, a powerful mobile application specifically designed for gas CFD chart analysis. VSTAR combines cutting-edge technology with user-friendly features to provide you with a seamless trading experience. With VSTAR, you can access real-time gas CFD charts, apply technical indicators, and analyze market trends from the convenience of your mobile device.
The app offers a range of tools to help you identify potential trading opportunities and make informed decisions. Whether you are a beginner or an experienced trader, VSTAR's intuitive interface and comprehensive features make gas CFD chart analysis simple and efficient.
Stay updated with the latest market information, set price alerts, and easily execute trades using the VSTAR App.
Conclusion
Gas CFD chart analysis plays a vital role in making informed trading decisions and generating profits in the dynamic gas market of 2023. By analyzing gas CFD charts, you can identify trends, patterns, and potential price movements, significantly enhancing your trading strategy.
Remember, success in gas CFD trading requires dedication, discipline, and adapting to changing market conditions. By leveraging powerful chart analysis tools like TradingView, MetaTrader 4/5, and the user-friendly VSTAR App, you can confidently navigate the gas CFD market, make well-informed trading decisions, and potentially achieve profitable outcomes.