


- Price Fluctuations: Natural gas prices varied regionally, with spikes in the Northeast due to colder temperatures and declines in the Midwest and West due to warmer weather.
- Supply-Demand Dynamics: Total U.S. consumption dropped significantly by 9.4%, impacting natural gas prices.
- International Trends: Global LNG prices decreased, indicating potential impacts on the domestic market.
- Storage and Rig Count: Higher withdrawals from storage and fluctuations in rig counts can influence future market directions.
In a week of diverse market movements, the natural gas industry witnessed regional price disparities, supply-demand shifts, and global influences. From the Northeast's surge in prices due to chilling temperatures to declines in lower consumption impacting market dynamics, the landscape is complex.
Interpretation of Data
Price Fluctuations
Henry Hub Spot and Futures Price Movements:
The Henry Hub spot price, a benchmark for natural gas prices in the U.S., experienced a modest increase of 3 cents, rising from $2.70/MMBtu to $2.73/MMBtu. Meanwhile, the January 2024 NYMEX futures contract, representing anticipated future prices, saw a notable decrease of 23.5 cents, dropping from $2.804/MMBtu to $2.569/MMBtu. This decline in futures prices could signify market sentiment expecting lower prices in the future. The 12-month strip, averaging January 2024 through December 2024 futures contracts, also declined by 23.8 cents, settling at $2.746/MMBtu. This might reflect a broader sentiment across multiple future periods, indicating a bearish outlook.
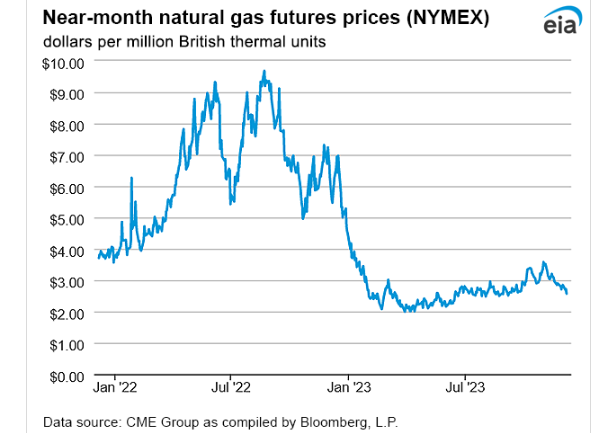
Source: eia.gov
Regional Variations:
Northeast:
In the Northeast, natural gas spot prices witnessed a substantial surge, notably at hubs like Algonquin Citygate. Prices here escalated by $6.30/MMBtu, soaring from $3.50/MMBtu to $9.80/MMBtu within the week. The sharp rise was mainly driven by increased demand due to colder temperatures, with an average of 41°F during the week. A peak of $13.13/MMBtu was recorded on Tuesday, coinciding with lower temperatures towards the end of the week, resulting in increased heating demand. Operational flow orders were issued by Algonquin Gas Transmission pipeline to manage rising demand.
Midwest:
Contrastingly, in the Midwest, specifically at the Chicago Citygate, prices experienced a decline of 18 cents, dropping from $2.55/MMBtu to $2.37/MMBtu. This decrease was influenced by warmer temperatures averaging 39°F during the week, which led to reduced residential and commercial sector consumption by 22% (2.5 Bcf/d). The region experienced 34 HDDs fewer than the normal average, contributing to a 15% decrease (3.0 Bcf/d) in natural gas consumption.
West:
Across the western regions, prices also exhibited a downward trend. At PG&E Citygate in Northern California, prices fell by $1.30, declining from $6.16/MMBtu to $4.86/MMBtu. Similar price decreases were seen at SoCal Citygate in Southern California, Opal hub in Southwest Wyoming, and Northwest Sumas on the Canada-Washington border. These declines were attributed to warmer temperatures and reduced demand, with temperatures in the Sacramento Area averaging 53°F and resulting in 85 HDDs, 28 HDDs fewer than normal.
Supply and Demand Shifts
Supply:
The overall supply of natural gas experienced a slight decline of 0.5% (0.6 Bcf/d) compared to the previous report week. This decrease was primarily driven by a reduction in dry natural gas production, which fell by 0.2% (0.2 Bcf/d) to an average of 105.0 Bcf/d. Additionally, average net imports from Canada decreased by 5.9% (0.4 Bcf/d) from the previous week. The combination of these factors contributed to the overall decrease in total supply.
Demand:
Total U.S. consumption of natural gas witnessed a substantial decline of 9.4% (9.3 Bcf/d) compared to the previous report week. This significant decrease was primarily attributed to warmer temperatures experienced across most of the Lower 48 states, leading to decreased demand for space heating. Notably, residential and commercial sector consumption dropped by 19.2% (7.8 Bcf/d). Moreover, natural gas consumed for power generation declined by 2.4% (0.8 Bcf/d), while industrial sector consumption decreased by 2.8% (0.7 Bcf/d).
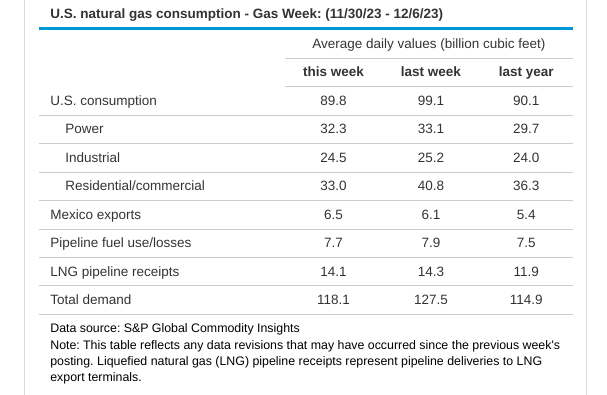
Source: eia.gov
LNG Trends
International LNG Prices:
Internationally, LNG futures prices declined during the reported week. In East Asia, the weekly average front-month futures prices for LNG cargoes dropped by 47 cents to $16.10/MMBtu. Similarly, at the Title Transfer Facility (TTF) in the Netherlands, LNG futures prices decreased by $1.06 to a weekly average of $12.91/MMBtu. Comparatively, in the same week the previous year, prices were substantially higher at $32.98/MMBtu in East Asia and $42.95/MMBtu at TTF. This significant decrease in international LNG prices might indicate a global trend of declining LNG demand or an increase in supply, impacting the broader natural gas market.
Storage and Rig Count
Storage Levels:
Net withdrawals from storage totaled 117 Bcf for the week ending December 1, significantly surpassing both the five-year average net withdrawals of 48 Bcf and last year's net withdrawals of 30 Bcf during the same week. Working natural gas stocks stood at 3,719 Bcf, which is 234 Bcf (7%) higher than the five-year average and 254 Bcf (7%) higher than the levels recorded at the same time last year. The surplus in storage levels might indicate robust demand or unexpected consumption patterns impacting storage reserves.
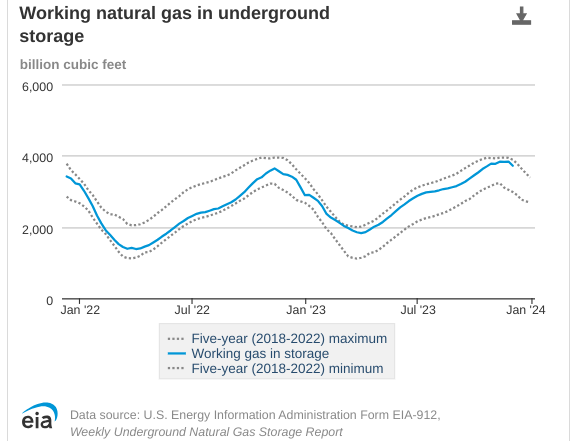
Source: eia.gov
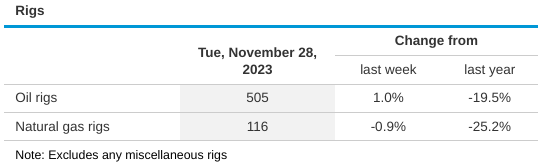
Rig Count:
The natural gas rig count experienced a slight decrease by 1 rig, standing at 116 rigs for the week ending Tuesday, November 28. Among specific regions, the Marcellus added one rig, while two rigs were removed from unidentified producing regions. Simultaneously, the number of oil-directed rigs increased by 5 rigs to a total of 505 rigs. The Permian and Cana Woodford each added three rigs, and one rig was removed from unidentified producing regions. The total rig count, including 4 miscellaneous rigs, increased by 3, reaching 625 rigs, which is 159 rigs fewer than the count reported at the same time last year.
Source: eia.gov
Implications on Price of CFDs on Natural Gas
Weather Dependency
The price movements in different regions exhibited a strong correlation with the prevailing weather conditions. Colder temperatures in the Northeast led to increased demand and subsequent price spikes, while warmer temperatures in the Midwest and West resulted in decreased demand and lower prices. This suggests that weather forecasts will continue to be a pivotal factor influencing short-term price movements in the natural gas market.
Supply-Demand Balance
The decline in total supply and the substantial drop in U.S. consumption could potentially create a tighter supply-demand balance, which might put upward pressure on prices. However, this could be counteracted by reduced demand across various sectors due to weather conditions. The balance between supply and demand will remain a critical factor impacting price directions.
International Market Trends
The decrease in international LNG prices suggests a softening of global demand or an increase in supply. While this data might not directly impact the domestic natural gas market, it indirectly influences market sentiment. Changes in international prices could have implications for U.S. natural gas export strategies and market expectations, thus influencing domestic prices over time.
Storage Levels Impact
The significantly higher-than-average net withdrawals from storage facilities indicate either unexpectedly high demand or consumption patterns impacting storage reserves. If this trend continues, it could lead to a potential deficit in storage levels, potentially exerting upward pressure on prices as markets anticipate potential supply shortages.
Rig Count Influence
Though the natural gas rig count experienced a slight decrease, monitoring this trend remains essential. The number of active rigs directly impacts future production levels. Any significant shifts in rig counts could influence market sentiment and pricing, especially concerning future supply expectations in the natural gas market.
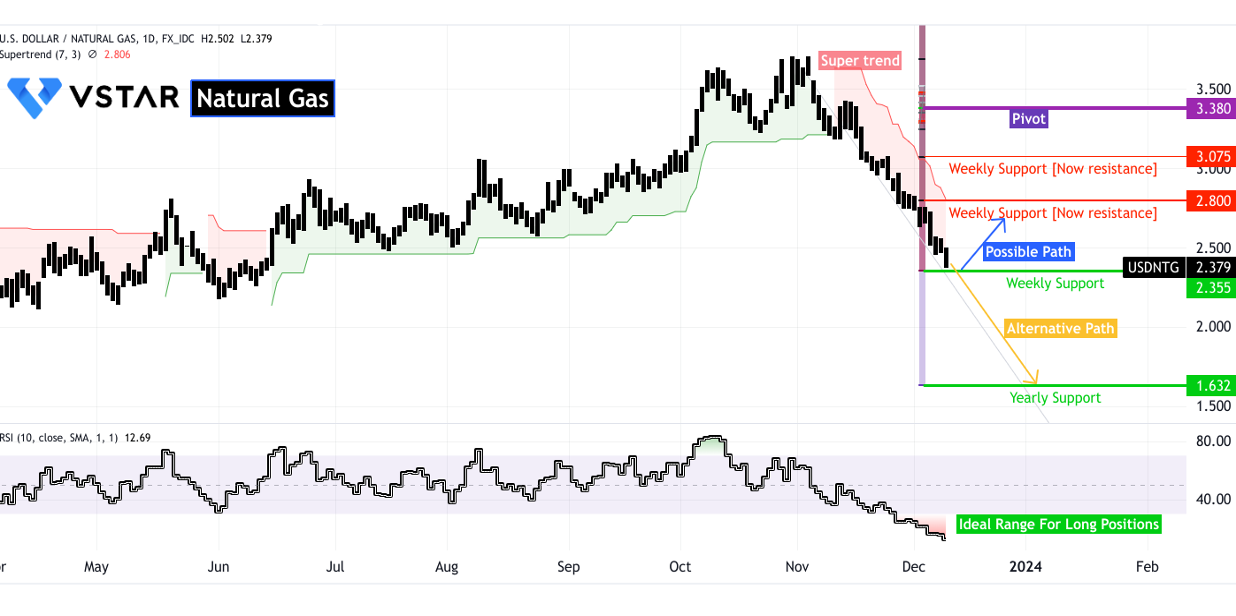
CFDs on Natural Gas: Technical Take
The current stance of Natural Gas CFDs rests crucially at $2.355, a pivotal weekly support amid the prevailing downtrend. Indications from the Relative Strength Index (RSI) (currently near 12) suggest a favorable window for initiating long positions in Natural Gas. Should this support hold, an upward price movement (indicated by the blue arrow) toward the $2.800 resistance level seems probable, given the recent inventory inflection point and supply reduction. Conversely, heightened by weakened consumption, an alternate scenario could lead to a swift descent to $1.632 (highlighted by the yellow arrow) before stabilizing and marking a sideways trend.

Source: tradingview.com
In assessing price direction, the natural gas market's regional disparities, coupled with shifting supply-demand dynamics, hint at a nuanced trajectory. While colder temperatures fueled price hikes in specific areas, overall consumption declines pose a potential downward pressure. International trends and storage fluctuations add complexity.


