


- As per the recent EIA data, Natural gas stocks surpass historical averages, indicating a 5.6% increase from the 5-year average.
- Increased production, consumption, and exports may balance the surplus, impacting CFD prices.
- Weather sensitivity affects regional prices; colder spells elevate demand, influencing price dynamics.
- Divergent international market trends hint at varying global demand patterns, shaping domestic natural gas prices.
In the volatile arena of energy markets, natural gas CFDs stand as a captivating enigma, influenced by a myriad of factors shaping their price trajectory. From surplus storage balancing on the brink of abundance to the delicate dance between escalating production, surging demand, and global market whispers, this article is a compass through this intricate landscape. The article explores the recent Natural Gas Weekly Update by the US Energy Information Administration to uncover the near-term implications of weather’s whims, the intricate dance of supply-demand equilibrium, and the telltale signs hidden within international market trends, deciphering the rollercoaster ride of natural gas CFD prices.
Natural Gas Storage Dynamics
Stock Levels and Trends
The total working gas stocks in the Lower 48 states as of 11/10/23 stood at 3,833 Bcf, marking a 5.6% increase from the 5-year average of 3,630 Bcf and a 5.4% increase from last year's inventory of 3,635 Bcf.
A scrutiny of the refill season (April 1–October 31, 2023) reveals net injections of 1,953 Bcf, 5% less than the five-year average and 9% less than the previous year’s injections, indicating a slower accumulation of inventory despite surpassing historical averages.
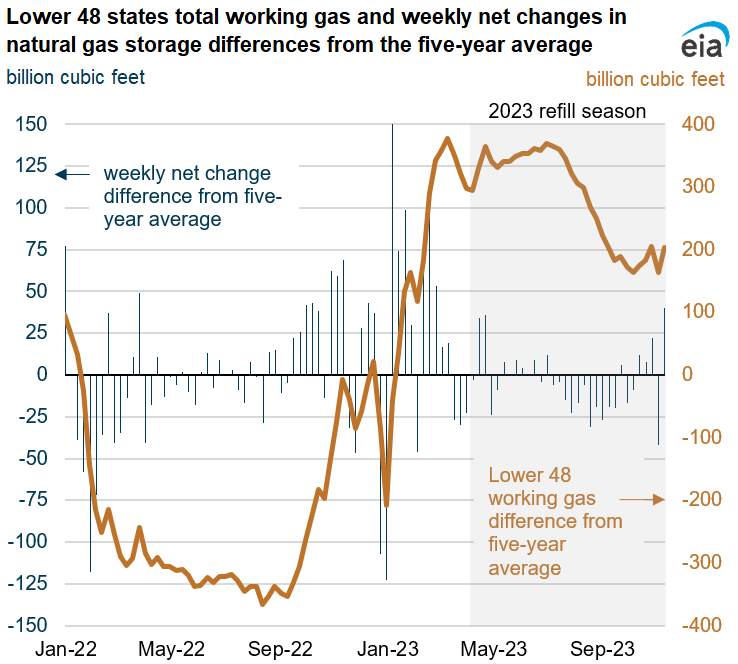
Source: eia.gov
Implications:
The surplus in storage, although less than historical averages, suggests an ample supply buffer. This surplus could exert downward pressure on CFD prices due to concerns about storage capacity constraints and potential oversupply.
Supply-Demand Balance
The 3% increase in U.S. dry natural gas production to an average of 103.8 Bcf/d during the 2023 refill season is juxtaposed against a similar 3% rise in consumption. Notably, the power sector saw a substantial 6% rise in consumption, while industrial demand increased slightly by nearly 1%. Furthermore, natural gas exports (both LNG and pipeline exports) witnessed significant upticks, with LNG exports surging by 15% and pipeline exports by 8%.
Implications:
Despite increased production, the surge in consumption across sectors and escalated exports might potentially counterbalance the surplus in storage. This equilibrium between supply and demand could stabilize prices or stimulate an upward trajectory if demand outpaces supply.
Market Highlights and Price Movements
Spot Prices and Regional Disparities
The Henry Hub spot price surged from $2.21/MMBtu to $2.87/MMBtu, reflecting a robust upward movement. Similar trends were mirrored in regional spot prices, especially in colder regions like the Northeast and West, where increased demand for heating propelled prices upward.
Implications:
Regional disparities in pricing based on weather conditions underline the sensitivity of natural gas demand to temperature fluctuations. Continued cold spells might elevate demand and subsequently influence price movements.
International Futures Prices
Divergent trends in international futures prices were witnessed: decreased LNG cargo prices in East Asia and increased prices at TTF in the Netherlands. These variations signal differing demand dynamics across global markets.
Implications:
The contrasting trends in international markets indicate a varying global demand landscape that can significantly influence the direction of CFD prices, especially considering the role of global market dynamics in shaping domestic pricing.
Rig Count, Storage Trends, and Market Sentiments
Rig Count Stability
The unchanged natural gas rig count of 118 rigs signifies stability in production activities, albeit with fluctuations in specific regions like Haynesville and Marcellus.
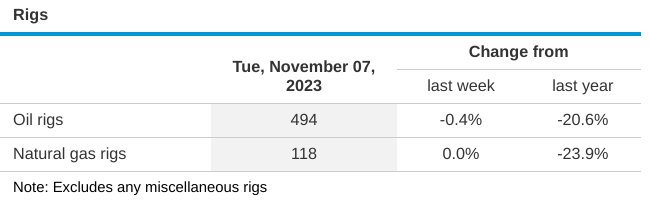
Source: eia.gov
Implications:
Stable rig counts may hint at consistent production levels, but regional fluctuations could have localized impacts on supply, influencing regional price dynamics.
Storage Trends and Market Sentiments
Consistent net injections into storage, albeit surpassing historical averages, signify a persistent surplus. This accumulation might impact market sentiments, potentially resulting in bearish outlooks due to concerns about oversupply.
Implications:
While surplus storage might suggest bearish sentiments, the equilibrium between supply and demand, weather sensitivity, and international market variations could counteract these sentiments.
Possible Implications on Price of CFDs on Natural Gas (Focus on Price Direction)
Bullish Factors
- Increased Demand: The heightened consumption in response to colder weather conditions could sustain or further elevate the demand for natural gas, providing upward price pressure.
- Lower Net Injections: Despite ample storage, the slower accumulation of reserves during the refill season may curb supply growth, potentially supporting higher prices in the near term.
- Global Trends: The movement of international markets and the rise in LNG exports suggest a global demand trajectory that could positively influence natural gas prices.
Bearish Factors
- High Storage Levels: Despite reduced net injections, the overall storage remains considerably above historical averages, indicating a surplus in supply. This surplus could potentially exert downward pressure on prices.
- Production Growth: Continued production growth in natural gas may contribute to supply surpluses, potentially driving prices down by further saturating the market.
- Seasonal Variability: The transition from the injection season to the withdrawal season often leads to heightened market volatility, potentially resulting in price fluctuations that could impact investor sentiment negatively.
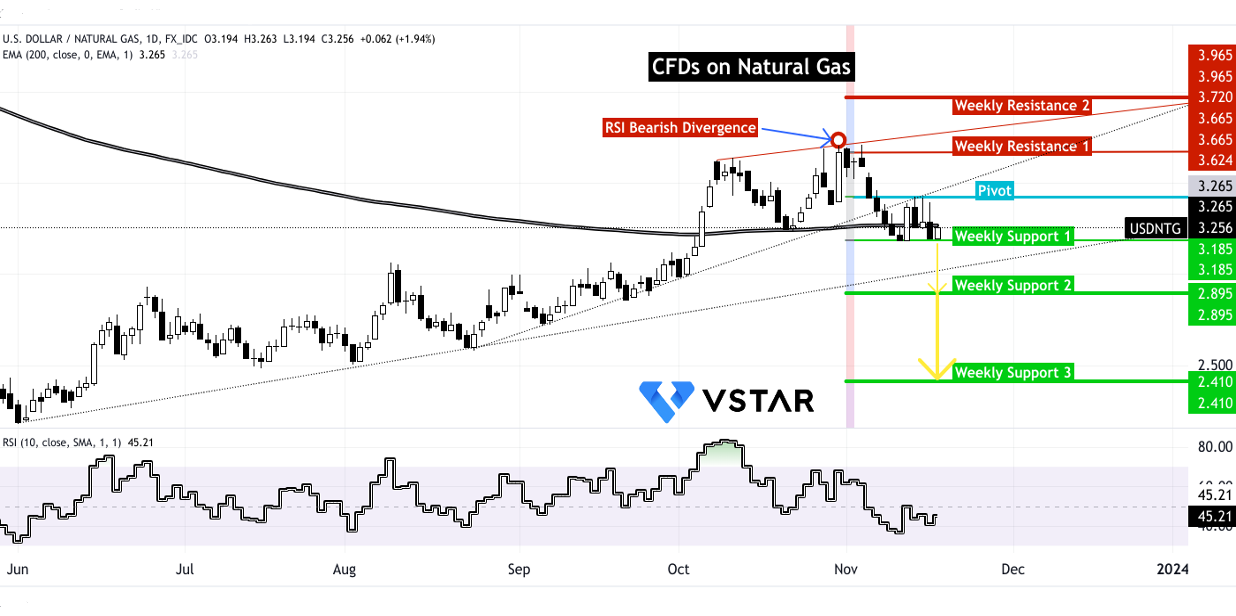
Technical Take on Natural Gas CFDs
The natural gas CFD prices encountered a loss of bullish momentum toward late October, displaying a bearish divergence concerning the Relative Strength Index (RSI). Despite finding support around $3.185, the RSI levels haven't signaled oversold conditions (below 30), implying the potential for further downside in CFD prices. There's a possibility of reaching $2.895 in the same direction, with $2.410 being a crucial support level during days of highlighted volatility.
Looking upwards, notable resistance exists at $3.665 and $3.965. However, achieving a closing above the pivot point at $3.425 appears less probable due to the 200-day Exponential Moving Average (EMA) acting as a dynamic resistance. This scenario suggests a higher likelihood of a downward trajectory (depicted by the yellow path). Furthermore, this perspective aligns with the National Oceanic and Atmospheric Administration's forecast of a warmer than expected winter in the US, which could exert additional downward pressure on gas prices in the upcoming weeks.

Source: tradingview.com
In essence, the multifaceted interplay between supply-demand fundamentals, weather dependencies, global market variations, investor sentiments, and external factors forms the complex tapestry dictating the trajectory of CFDs on natural gas. While a surplus in storage might hint at bearish sentiments, the equilibrium between supply and demand, coupled with weather sensitivities and international market dynamics, will pivotally determine price directions in this intricate and volatile market landscape.


