


Today, PDD Holdings Inc. is scheduled to release its financial results for the fourth quarter of 2023. Although analysts have provided an upbeat forecast, investors should monitor the price action before jumping into any trade.
PDD Earnings Forecast Is Solid
Based on analysts' estimates, it is anticipated that quarterly sales will amount to $11.99 billion, signifying a noteworthy expansion of 107.6% in comparison to the corresponding period of the previous year. The prevailing consensus estimate for earnings per share is $1.62, signifying a 33.9% increase compared to the prior year's fourth quarter.
Strong consumer demand is anticipated to have benefited the company in numerous product categories, including agriculture produce, FMCG, domestic electronics, and cosmetics. Also, ongoing initiatives to bolster its grocery and agriculture divisions could contribute to the company's fourth-quarter revenue.
PDD Earnings Bearish Factors
The organization's online marketing and transaction services are anticipated to maintain their strong progress, consequently propelling revenue growth during the quarter. Also, the demand for merchant advertising on PDD's platform could contribute to the company's quarterly performance.
On the negative side, Increasing costs for offline and online advertising and promotional activities might have strained the quarterly results. Additionally, the implementation of online marketing services, augmented payment processing fees, and increased costs for cloud services are anticipated to be factors to look at.
PDD Stock Technical Analysis

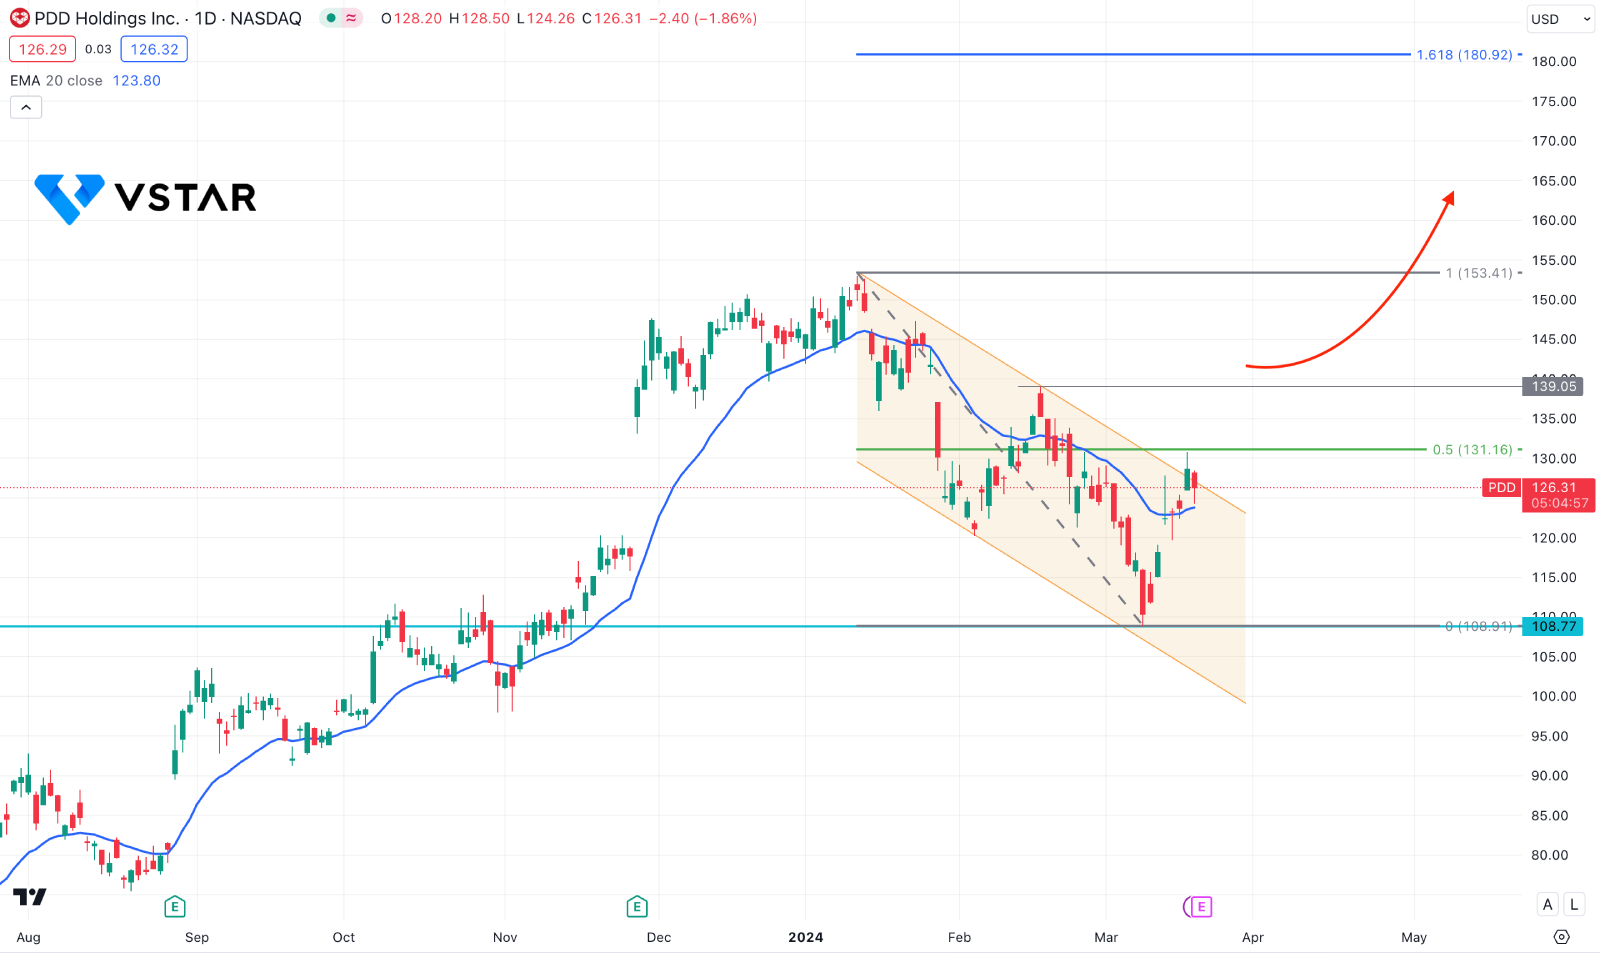
In the daily chart of PDD stock price, the ongoing upward pressure is limited by the trendline resistance, which needs a proper breakout before forming a bullish impulse. Primarily, investors should monitor the earnings report, where any upbeat result with a bullish V-shape recovery in the daily chart could be a potential long opportunity.
Moreover, the bottom is set at the 59.53 level in the weekly chart, which indicates a clear bullish trend. Therefore, any bullish signal in the daily chart could work as a valid trend trading opportunity, depending on the price action.
The recent price has already moved above the dynamic 20-day EMA with a daily candle close. Now, investors should monitor how the price reacts after the earnings report is released180.92. A solid consolidation with a daily candle above the trendline resistance could be a valid buy opportunity, targeting the 180.92 level.
The alternative scenario is a bearish channel extension, which needs a daily close below the 120.00 level before reaching the 90.00 to 82.00 zone.


