


- Reduced Mexican sugar exports to the US, affecting the market with a 7-year low forecast.
- The US compensates with increased imports, augmenting total supply by 120K short tons.
- Projected rise in US sugar exports by 65K short tons, impacting the stocks-to-use ratio.
- US stocks-to-use ratio reaches 12.8%, potentially influencing long-term price direction.
Amidst fluctuating global dynamics, the US Department of Agriculture data reveals a pivotal shift in sugar trade between Mexico and the US With Mexican exports dwindling to a 7-year low and the US maneuvering to supplement its supply through increased imports, the sugar market braces for an intriguing phase. Analysis of these alterations sheds light on the potential implications on sugar prices and market stability.
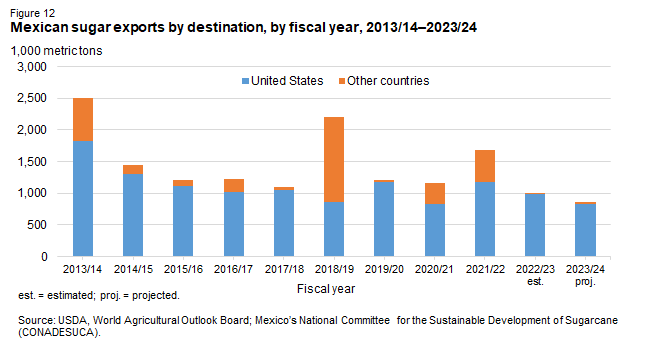
Source: ers.usda.gov
Reduced Sugar Exports from Mexico to the US
Mexico's reduced sugar production of 5.283 million metric tons coupled with lower forecasted exports to the United States (831K metric tons) indicates a 7-year low, influenced by the quality of sugar (less than 99.2 polarity). This reduction of 195K metric tons in exports from Mexico might create a scarcity in the US market, potentially impacting the supply chain and prices.
US Sugar Supply Dynamics
The US sugar supply for 2023/24 is augmented by 120K short tons, mainly due to increased imports and a surge in raw sugar imports post the reallocation of WTO tariff-rate quota by the USTR. Despite lower imports from Mexico, the US is set to compensate through increased raw sugar imports, elevating the total supply. Cane sugar production shows a slight increase in states like Louisiana and Texas.
US Sugar Exports and Stocks-to-Use Ratio
US exports are projected to increase by 65K short tons, primarily to Mexico. This uptick in export volume contributes to an overall rise in total use by 65K short tons. Consequently, the stocks-to-use ratio for the US sugar market is estimated at 12.8 percent, up from the previous month's 12.4 percent.
Short-term Price Impact
Scarcity from Reduced Mexican Exports: The reduction in Mexican sugar exports might create a short-term deficit in the US market, potentially leading to increased prices due to lower supply availability. Despite Mexico's reduced exports, the surge in US imports of raw sugar may alleviate immediate price pressures by compensating for the shortage, stabilizing prices in the short term.
Long-term Price Direction
Stocks-to-Use Ratio: The increase in the US stocks-to-use ratio (12.8 percent) suggests a slightly improved balance between supply and demand, which might exert a downward pressure on sugar prices in the long term due to an adequate stockpile. Higher US supply, though partially from increased imports, might contribute to price stability or even a downward trend if production remains robust.
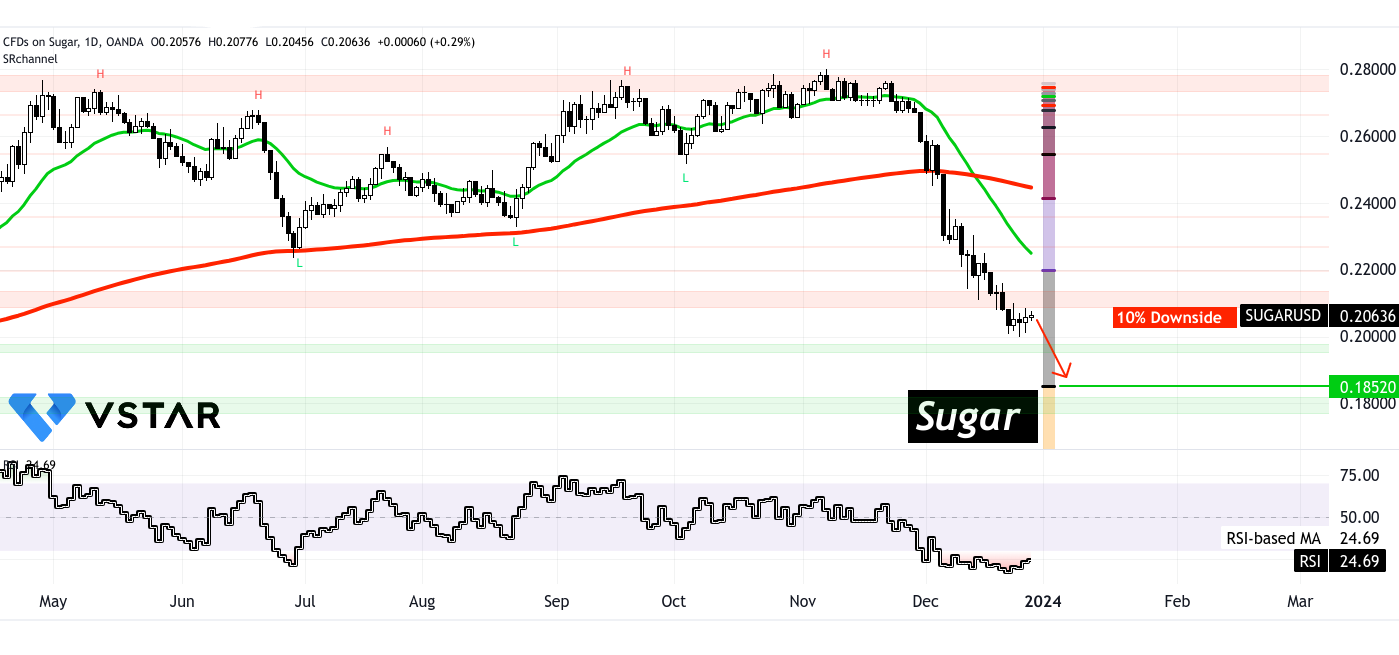
CFDs on Sugar: Technical Take
The price of CFDs on sugar is in a downtrend. Considering the technical perspective, the Relative Strength Index (RSI) signifies a lack of clear divergence. Similarly, 22- and 260-day exponential moving averages (EMAs) signal an aggressive and prolonged downtrend. However, RSI is hovering at 25 levels, indicating that there are no short opportunities left. Therefore, an accumulation phase may begin in the coming days. To be specific, the Fibonacci retracement levels are still showing a 10% downside, which is in line with the fundamental developments in the sugar supply-demand equation.
Overall, the current sugar price levels indicate the partial profit booking phase for short positions.

Source: tradingview.com
In conclusion, the US Department of Agriculture data suggests a short-term possibility of increased sugar prices in response to reduced Mexican exports to the US However, the long-term price direction might witness stabilization or even a decline due to improved stocks-to-use ratios and increased US supply. Yet, these trends depend on various ongoing factors impacting the global sugar market, demanding a vigilant approach from traders and investors in CFDs on sugar.


